Correction: Daurisoline attenuates H2O2-induced chondrocyte autophagy by activating the PI3 K/Akt/mTOR signaling pathway
Yang Zhang, Wenguang Liu, Zhonghao Liu, Yi Liu

Abstract
Genes, proteins, chemicals, diseases, species, mutations and cell lines named across the full text — each resolved to its canonical identifier and authoritative record.
Click any figure to enlarge with its caption.
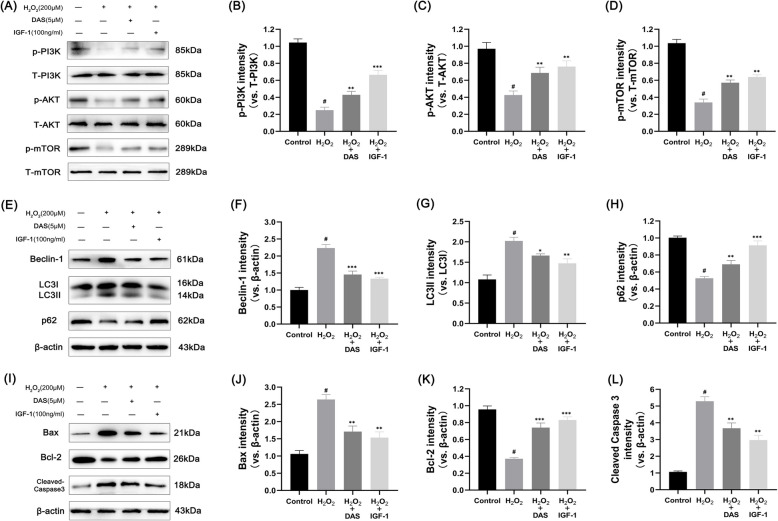 Figure 1
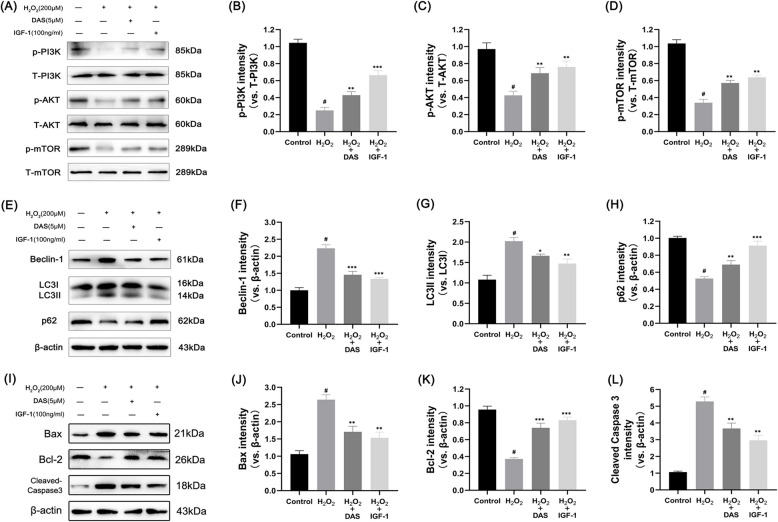 Figure 2
Peer Reviews
No public reviews on file for this paper yet. If you reviewed it on a platform where reviews are public (OpenReview, ICLR, NeurIPS, ICML), you can paste yours below so the community can read it here.
Videos
No videos yet. Explain this paper in a talk, walkthrough, or lecture? Add one.
Taxonomy
TopicsPeroxisome Proliferator-Activated Receptors · Autophagy in Disease and Therapy
Correction: J Orthop Surg Res 18:248 (2023)
https://doi.org/10.1186/s13018-023–03717-5
In this article Fig. 7 appeared incorrectly and has now been corrected in the original publication. For completeness and transparency, the old incorrect versions are displayed below.
Incorrect Fig. 7Fig. 7DAS inhibits autophagy markers and apoptosis-related factors through the PI3K/AKT/mTOR signaling pathway. A–D Western blot analysis of the protein levels of p-AKT, T-AKT, p-PI3K, T-PI3K, p-mTOR and T-mTOR and the quantification of associated proteins in the blots shown. E–H western blot and quantitative correlation analysis of Beclin-1, LC3 and p62 in chondrocytes. I–L Western blot was performed to quantitatively analyze the expression of Bax, Bcl-2 and cleaved caspase-3. The values represent the mean ± SD. #p < 0.05 versus the control group. *p < 0.05, **p < 0.01, and ***p < 0.001 versus the control group
Corrected Fig. 7Fig. 7DAS inhibits autophagy markers and apoptosis-related factors through the PI3K/AKT/mTOR signaling pathway. A–D Western blot analysis of the protein levels of p-AKT, T-AKT, p-PI3K, T-PI3K, p-mTOR and T-mTOR and the quantification of associated proteins in the blots shown. E–H western blot and quantitative correlation analysis of Beclin-1, LC3 and p62 in chondrocytes. I–L Western blot was performed to quantitatively analyze the expression of Bax, Bcl-2 and cleaved caspase-3. The values represent the mean ± SD. #p < 0.05 versus the control group. *p < 0.05, **p < 0.01, and ***p < 0.001 versus the control group
The original article has been corrected.