Correction: Inhibition of cc chemokine receptor 10 ameliorates osteoarthritis via inhibition of the phosphoinositide-3-kinase/Akt/mammalian target of rapamycin pathway
Yan Luo, Feng Zhou, Xiaojing Wang, Runwei Yang, Yi Li, Xiaochun Wu, Bin Ye

Abstract
Genes, proteins, chemicals, diseases, species, mutations and cell lines named across the full text — each resolved to its canonical identifier and authoritative record.
Click any figure to enlarge with its caption.
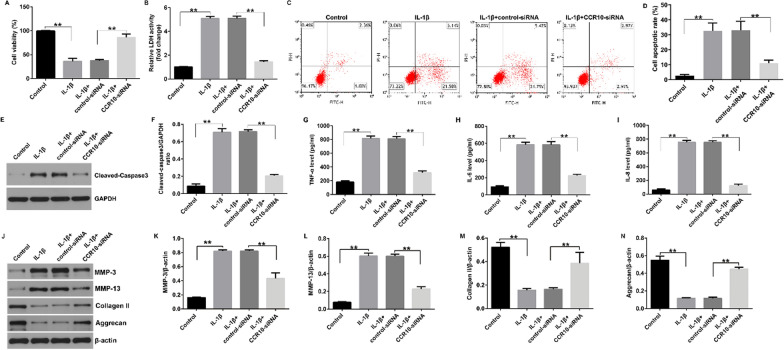 Figure 3
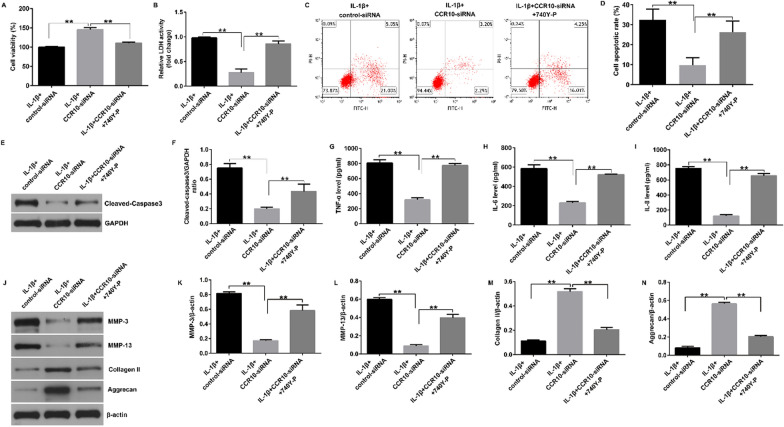 Figure 6
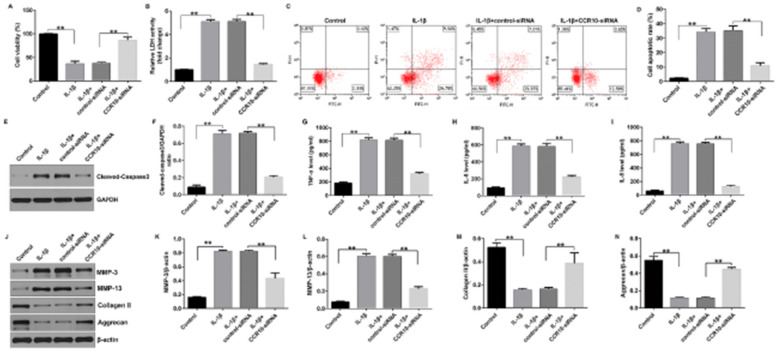 Figure 3
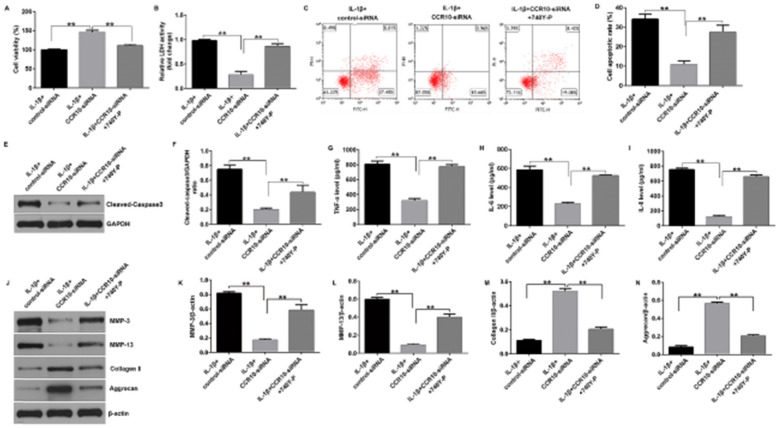 Figure 4
Peer Reviews
No public reviews on file for this paper yet. If you reviewed it on a platform where reviews are public (OpenReview, ICLR, NeurIPS, ICML), you can paste yours below so the community can read it here.
Videos
No videos yet. Explain this paper in a talk, walkthrough, or lecture? Add one.
Taxonomy
TopicsCytokine Signaling Pathways and Interactions · Inflammatory mediators and NSAID effects · Osteoarthritis Treatment and Mechanisms
**Correction to: Journal of Orthopaedic Surgery and Research (2024) 19:158 ** 10.1186/s13018-024-04642-x
In this article Figs. 3 and 6 appeared incorrectly and have now been corrected in the original publication. For completeness and transparency, the old incorrect versions are displayed below.
Incorrect Fig. 3:Fig. 3. Effects of CCR10-siRNA on IL-1β-induced cell viability, apoptosis and inflammatory cytokines secretion. The CHON-001 cells were divided into four groups: control, IL-1β, IL-1β + control-siRNA, or IL-1β + CCR10-siRNA group. (A) Cell viability was assessed using MTT assay. (B) Analysis of LDH release. (C) Apoptosis was assessed by flow cytometry. (D) Quantification of apoptotic CHON-001 cells. (E) Western blot analysis of cleaved-caspase-3 expression. (F) Relatively cleaved-caspase-3 protein expression were quantified. The secretion of TNF-α (G), IL-6 (H) and IL-8 (I) were evaluated by ELISA. (J) Western blot analysis of MMP-3, MMP-13, Collagen II, and Aggrecan. (K) MMP-3/β-actin ratio. (L) MMP-13/β-actin ratio. (M) Collagen II /β-actin ratio. (N) Aggrecan/β-actin ratio. **P < 0.01
Correct Fig. 3:Fig. 3. Effects of CCR10-siRNA on IL-1β-induced cell viability, apoptosis and inflammatory cytokines secretion. The CHON-001 cells were divided into four groups: control, IL-1β, IL-1β + control-siRNA, or IL-1β + CCR10-siRNA group. (A) Cell viability was assessed using MTT assay. (B) Analysis of LDH release. (C) Apoptosis was assessed by flow cytometry. (D) Quantification of apoptotic CHON-001 cells. (E) Western blot analysis of cleaved-caspase-3 expression. (F) Relatively cleaved-caspase-3 protein expression were quantified. The secretion of TNF-α (G), IL-6 (H) and IL-8 (I) were evaluated by ELISA. (J) Western blot analysis of MMP-3, MMP-13, Collagen II, and Aggrecan. (K) MMP-3/β-actin ratio. (L) MMP-13/β-actin ratio. (M) Collagen II /β-actin ratio. (N) Aggrecan/β-actin ratio. **P < 0.01
Incorrect Fig. 6:Fig. 6. Effects of CCR10-siRNA or 740Y-P on IL-1β-induced cell viability, apoptosis, and inflammatory cytokines secretion. The CHON-001 cells were divided into three groups: IL-1β + control-siRNA, IL-1β + CCR10-siRNA, and IL-1β + CCR10-siRNA + 740Y-P groups. (A) MTT assay for cell viability. (B) Determination of LDH level. (C) Apoptotic cells were evaluated using flow cytometry. (D) Quantification of the apoptotic cells. (E) Determination of cleaved-caspase-3 expression. (F) Quantization of cleaved-caspase-3 expression. The levels of TNF-α (G), IL-6 (H), and IL-8 (I) were analyzed using ELISA. (J) Western blot analysis of MMP-3, MMP-13, Collagen II, and Aggrecan. (K) MMP-3/β-actin ratio. (L) MMP-13/β-actin ratio. (M) Collagen II /β-actin ratio. (N) Aggrecan/β-actin ratio. **P < 0.01
Correct Fig. 6:Fig. 6. Effects of CCR10-siRNA or 740Y-P on IL-1β-induced cell viability, apoptosis, and inflammatory cytokines secretion. The CHON-001 cells were divided into three groups: IL-1β + control-siRNA, IL-1β + CCR10-siRNA, and IL-1β + CCR10-siRNA + 740Y-P groups. (A) MTT assay for cell viability. (B) Determination of LDH level. (C) Apoptotic cells were evaluated using flow cytometry. (D) Quantification of the apoptotic cells. (E) Determination of cleaved-caspase-3 expression. (F) Quantization of cleaved-caspase-3 expression. The levels of TNF-α (G), IL-6 (H), and IL-8 (I) were analyzed using ELISA. (J) Western blot analysis of MMP-3, MMP-13, Collagen II, and Aggrecan. (K) MMP-3/β-actin ratio. (L) MMP-13/β-actin ratio. (M) Collagen II /β-actin ratio. (N) Aggrecan/β-actin ratio. **P < 0.01