Estimated Costs and Cost-Effectiveness of a Pediatric Weight Management Program
Meg Simione, Sophie Wagner, Caroline J. Kistin, Kelsey A. Egan, Sheila Kelly, William G. Adams, Elsie M. Taveras, Chin Hur

TL;DR
This study estimates that a pediatric weight management program is cost-effective, with a cost of about $10,554 per quality-adjusted life-year gained.
Contribution
The study introduces a simulation model to estimate implementation costs and cost-effectiveness of a pediatric weight management program in primary care.
Findings
The Connect for Health program had a cost-effectiveness ratio of $10,554 per quality-adjusted life-year gained.
Startup costs were estimated at $58,000 and ongoing monthly costs at $1,300.
A cohort of 534 children was needed to effectively amortize program costs.
Abstract
What are the estimated costs and cost-effectiveness of implementing Connect for Health, a systems-level pediatric weight management program, in primary care settings? In this economic evaluation of 2494 individuals, the Connect for Health program was associated with a cost-effectiveness ratio of $10 554 per quality-adjusted life-year gained over a 2-year implementation period. These findings suggest that the Connect for Health program is a potentially cost-effective strategy for managing childhood obesity in primary care settings, particularly when implemented at scale. This economic evaluation examines a simulated model of the Connect for Health program to estimate the costs of implementing the program and assessing its cost-effectiveness. Childhood obesity remains a significant public health challenge, with ongoing racial, ethnic, and socioeconomic disparities in its prevention…
Genes, proteins, chemicals, diseases, species, mutations and cell lines named across the full text — each resolved to its canonical identifier and authoritative record.
Click any figure to enlarge with its caption.
 Figure
| Phase and category | Cost, $ | SA Range, $ |
|---|---|---|
| Preimplementation | 45 825 | 22 913-68 738 |
| Text messaging program and execution fees | 18 502 | 9251-27 753 |
| Design and build EHR tools | 11 777 | 5888-17 665 |
| Identify and train implementation team members | 7549 | 3775-11 324 |
| Conduct clinician interviews and caregiver surveys to understand program and implementation needs | 6121 | 3061-9182 |
| Conduct meetings about program implementation to gain buy-in | 721 | 360-1081 |
| Perform clinical environment and workflow audits to prepare for implementation | 594 | 297-892 |
| Educate, inform, and train clinicians on the intervention | 561 | 280-841 |
| Implementation | 21 960 | 10 980-32 939 |
| Educate, inform, and train clinicians on the intervention | 9546 | 4773-14 319 |
| Survey families regarding experience of care | 5589 | 2795-8384 |
| Monitor usage of EHR tools | 3504 | 1752-5256 |
| Align program with quality improvement initiative | 2388 | 1194-3581 |
| Provide program feedback to clinicians about their use of EHR tools | 932 | 466-1398 |
| Maintenance | 18 340 | 9170-27 511 |
| Annual operating expenses for text messaging program | 13 154 | 6577-19 731 |
| Conduct ongoing clinician training, practice facilitation, and technical assistance | 2411 | 1205-3616 |
| Provide program feedback to clinicians about their use of EHR tools | 1550 | 775-2326 |
| Monitor usage of EHR tools | 429 | 215-644 |
| Adapt EHR tools as needed | 796 | 398-1194 |
| Parameter | Estimate (SE) | Distribution | Source |
|---|---|---|---|
| BMI | |||
| Baseline | 1.91 (0.53) | NA | Taveras et al,20 2017 |
| 1 y | −0.04 (0.04) | β | Taveras et al,20 2017 |
| 2 y | −0.06 (0.07) | β | Taveras et al,26 2018 |
| Utilities | |||
| Initial utility | 0.80 (0.02) | NA | Keating et al,30 2011 |
| 1 Unit of BMI | 0.04 (0.02) | β | Bairdain and Samnaliev,20 2015 |
| Costs | |||
| Program initial cost | $67 784 ($33 892) | γ | Methods |
| Program continuing costs | $1528 ($764) | γ | Methods |
| Strategy | Cost | Incremental cost | Effectiveness, QALY | Incremental effectiveness, QALY | ICER, $/QALY gained |
|---|---|---|---|---|---|
| No intervention | $0.00 | NA | 1.6204 | NA | NA |
| Connect for Health | $40.87 | $40.87 | 1.6243 | 0.0039 | $10 553.68 |
Peer Reviews
No public reviews on file for this paper yet. If you reviewed it on a platform where reviews are public (OpenReview, ICLR, NeurIPS, ICML), you can paste yours below so the community can read it here.
Videos
No videos yet. Explain this paper in a talk, walkthrough, or lecture? Add one.
Taxonomy
TopicsObesity, Physical Activity, Diet · Health Systems, Economic Evaluations, Quality of Life · Child and Adolescent Health
Introduction
Childhood obesity continues to be highly prevalent, with persistent racial, ethnic, and socioeconomic disparities despite ongoing national efforts at prevention and treatment.^1,2,3,4^ Prevention and treatment programs are needed in the pediatric primary care setting due to the lack of options available for addressing obesity among children,^5^ particularly those who are from low-income families and from minoritized racial and ethnic groups who are less likely to receive obesity-related care.^6^ Studying program implementation is important not only to understand how to promote uptake in primary care but also to understand the costs of implementing programs and program cost-effectiveness. Economic evaluations provide decision-makers with complete information that allows them to assess the true costs of implementation, helping them make informed investment decisions, especially given limited resources.^7,8,9^ This understanding can facilitate the spread, equitable uptake, and sustainment of effective interventions for children at high risk for obesity and its complications.
Previous studies have emphasized the importance of preventative programs and sustained management to mitigate the long-term consequences of obesity. However, few studies have examined the costs of implementing childhood obesity interventions despite the critical importance of the information to ensuring all children, particularly children who are from low-income families and from racial and ethnic minoritized groups, have access to the care they require.^10,11,12,13,14^ Additionally, studies that have examined cost-effectiveness often focus on the costs related to the intervention and exclude the costs required to implement and maintain a program.^9,15,16,17,18^
We conducted an economic evaluation of Connect for Health, an evidence-based, systems-level pediatric weight management program for primary care, which was specifically designed to support children from low-income families and from racially and ethnically minoritized groups who are disproportionately affected by obesity.^19,20^ The purpose of the study was to develop and analyze a simulation model of the Connect for Health program to estimate the costs of implementing the program and assess its cost-effectiveness.
Methods
This economic evaluation was approved by the institutional review board at Mass General Brigham. We followed the Consolidated Health Economic Evaluation Reporting Standards (CHEERS) reporting guideline^23^ to conduct the current study and present the results of our analysis. Informed consent was not required because it was deidentified data of an existing dataset.
Connect for Health is a pediatric weight management program for children ages 2 to 12 years that leverages clinical and community resources by guiding primary care clinicians in screening and best management practices through clinical decision support tools, providing families with educational materials to support behavior change, and providing families with information about resources in their community (ie, community resource guide). The 1-year randomized clinical trial (RCT) of Connect for Health examined the comparative effectiveness of enhanced primary care (clinical decision support tools, family educational materials, and a text-messaging program) vs enhanced primary care plus individualized health coaching.^19,20^ Both groups of the RCT improved child BMI and quality of life.^20^ Following the RCT, the program was adapted for dissemination to organizations that serve low-income children and children from racially and ethnically minoritized groups,^21^ and a study was conducted to evaluate strategies to promote the uptake of Connect for Health.^22^ The implementation strategies included conducting clinician training; providing technical assistance, practice facilitation, and feedback to program users; creating a virtual learning community; and aligning the program with the health care system’s performance metrics. Detailed cost data about implementation for this study were collected at pediatric primary care practices and community health centers at Boston Medical Center (BMC) and Massachusetts General Hospital (MGH), 2 health care systems that serve the Greater Boston, Massachusetts, area. The study protocols that include detailed descriptions of the intervention, the RCT and implementation study, and implementation strategies have previously been reported.^19,22^
Costing Methodology
We estimated the costs of Connect for Health from a health system perspective with the goal of providing critical information for other health care systems considering and planning implementation of the program. With the objective of making the costs of our 2 sites more generalizable to the rest of the nation, we adopted a time-driven activity-based costing (TDABC), also called microcosting, approach to estimate costs associated with program activities. This approach involves delineating activities undertaken and quantifying personnel time, wages, and event frequency.^24^ In addition to TDABC of personnel resources, we identified nonpersonnel costs associated with supplies and services needed for the program. Costs were systematically gathered and categorized into their respective predefined phase of the program rollout, including preimplementation, implementation, and maintenance. The preimplementation phase was dedicated to planning and stakeholder engagement, the program launch marked the implementation period, and maintenance began when we gradually reduced grant funding.^22^
We calculated personnel time based on hourly estimates collected during the preimplementation and implementation phases of the program. Time estimates were compiled through review of program records, administrative documents, and calendar data where applicable. Personnel times were aggregated for each activity and multiplied by national hourly wage estimates from the Bureau of Labor Statistics’ (2023) Occupational Employment Statistics according to an individual’s position title and degree.^25^ A standard fringe rate of 32% was applied to all wages. Nonlabor costs for supplies and text messaging operations were based on actual expenditures tracked through receipts and payment invoices.
We gathered cost estimates from both sites (eTable 1 in Supplement 1) and then used them to calculate the anticipated expenses that future implementation sites are likely to incur (Table 1 and eTable 2 in Supplement 1). The coordinating center, MGH, had costs for developmental activities to prepare the program for implementation which would not be expected of future sites; thus, we excluded them from our analysis (eTable 3 in Supplement 1). Costs that would be incurred during the maintenance phase were determined from data and expert consensus across multiple implementation sites. All cost calculations were made in 2025 US dollars.
Sensitivity Analysis
To account for uncertainty of our cost estimates, we conducted sensitivity analyses, which were performed within the broader cost-effectiveness evaluation using a Markov model detailed in the following section. In the sensitivity analysis, we established a lower cost boundary for the intervention by considering scenarios where institutions already had electronic health record (EHR) best practice alerts in place, reducing the need for additional resources. We varied all other costs by 50% more or less of their estimated value. These adjustments allow us to better understand the impact of cost uncertainties on the overall economic evaluation of the program.
Cost-Effectiveness Analysis
We developed a Markov cohort model to evaluate the economic and clinical outcomes of the Connect for Health RCT compared with a no-intervention standard care scenario. The model operated over 2 years, reflecting the follow-up period of the Connect for Health RCT,^20,22,26^ which provided the necessary data for our analysis. The model simulated the BMI z score trajectories of children with baseline characteristics from the enhanced primary care arm in the RCT (Table 2).^22,26^ The model compares 2 strategies: (1) no intervention and (2) Connect for Health. Each month in the model, individuals in either strategy could either maintain their current BMI z score, reduce their BMI z score, or die from all-cause mortality (eFigure in Supplement 1). We derived a natural BMI trajectory estimating BMI change without treatment from the US Centers for Disease Control and Prevention’s extended BMI-for-age growth charts.^27^ In the no intervention strategy, we assumed no treatment was received, and no change in BMI z score occurred, following approaches used in prior studies.^28^ BMI change z score changes for patients in the Connect for Health strategy were modeled from those observed in the enhanced primary care group of the Connect for Health RCT at 1 and 2 years.^20,26^
An increase in utility was incorporated based on a reduction in BMI z score, reflecting the reported association between BMI and health-related quality of life.^29^ Initial quality of life utility values for individuals with a BMI at or above the 85th percentile were sourced from published literature.^29^ We categorized the estimated costs of Connect for Health as 1-time or continuing and applied them at the model’s start and monthly, respectively, in the Connect for Health strategy, while the no intervention was assumed to have no costs (Table 1). The model cohort consisted of 2494 eligible children (with BMI in the 85th percentile or higher), based on baseline estimates at BMC,^22^ which also served as the primary reference for our cost assessments. We applied a discount rate of 3% for future costs and utilities.^30^
Statistical Analysis
Our primary endpoints included quality-adjusted life-years (QALYs), total costs per patient treated in 2025 US dollars, and incremental cost-effectiveness ratios (ICERs). An ICER is the ratio of the increase in costs to the increase in QALYs between 2 strategies; in this analysis, no intervention serves as the reference strategy. A strategy is deemed cost effective if the ICER is below the willingness-to-pay (WTP) threshold of 100 000 per QALY.^[31](#zoi250364r31)^ The preferred strategy maximizes QALYs while maintaining an ICER below 100 000 per QALY. Secondary end points examined the mean change in BMI z scores from baseline.
Sensitivity Analysis
We conducted 1-way and probabilistic sensitivity analyses to account for uncertainty in model inputs and to validate model outcomes. In 1-way sensitivity analysis, key parameters vary 1 at a time while all others retain their base-case value. Ranges for BMI z score changes were derived from the Connect for Health RCT,^20,26^ while ranges for utilities were derived from the literature.^29,32,33^ Probabilistic sensitivity analyses involved simulating the model multiple times, drawing parameter values from γ distributions for costs and β distributions for clinical and utility parameters. We determined the percentage of times each strategy was preferred over a range of WTP thresholds. All analyses were performed using Python software version 3.9.19 (Python) from October 2023 to March 2025.
Results
Costing Results
The costing results of the preimplementation, implementation, and maintenance phases are shown in Table 2. Preimplementation costs totaled approximately 22 913-18 502 (SA range: 27 753) for a single site.
Implementation costs were estimated at 10 980-18 340 (SA range: 27 511) annually. This phase included costs for the regular operation of the text messaging program and continuous training and technical assistance, ensuring sustained program effectiveness and adaptability.
Cost-Effectiveness Results
The model reproduced the baseline population and BMI distribution of the Connect for Health RCT, simulating 2494 children at a mean (SD) age of 8 (3.0) years with a starting mean (SD) BMI z score of 1.91 (0.56), of whom 1178 were female (47%). The model replicated the relative change in BMI z score from baseline, reflecting the intention-to-treat values from the enhanced primary care strategy of the Connect for Health RCT. In the base case, the Connect for Health strategy resulted in a relative BMI z score change from baseline of 0.10 after 2 years. The strategy led to an incremental gain of 0.0039 QALYs compared with no intervention. The Connect for Health strategy costs 10 554 per QALY gained, indicating the cost-effectiveness of the intervention under the WTP threshold of $100 000 per QALY (Table 3).
Sensitivity Analysis
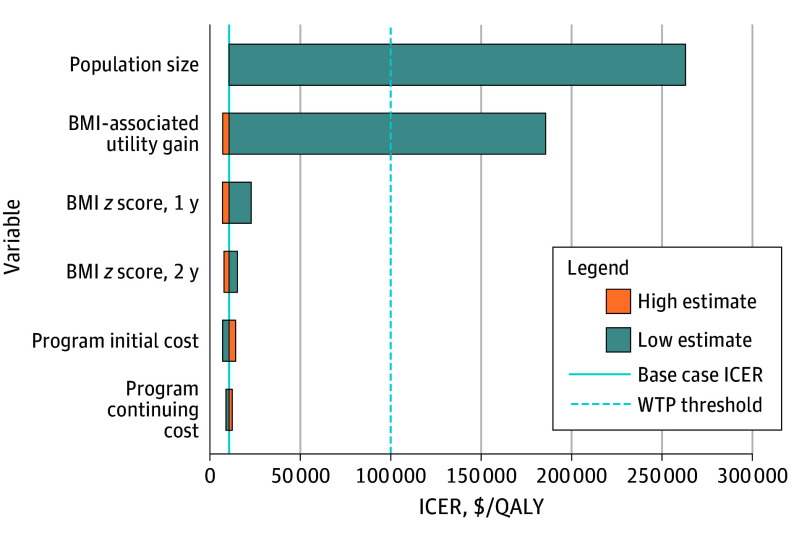
Uncertainty in model inputs and their impact on results was explored through both 1-way and probabilistic sensitivity analyses. One-way sensitivity analyses found that the model’s outcomes were most sensitive to changes in the number of patients in the program’s population and quality of life utility value associated with BMI z score reduction (Figure). When the population size was reduced to below 534 individuals, the ICER exceeded the WTP threshold. This suggests that the economic viability of the Connect for Health strategy relies on maintaining sufficient enrollment levels, effectively amortizing substantial startup costs across a larger number of participants to minimize cost per patient. Notably, despite the uncertainty in quality-of-life utility values associated with BMI changes in children, our analysis indicated that the strategy was cost-effective with a utility increase of only 0.009 for a full unit reduction in BMI z score. This finding supports the program’s effectiveness amid variability in these estimates. Probabilistic sensitivity analysis, which incorporated variability in all model parameters simultaneously, further confirmed the stability of the model results. It found that in 85% of 10 000 iterations, the Connect for Health strategy remained the preferred option under the WTP threshold of $100 000 per QALY at 2 years.
Connect for Health Weight Management Program 1-Way Sensitivity Analysis Results, No Intervention vs Connect for HealthWhen patient population size decreases to fewer than 534 participants in the Connect for Health program, the incremental cost-effectiveness ratio (ICER) exceeds the willingness-to-pay (WTP) threshold, rendering the program not cost-effective when all other parameters remain constant. ICERs were 185 745 for body mass index (BMI)–associated utility gain, 15 181 for BMI z score change at 2 years, 12 321 for program continuing cost. The expected value is $10 554. QALY indicates quality-adjusted life-year.
Discussion
In this economic evaluation, we assessed the implementation costs and cost-effectiveness of Connect for Health, a systems-level pediatric weight management program, over 2 years compared with no intervention, with the primary goal of informing decisions about implementing similar programs in health care systems across the US. Distinct from other cost-effectiveness studies, our methodology leveraged implementation costs in the clinical setting to project expenses at future sites. We estimated the total startup cost to be approximately 1500. The study found a modest incremental gain in QALYs per individual but achieved a favorable ICER of 100 000 per QALY, largely because the costs, when spread over the patient population, were not very high. These findings underscore the dependency of the program’s economic viability on a sufficient scale, highlighting the need to maintain a minimum population size to effectively distribute startup costs. The sensitivity analyses were robust to input variations, such as utilities, cost, and BMI change. Given the substantial margin under the WTP threshold, we can infer that the program is likely to remain cost-effective across various health care settings despite differences in resource availability, patient demographics, and existing health care infrastructure.
Connect for Health supports clinicians in screening and best management practices and provides family education for behavior change. In a clinical trial, it was found to reduce BMI z score,^20^ demonstrating that results can be achieved with minimal resources at a systems level. Cost-effectiveness studies have been conducted on intensive health behavior and lifestyle treatment programs that meet the 26-contact-hour requirements recommended by the American Academy of Pediatrics (AAP) and the US Preventive Services Task Force (USPSTF).^34,35,36^ These studies have reported positive child BMI outcomes but require more resources than Connect for Health and are, therefore, more expensive.^15,37^ Additionally, to date, few studies have reported the costs of implementation or maintenance and have considered this when calculating cost-effectiveness.^9,15,16,17^ By incorporating implementation costs, we have represented the program’s true costs, which allows health care systems to make informed decisions when adopting a program, leading to program sustainability.^7,8,9^
Our system-level approach to providing obesity-related care has shown that even lower-cost interventions can be an effective adjunct in managing childhood obesity. Connect for Health aligns with the AAP’s clinical practice guidelines and USPSTF’s recommendations^36,38^ in providing screening, evaluating medical comorbidities, and behavior change support as a necessary complement to high-intensity programs to reduce racial, ethnic, and socioeconomic disparities. The program ensures all children are identified, screened, and receive the care they require, highlighting the potential for less intensive, more affordable interventions to deliver meaningful results in childhood obesity management. Given the absence of programs in pediatric primary care, a system-level, cost-effective program is critically needed.
The Connect for Health Program offers a viable model for health care systems—particularly serving children from low-income communities who have historically not received adequate obesity-related care—to integrate effective pediatric weight management programs. Fifty-seven percent of federally qualified health centers that receive federal funding would have a sufficient patient cohort size (over 534 children with overweight or obesity) to implement the program cost-effectively and would reach approximately 1.85 million children (eMethods in Supplement 1).^39,40,41^ This finding underscores the program’s broad feasibility and potential impact on reducing pediatric obesity rates and improving health outcomes for children. Policymakers and health care organizations should recognize the program’s relevance and prioritize sustained funding for such programs that provide care at a systems level. Providing necessary care and education to children now will have implications and cost savings for Medicaid and health care systems in the future. Furthermore, investing in future sites and studying long-term impacts can provide additional validation of the program’s cost effectiveness and inform broader policy decisions.
Limitations
This study has limitations. Our cost estimates were primarily derived from 2 health care systems in the northeastern US, which may not reflect cost structures in different geographic locations or health care settings. Moreover, our estimates for the cost and effect of intervention were based on a single trial and follow-up cohort, potentially limiting generalizability. However, probabilistic sensitivity analyses allowed us to generate uncertainty intervals around the model estimates and final conclusions. Furthermore, the analysis was constrained by the 2-year follow-up data from the Connect for Health RCT, limiting our ability to evaluate long-term outcomes and cost-effectiveness. Additionally, while we assumed no BMI z-score change in the absence of treatment, BMI can fluctuate in the clinical setting due to a myriad of reasons. Future research incorporating longer-term observational data may help refine this assumption. The impact of extending the program’s time horizon was not explored due to limited follow-up data, as extrapolating beyond 2 years would have required strong assumptions about long-term BMI trajectories. Finally, the findings indicate significant sensitivity to population size, highlighting potential challenges in smaller-scale implementations or settings with fluctuating patient volumes.
Conclusions
The findings of this economic evaluation suggest that the Connect for Health program demonstrated economic viability and effectiveness in managing childhood obesity. Policymakers and health care clinicians should recognize the program’s relevance and prioritize sustained funding for pediatric weight management programs that screen and provide clinician guidance and family education at a systems level. Investing in future sites and studying long-term impacts can further validate the program’s cost-effectiveness and inform broader policy decisions.
The reference list from the paper itself. Each links out to its DOI / PubMed record.
- 1Ogden CL, Fryar CD, Hales CM, Carroll MD, Aoki Y, Freedman DS. Differences in obesity prevalence by demographics and urbanization in US children and adolescents, 2013-2016. JAMA. 2018;319(23):2410-2418. doi:10.1001/jama.2018.515829922826 PMC 6393914 · doi ↗ · pubmed ↗
- 2Rossen LM, Schoendorf KC. Measuring health disparities: trends in racial-ethnic and socioeconomic disparities in obesity among 2- to 18-year old youth in the United States, 2001-2010. Ann Epidemiol. 2012;22(10):698-704. doi:10.1016/j.annepidem.2012.07.00522884768 PMC 4669572 · doi ↗ · pubmed ↗
- 3Hu K, Staiano AE. Trends in obesity prevalence among children and adolescents aged 2 to 19 years in the US from 2011 to 2020. JAMA Pediatr. 2022;176(10):1037-1039. doi:10.1001/jamapediatrics.2022.205235877133 PMC 9315946 · doi ↗ · pubmed ↗
- 4Hales CM, Fryar CD, Carroll MD, Freedman DS, Ogden CL. Trends in obesity and severe obesity prevalence in US youth and adults by sex and age, 2007-2008 to 2015-2016. JAMA. 2018;319(16):1723-1725. doi:10.1001/jama.2018.306029570750 PMC 5876828 · doi ↗ · pubmed ↗
- 5Goodman AB, Porter RM, Sucosky MS, Belay B, Dooyema C, Blanck HM. Moving pediatric healthy weight interventions into real-world settings, using implementation science to address access, flexibility, and sustainability. Child Obes. 2021;17(S 1):S 5-S 10. doi:10.1089/chi.2021.2901334569837 · doi ↗ · pubmed ↗
- 6Johnson VR, Acholonu NO, Dolan AC, Krishnan A, Wang EHC, Stanford FC. Racial disparities in obesity treatment among children and adolescents. Curr Obes Rep. 2021;10(3):342-350. doi:10.1007/s 13679-021-00442-033988825 PMC 8120762 · doi ↗ · pubmed ↗
- 7Powell BJ, Fernandez ME, Williams NJ, . Enhancing the impact of implementation strategies in healthcare: a research agenda. Front Public Health. 2019;7:3. doi:10.3389/fpubh.2019.0000330723713 PMC 6350272 · doi ↗ · pubmed ↗
- 8Glasgow RE, Emmons KM. How can we increase translation of research into practice? types of evidence needed. Annu Rev Public Health. 2007;28:413-433. doi:10.1146/annurev.publhealth.28.021406.14414517150029 · doi ↗ · pubmed ↗