SARS-CoV-2 Genomic Surveillance from Community-Distributed Rapid Antigen Tests, Wisconsin, USA
Isla E. Emmen, William C. Vuyk, Andrew J. Lail, Sydney Wolf, Eli J. O’Connor, Rhea Dalvie, Maansi Bhasin, Aanya Virdi, Caroline White, Nura R. Hassan, Alex Richardson, Grace VanSleet, Andrea Weiler, Savannah Rounds-Dunn, Kenneth Van Horn, Marc Gartler, Jane Jorgenson

TL;DR
This paper shows how community rapid antigen tests can be used to track SARS-CoV-2 variants after traditional testing declined.
Contribution
The study introduces a community-based approach to sustain genomic surveillance using rapid antigen tests.
Findings
127 SARS-CoV-2 genome sequences were generated from 227 rapid antigen test samples.
Lower cycle threshold values in some tests correlated with successful sequencing outcomes.
Community-based RAT collection proved practical for genomic surveillance post-public health emergency.
Abstract
In the United States, SARS-CoV-2 genomic surveillance initially relied almost entirely on residual diagnostic specimens from nucleic acid amplification–based tests. However, use of those tests waned after the end of the COVID-19 Public Health Emergency on May 11, 2023. In Dane County, Wisconsin, we partnered with local- and state-level public health agencies and the South Central Library System to continue genomic surveillance by obtaining SARS-CoV-2 genome sequences from freely available community rapid antigen tests (RATs). During August 15, 2023–February 29, 2024, we received 227 RAT samples, from which we generated 127 sequences with >10× depth of coverage for >90% of the SARS-CoV-2 genome. In a subset of tests, lower cycle threshold values correlated with sequence success. Our results demonstrated that collecting and sequencing results from RATs in partnership with community sites…
Genes, proteins, chemicals, diseases, species, mutations and cell lines named across the full text — each resolved to its canonical identifier and authoritative record.
Click any figure to enlarge with its caption.
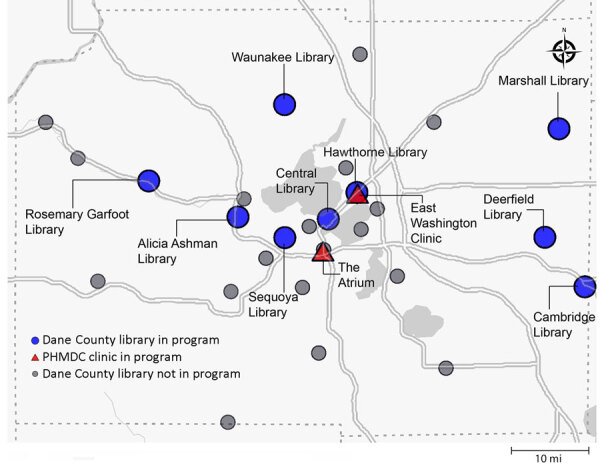 Figure 1
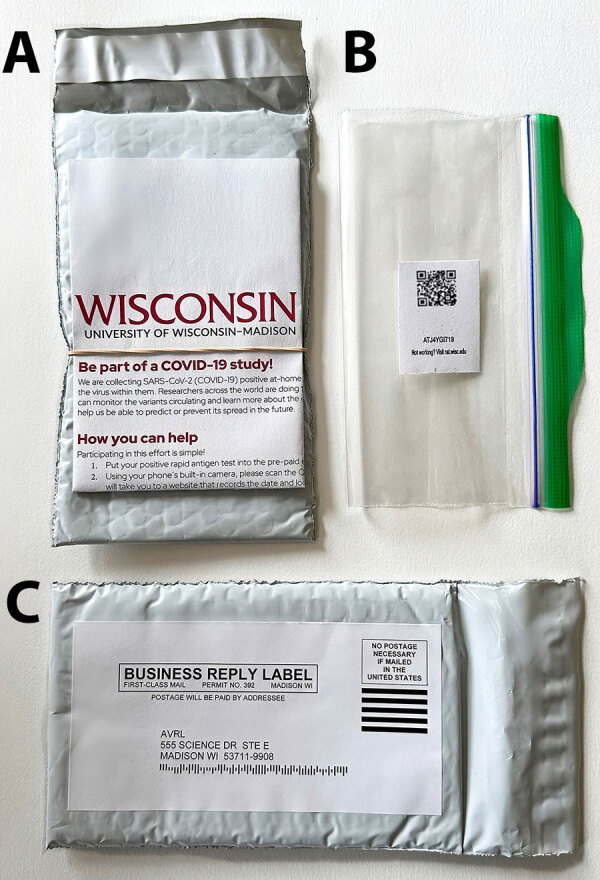 Figure 2
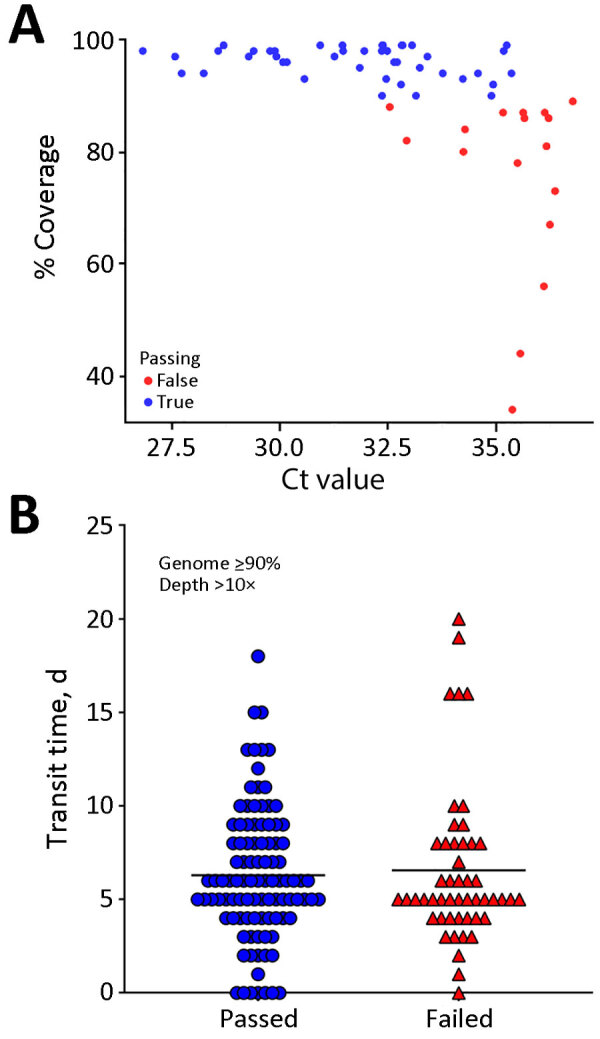 Figure 3
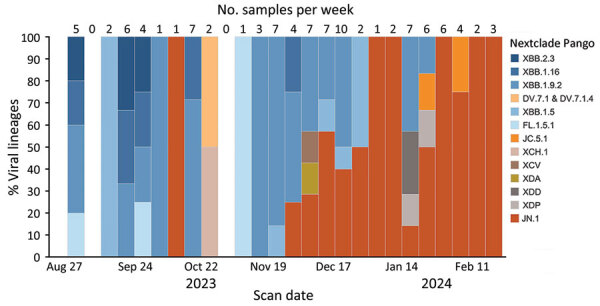 Figure 4
| Collection month | Approximate no. packets supplied for RAT collection | No. packets with positive tests | No. tests that passed sequencing quality threshold† |
|---|---|---|---|
| 2023 | |||
| Aug | 100 | 13 | 5 |
| Sep | 1,470 | 33 | 14 |
| Oct | 1,390 | 37 | 18 |
| Nov | 2,405 | 33 | 21 |
| Dec | 300 | 46 | 28 |
| 2024 | |||
| Jan | 1,160 | 28 | 20 |
| Feb | 950 | 33 | 21 |
| Total no. | 7,775 | 223 | 127 |
| Date† | Highest percentage‡ |
| Second highest percentage§ | No. RATs with passing sequence¶ | Other lineages detected via RAT sequencing | ||
|---|---|---|---|---|---|---|---|
| Wastewater lineage | Matching RAT lineages | Wastewater lineage | Matching RAT lineages | ||||
| 2023 Aug 28 | EG.5.1 | EG.5.1.4 |
| XBB.1.16 | XBB.1.16.11 | 5 | FL.1.5.1, XBB.2.3 |
| 2023 Sep 11 | EG.5.1 | EG.5.1.13 |
| XBB.1.16 | XBB.1.16 | 8 | XBB.1.5.10, XBB.1.5, GE.1,HK.9, JF.1.1, HH.1 |
| 2023 Sep 25 | EG.5.1 | EG.5.1.4 |
| XBB.1.16 | XBB.1.16 | 4 | GJ.1.2, FL.1.5.1 |
| 2023 Oct 9 | EG.5.1 | HV.1, HV.1.8 |
| XBB.1.9 | None | 8 | HK.29, JN.1.1, XBB.1.16.9 |
| 2023 Oct 23 | EG.5.1 | None |
| XBB.1.16 | None | 2 | XCH.1, DV.7.1 |
| 2023 Nov 6 | EG.5.1 | EG.5.1.1, EG.5.1.6 |
| XBB.1.16 | None | 6 | FL.1.5.1, HK.13.2.1, HK.26 |
| 2023 No 20 | EG.5.1 | EG.5.1.1, EG.5.1.6, HV.1 |
| XBB.1.16 | XBB.1.16.6 | 10 | HK.26, GK.1.1, JN.1.4.5, HK.3, JN.1 |
| 2023 Dec 4 | EG.5.1 | HV.1, HV.1.2, HV.1.6 |
| BA.2.86 | JN.1, JN.1.1, JN.1.38 | 14 | XDA, XCV, GK.1.8 |
| 2023 Dec 18 | BA.2.86 | JN.1, JN.1.1, JN.1.4, JN.1.42 |
| EG.5.1 | EG.5.1, EG.5.1.8, HV.1 | 11 | JG.3, GW.5.1.1, GK.1.6.1 |
| 2024 Jan 1 | BA.2.86 | JN.1, JN.1.39 |
| EG.5.1 | None | 3 | None |
| 2024 Jan 15 | BA.2.86 | JN.1, JN.1.38, JN.1.4, JN.1.42 |
| EG.5.1 | HV.1 | 15 | JG.3, XDD, XDP, JC.5.1, HK.3.2 |
| 2024 Jan 29 | BA.2.86 | JN.1, JN.1.1 |
| EG.5.1 | None | 9 | None |
| 2024 Feb 12 | BA.2.86 | JN.1, JN.1.42 | XBB.2.3 | None | 4 | None | |
| GenBank accession no. | Scanned test date | Pango lineage |
|---|---|---|
| 2023 Oct 14 | JN.1.1 | |
| 2023 Dec 4 | XDA | |
| 2023 Dec 21 | JN.1.2 | |
| 2023 Dec 22 | XDE | |
| 2024 Jan 17 | XDD | |
| 2024 Jan 24 | XDP |
Peer Reviews
No public reviews on file for this paper yet. If you reviewed it on a platform where reviews are public (OpenReview, ICLR, NeurIPS, ICML), you can paste yours below so the community can read it here.
Videos
No videos yet. Explain this paper in a talk, walkthrough, or lecture? Add one.
Taxonomy
TopicsSARS-CoV-2 detection and testing · SARS-CoV-2 and COVID-19 Research · Biosensors and Analytical Detection
Genomic surveillance is a powerful tool that can inform public health responses to disease outbreaks (1). During the COVID-19 pandemic, genomic surveillance data were used to identify variants of concern, investigate patterns of transmission, and develop effective vaccines (2–4).
Genomic surveillance requires large, representative sets of samples. Initially, nucleic acid amplification tests (NAATs) were the standard for detecting SARS-CoV-2 infection (5). Laboratories received residual nasal swab samples leftover from NAAT testing for viral sequencing through contracts with companies and clinics performing NAATs. After the COVID-19 public health emergency ended on May 11, 2023, NAAT testing in clinical and public health facilities declined precipitously as government subsidies for performing NAATs ended (6). During 2020, an average of 587,975 NAATs were performed weekly in the United States. By 2023, that number decreased to ≈96,215 tests per week (7). Subsequently, the primary source of samples for genomic surveillance was greatly diminished.
The US Food and Drug Administration issued the first emergency use authorization for a COVID-19 rapid antigen test (RAT) in August of 2020 (8). At-home RAT usage increased significantly in 2021 during the rise of the Omicron lineage (9). RATs are less expensive than NAATs, provide faster results, and do not require trained personnel (10). RATs usually involve swabbing the insides of both nostrils, placing the swab into an inactivation buffer, and applying the buffer onto a lateral flow test strip. If SARS-CoV-2 antigen is present, a colorimetric test line will indicate positivity (11). By July 2024, the United States had 38 available over-the-counter SARS-CoV-2 RAT products authorized by the Food and Drug Administration and available to the public (12).
Multiple groups have investigated RATs as source material for SARS-CoV-2 genomic surveillance. SARS-CoV-2 RNA can be recovered from antigen tests and sequenced (13–17), enabling tracking of circulating lineages. We hypothesized that community members would be willing to send in SARS-CoV-2–positive RATs for genomic surveillance if the process were sufficiently simple. Thus, we partnered with local public libraries and a public health agency to create and assess a system for persons to anonymously submit positive RATs for viral RNA analysis and sequencing.
Materials and Methods
Collection of Rapid Antigen Tests
In Wisconsin, the South Central Library System and Public Health Madison Dane County (PHMDC) distributed RATs from the US national stockpile to the public free of charge. We partnered with 9 libraries and 2 sites through PHMDC. Six of the libraries were located in urban areas and 3 in rural areas (18) (Figure 1).
Locations for SARS-CoV-2 genomic surveillance from community-distributed rapid antigen tests, Wisconsin, USA. Nine of the South Central Library System libraries and 2 PHMDC sites distributed research packets and SARS-CoV-2 rapid antigen tests to patrons. Willing participants could send their positive tests to the AIDS Vaccine Research Laboratory, University of Wisconsin–Madison (Madison, WI, USA), for sequencing. PHMDC, Public Health Madison Dane County.
We designed a packet of materials to attach to each RAT to enable collection of positive tests (Figure 2). The packet included an instructional flyer affixed to the outside of a bubble mailer to which a business reply mail shipping label was affixed. Inside the bubble mailer, we included a zip-top bag with a unique quick response (QR) barcode for return of RAT tests. The flyer had instructions in both English and Spanish, describing the study and providing instructions on how to participate (Appendix Figure).
Research packets distributed for SARS-CoV-2 genomic surveillance from community-distributed rapid antigen tests, Wisconsin, USA. A) Envelope and instructions; B) zip-top bag included in packet with quick response (QR) code; C) return address label. Research packets were attached to SARS-CoV-2 rapid antigen test boxes, enabling participants to send their positive tests to the laboratory through the US Postal Service. A folded flyer (A), attached to an envelope, explained in both English and Spanish the goal of the study and how to participate. Participants scanned the QR code inside the included zip-top bag (B) to document the date and location of their rapid antigen test, then sealed their test strip inside. The location of the scanned QR code was immediately converted to the census block group of the scan and stored in a secure database. Participants returned test strips in the provided envelope, which had a business-reply shipping label (C), enabling participants to mail to our laboratory from any post office drop box.
Participants could volunteer to submit their RAT to our program if they tested SARS-CoV-2 positive. Participants were directed to scan the unique QR code on an internet-connected device, seal the positive RAT strip inside the zip-top bag, place the bag inside the bubble mailer and seal it, then drop the sealed mailer in any post office mailbox. The inactivation buffer in a RAT inactivates SARS-CoV-2, rendering the tests nonbiohazardous and safe to send through the mail (19).
Upon arrival at our laboratory, we scanned the QR code to record the date of receipt and stored at −80°C until processing. Most RATs we received were BinaxNOW COVID-19 Antigen Self Tests (Abbott, https://www.abbott.com) or iHealth COVID-19 Antigen Rapid Tests (iHealth Labs Inc., https://ihealthlabs.com).
Ethics Statement
The University of Wisconsin institutional review board determined this project was human research exempt because participants were anonymous and self-identified. We created a secure website and database by using Node JS (https://nodejs.org) to collect the barcode, the date, and the location when a user scanned a randomly generated unique QR code. We assumed those data were a reasonable proxy for RAT date and location. The location of the scan was automatically converted to a census block group on the users’ machines before submission to our database, so the actual location of each submission was not known to the study team. A census block group contains 250–550 housing units (20).
Nucleic Acid Extraction
We developed our approach to extract nucleic acids from used RATs per previously describe methods (13). We thawed and opened RATs to retrieve the testing strip, which we placed into a clean 5-mL freezer tube (Sarstedt, https://www.sarstedt.com). Some RATs also included a nasal swab, and we also placed those in the freezer tube.
We added 800 μL of Viral Transport Medium (Rocky Mountain Biologicals, LLC, https://rmbio.com), and incubated the tube at room temperature for 10 minutes on a Hulamixer (Thermo Fisher Scientific, https://www.thermofisher.com). We transferred 500 μL of that mixture to a clean 1.5-mL tube and added 5 μL of Dynabeads Wastewater Virus Enrichment Beads (Thermo Fisher Scientific). We incubated samples for 10 minutes on a Hulamixer, then placed on a magnetic rack for 3 minutes. Once clear, we discarded the supernatant and resuspended the beads in 500 µL of lysis buffer. We returned the tube to the magnet for 3 minutes and then transferred the clear supernatant to a clean tube. We isolated samples on a Kingfisher Apex instrument (Thermo Fisher Scientific) following the manufacturer’s protocol (protocol no. MagMAX_Wastewater_DUO96.bdz).
After isolation, we treated the samples with Turbo DNase (Thermo Fisher Scientific), according to the manufacturer’s protocol. After DNase treatment, we cleaned samples by using the RNA Clean and Concentrator-5 kit (Zymo Research, https://www.zymoresearch.com), following the manufacturer’s protocol, but skipping the in-column DNase I Treatment.
Quantitative Reverse Transcription PCR and Sequencing
We selected a random subset of 75 samples to investigate trends between the quantitative reverse transcription PCR cycle threshold (Ct) and sequencing quality. We quantified SARS-CoV-2 RNA using the CDC N1 Taqman assay (21) (Appendix).
We generated PCR amplicons by using the QIAseq DIRECT SARS-CoV-2 Kit with Booster and Enhancer (QIAGEN, https://www.qiagen.com), according to the manufacturer’s instructions. We normalized indexed samples to 4 nmol and pooled samples together. We diluted the pool to a concentration of 8 pmol and ran using 2 × 150 MiSeq Reagent Kits v2 on a MiSeq instrument (both Illumina, https://www.illumina.com).
Sequencing Analysis
We quality-checked raw sequencing reads and aligned to the wild-type SARS-CoV-2 reference (GenBank accession no. MN908947.3), then variant-called by using the open-source viralrecon pipeline from the nf-core project (22,23; B.E. Langer et al., unpub. data, https://doi.org/10.1101/2024.05.10.592912). We set the minimum frequency threshold for variant-calling to 0.01. Further details for how we ran viralrecon, alongside the custom R scripts we used to generate figures, are available in our GitHub repository (https://github.com/dholab/Library-Rapid-Antigen-Test-Manuscript).
Statistical Analysis
We used an unpaired 2-tailed t-test to compare the effect of Ct and length of transit time between samples that passed our sequencing quality threshold of >90% coverage at >10× depth and those that failed. We performed that analysis in Prism version 10.1.0 (GraphPad, https://www.graphpad.com).
We compared the identities of SARS-CoV-2 lineages detected in our RAT-derived sequences with surveillance data from the Wisconsin State Laboratory of Hygiene (WSLH) SARS-CoV-2 Genomic Dashboard (24). We analyzed data from August 28, 2023–February 25, 2024, dividing our passing sequences into 2-week intervals on the basis of test scan dates. We only included participant-scanned tests in that analysis. We assigned Pango lineages to our sequences by using Nextclade version 3.5.0 (25). For each 2-week period, we identified the 2 most prevalent lineage groups, which we based on Nextstrain clades, in the WSLH wastewater surveillance data and determined how often our RAT program also detected the same prevalent lineages.
Results
Test Collection
During August 15, 2023–February 29, 2024, we supplied 9 libraries and 2 public health clinics in Dane County with 7,775 research packets to attach to SARS-CoV-2 RATs distributed to patrons. Among distributed packets, 223 (2.9%) were mailed to our laboratory. Some packets contained multiple tests, resulting in 227 total tests for analysis. The return rates varied by month (Table 1), but the mean number received each month was 32 (SD 10).
Some tests arrived at the laboratory without the barcode or with a barcode that had never been scanned, resulting in loss of associated metadata. Of the 223 research packets received, 170 were properly associated with time and location metadata. Of those 170 samples, 1 was scanned in Sauk County, Wisconsin (adjacent to Dane County), and the rest were scanned in Dane County.
Sequencing Quality
We sequenced SARS-CoV-2 from all 227 RATs. We considered a sequence with genome coverage >90% at a depth of coverage >10× to be a passing sequence. Of the 227 RAT-derived sequences, 128 (56%) passed (Appendix Table 1).
Next, we evaluated whether SARS-CoV-2 viral RNA concentration or transit time correlated with successful sequencing. We randomly selected 75 samples for semiquantitative reverse transcription PCR. Of those samples, 15 had no detectable amplification of the N1 target. We obtained passing sequences for samples with Ct values up to 35.4. The mean Ct for samples that passed was 31.7 and the mean Ct for samples that failed was 35.3, a significant difference via unpaired, 2-tailed t-test (p<0.0001; degrees of freedom = 59) (Figure 3, panel A).
Comparison of passing and failing samples in a study of SARS-CoV-2 genomic surveillance from community-distributed rapid antigen tests, Wisconsin, USA. Scatterplots compare percentage coverage for Ct values (A) and transit times (B) for passing and failing RATs. Ct values were obtained through quantitative reverse transcription PCR. Sequences that passed the quality threshold had >90% coverage of the SARS-CoV-2 genome at >10× depth. The mean Ct for samples that passed was 31.7 and the mean Ct for those that failed was 35.3 (p<0.0001 by unpaired 2-tailed t-test; degrees of freedom = 59). Samples with lower Ct values correlated with higher SARS-CoV-2 coverage. Transit time refers to the number of days between a participant scanning the QR code provided with the RAT and receipt of positive RAT at our laboratory. The horizontal black line (B) is the mean value for each group. The mean transit time for passing samples was 6.3 (SD 3.6) days and the mean transit time for failing samples was 6.6 (SD 4.2) days. We noted no significant difference in transit times between passing and failing sequences (p = 0.69 by unpaired t-test). The amount of viral material present on RAT correlated with our ability to sequence samples, but time en route did not. Ct, cycle threshold; RAT, rapid antigen test.
The time between a test being scanned by the participant and our receiving it (i.e., the transit time) ranged from 1 to 20 days, but transit time had little effect on sequencing success (Figure 3, panel B). The mean transit time for the passing samples was 6.3 days, compared with 6.6 days for failed samples (p = 0.69 by unpaired 2-tailed t-test).
Tracking SARS-CoV-2 Lineages
We used Nextclade version 3.5.0 (25) to determine the Pango lineage of each successfully sequenced sample and tracked SARS-CoV-2 lineages detected by week on the basis of participant scan date (Figure 4). During August–November 2023, most detected lineages were assigned to the XBB clade. Beginning in December 2023, we observed a shift to the JN.1 lineage, which predominated in February 2024.
Number of samples collected per week and viral lineages detected in a study of SARS-CoV-2 genomic surveillance from community-distributed rapid antigen tests (RATs), Wisconsin, USA. The chart shows the percentage of SARS-CoV-2 lineages by week for samples that passed quality control thresholds of >90% of the SARS-CoV-2 genome at >10× depth. The date used reflected the date the participant scanned a provided QR code attached to a RAT. Unscanned RATs were excluded from the analysis. The number of samples included in each week’s percentage is shown above the bar. We assigned Pango lineages by using Nextclade version 3.5.0 (25). From August to mid-November 2023, the most common lineages in our samples fell under XBB.1.5, XBB.1.9.2, XBB.1.16, and XBB.2.3. Beginning in early December 2023, we began to see an increase in the number of samples belonging to the lineage JN.1, which dominated RAT samples scanned in February 2024.
The identities of viral lineages in our RAT-derived sequences were concordant with statewide trends in lineages detected via wastewater surveillance, as summarized on the WSLH SARS-CoV-2 Wastewater Genomic Dashboard (24) (Table 2). Our program detected the dominant wastewater lineage in 12 of 13 two-week reporting periods and the second-most prevalent lineage in 7 of 13 periods. Concordance with wastewater surveillance data indicates that RAT-based surveillance can detect common circulating lineages. Moreover, RAT-based surveillance resulted in 6 of the earliest documented cases of a lineage in Wisconsin in GenBank and GISAID: JN.1.1, JN.1.2, XDD, XDA, XDP, and XDE (Table 3).
Discussion
Genomic surveillance has been crucial for tracking SARS-CoV-2 evolution during the COVID-19 pandemic (26). Because most persons now use RATs instead of NAATs to diagnose SARS-CoV-2 infection, we sought to evaluate a community genomic surveillance program predicated on voluntary mailing of positive RATs.
Despite the common narrative that the public is disinterested in COVID-19, we observed surprisingly strong participation. During August 12, 2023–February 24, 2024, Dane County’s average COVID-19 test positivity rate, which we used to estimate the return rate on RATs, was 12.3% (range 7.8%–16%) (27). In an extreme case in which all the RATs distributed by our partners were used, we estimated that one quarter of all positive tests distributed with packets were returned to our laboratory for analysis. The true return rate is likely higher because some tests distributed with packets likely were not used.
The transit time during which RATs sat in uncontrolled (ambient) conditions had a negligible effect on overall sequencing success (Figure 3, panel B). Other studies have demonstrated that extraction of viral RNA is possible from RATs stored at room temperature for long periods (14,16); one study generated 75.2% genome coverage from a RAT stored at room temperature for 3 months. We obtained a sequence with >10× coverage for >90% of the SARS-CoV-2 genome from a RAT that sat at uncontrolled temperatures for at least 17 days. Taken together, those results highlight that RATs stored at uncontrolled temperatures can be mailed from the point-of-testing to centralized laboratories for sequencing. Most (98%) of the US population is served by the United States Postal Service (28). Thus, the ability to self-collect samples for mail-in analysis could enable genomic surveillance even in settings that are typically underserved by academic and clinical research.
SARS-CoV-2 lineages identified by our RAT surveillance program were similarly prevalent in Wisconsin’s statewide wastewater sequencing data (24). Of note, we also detected emerging lineages like JN.1 and rare variants like XDE, which was documented only 22 times in North America (29). Those findings demonstrate that RAT-based sequencing can effectively complement existing wastewater and NAAT surveillance methods.
One limitation of our study is the reliance on self-reported data, which is less precise than clinical specimen metadata. Our metadata depended on the participant’s QR code scan to approximate the date and location of the test, which might have reduced data accuracy. Another limitation is that ≈25% of packets arrived unscanned or without a barcode; thus, we had no metadata for those samples. Our only communication with participants was through the flyer provided with each packet, and some participants might only skim the instructions and misinterpret the protocol. To reduce the frequency of unscanned tests, more simplified instructions that include visual cues could more clearly communicate the directions for returning RATs.
Census block groups of scanned tests showed a strong bias toward urban locations (18); only 1 test was scanned by a participant in a rural census block group. The 3 packet distribution sites in rural areas of Dane County received only 3% of the total packets we supplied, which might partially account for that low number of tests from rural areas. Rural and underrepresented areas might need stronger engagement efforts in future studies to achieve more representative genomic surveillance.
Our program relied on freely available RATs provided from the national government stockpile. The long-term sustainability of the programs that distribute those tests is unknown, which means this system for collecting and sequencing RATs might not be sustainable long-term. A similar program could be established with RATs purchased by community members (e.g., by partnering with pharmacies to put them at point-of-sale), but that could greatly bias the results toward persons who have the resources and motivation to purchase costly tests. Providing free tests to members of the community gives them a valuable tool to minimize their risk for COVID-19 transmission while also potentially providing more inclusive, representative genomic surveillance.
In conclusion, the program described here could act as a framework for the creation of more expansive genomic surveillance programs. Regulators in some countries have approved at-home RATs for other respiratory viruses, including influenza A virus and respiratory syncytial virus (30–32), and those tests could be collected to set up surveillance programs for other viruses. Other studies have demonstrated the possibility of recovering various respiratory viruses from COVID-19 RATs (15,33). Thus, by collecting both positive and negative RATs from symptomatic persons, the prevalence of respiratory viruses circulating in communities could also be estimated, creating an innovative additional method for assessing the spread of respiratory viruses in communities.
This article was preprinted at https://www.medrxiv.org/content/10.1101/2024.08.12.24311680v1.
AppendixAdditional information on SARS-CoV-2 genomic surveillance from community-distributed rapid antigen tests, Wisconsin, USA.
The reference list from the paper itself. Each links out to its DOI / PubMed record.
- 1Ladner JT, Sahl JW. Towards a post-pandemic future for global pathogen genome sequencing. P Lo S Biol. 2023;21:e 3002225. 10.1371/journal.pbio.300222537527248 PMC 10393143 · doi ↗ · pubmed ↗
- 2Rasmussen M, Møller FT, Gunalan V, Baig S, Bennedbæk M, Christiansen LE, et al. First cases of SARS-Co V-2 BA.2.86 in Denmark, 2023. Euro Surveill. 2023;28:36. 10.2807/1560-7917.ES.2023.28.36.230046037676147 PMC 10486197 · doi ↗ · pubmed ↗
- 3Oliveira Roster KI, Kissler SM, Omoregie E, Wang JC, Amin H, Di Lonardo S, et al. Surveillance strategies for the detection of new pathogen variants across epidemiological contexts. PLOS Comput Biol. 2024;20:e 1012416. 10.1371/journal.pcbi.101241639236073 PMC 11407617 · doi ↗ · pubmed ↗
- 4Robishaw JD, Alter SM, Solano JJ, Shih RD, De Mets DL, Maki DG, et al. Genomic surveillance to combat COVID-19: challenges and opportunities. Lancet Microbe. 2021;2:e 481–4. 10.1016/S 2666-5247(21)00121-X 34337584 PMC 8315763 · doi ↗ · pubmed ↗
- 5World Health Organization. Recommendations for national SARS-Co V-2 testing strategies and diagnostic capacities [cited 2024 Apr 29]. https://www.who.int/publications/i/item/WHO-2019-n Co V-lab-testing-2021.1-eng
- 6Kates J, Cubanski J, Cox C, Published JT. Timeline of end dates for key health-related flexibilities provided through COVID-19 emergency declarations, legislation, and administrative actions [cited 2024 Nov 20]. https://www.kff.org/coronavirus-covid-19/issue-brief/timeline-of-end-dates-for-key-health-related-flexibilities-provided-through-covid-19-emergency-declarations-legislation-and-administrative-actions
- 7Centers for Disease Control and Prevention. COVID data tracker [cited 2024 May 9]. https://covid.cdc.gov/covid-data-tracker
- 8Centers for Disease Control and Prevention. COVID Museum COVID-19 timeline [cited 2025 Mar 6]. https://www.cdc.gov/museum/timeline/covid 19.html