An Improved Chemical Extraction Procedure for the Sr Isotope Analysis of Liquid Agrifood Samples Applied to Authenticating the Origin of Maple Syrups in Quebec (Canada)
B. Saar de Almeida, R. Stevenson, M. Sadiki, L. Lagacé, D. Widory

TL;DR
A new method for analyzing strontium isotopes in maple syrup helps determine its geographic origin using soil and tree data from Quebec.
Contribution
An improved simplified sample preparation technique using dual chromatography for Sr isotope analysis in liquid agri-food samples.
Findings
No isotope fractionation occurs between maple syrup, trees, and soil in Quebec.
A bioavailable 87Sr/86Sr map was created for southern Quebec using agri-food data.
Abstract
We describe a new simplified sample preparation technique, based on dual chromatography for the analysis of 87Sr/86Sr in liquid agri‐food samples. We applied this approach for authenticating the origin of maple syrup products in Quebec, characterizing the 87Sr/86Sr of soil profiles from geologically distinct maple groves, including maple tree components and maple syrup products. In our simplified technique, 3 mL of the organic liquids was poured into a 15‐mL centrifuge tube, diluted with 10 mL of Mill‐Q H2O, and manually shaken to produce a thin juice. The thin juice was subsequently loaded in two 7.5 mL aliquots onto 10‐mL Bio‐RadTM chromatography columns containing 4 mL of cleaned AG50‐X8 resin (100–200 mesh in a 1‐N HCl solution). Once the sample was absorbed by the resin, the organic fraction of the thin juice was eluted by adding 3 × 5 mL of 1‐N HCl. The Sr and other cations were…
Genes, proteins, chemicals, diseases, species, mutations and cell lines named across the full text — each resolved to its canonical identifier and authoritative record.
Click any figure to enlarge with its caption.
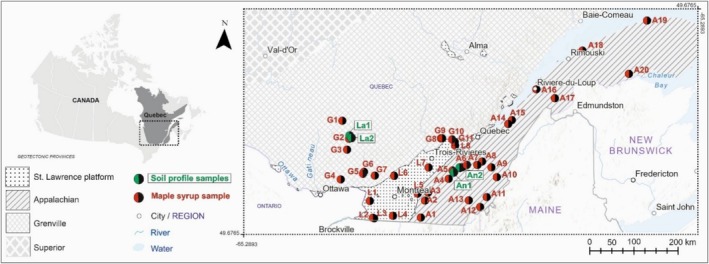 FIGURE 1
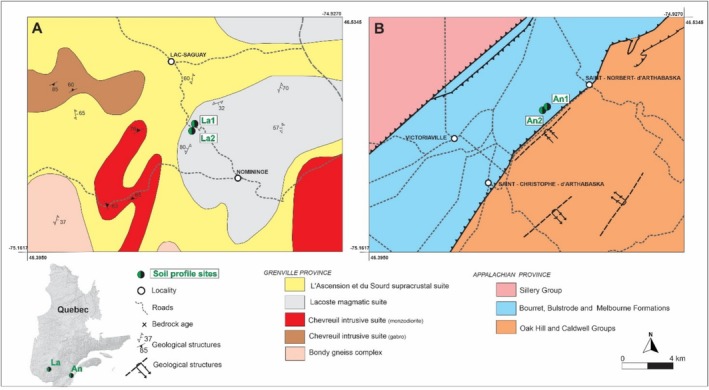 FIGURE 2
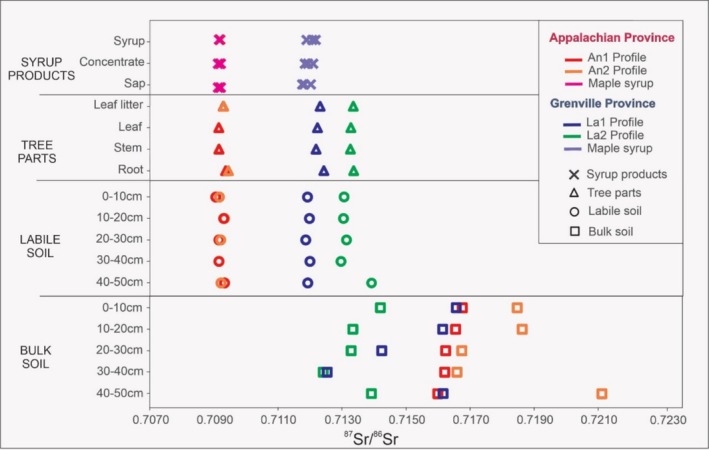 FIGURE 3
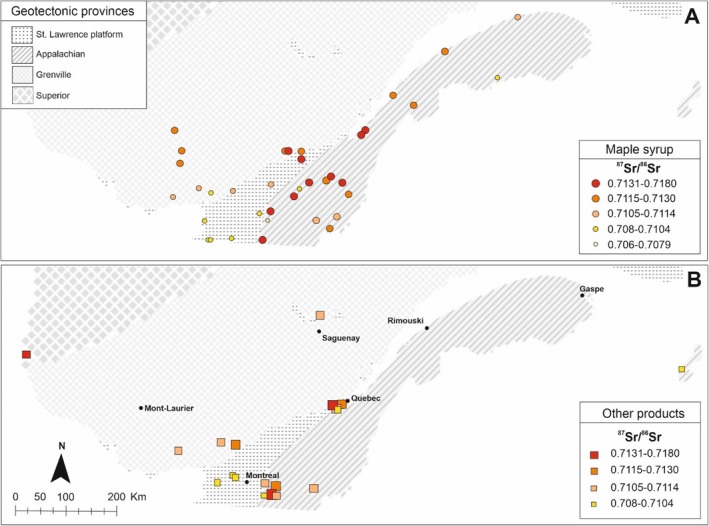 FIGURE 4
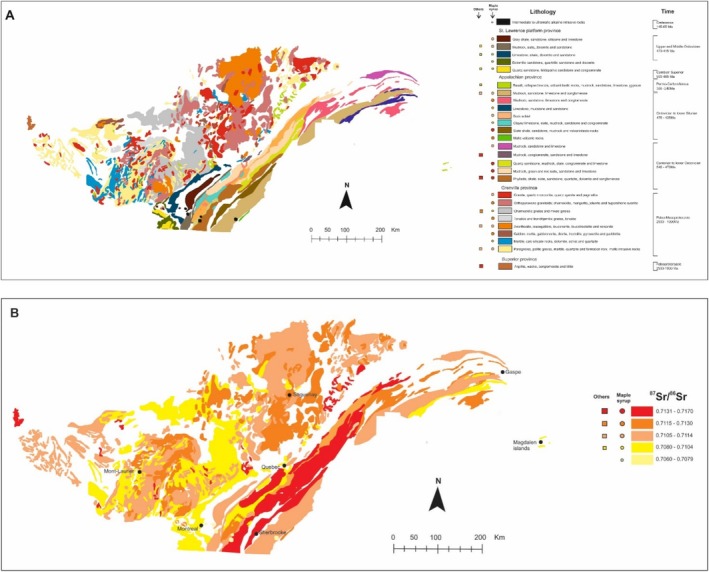 FIGURE 5
| MC‐ICP‐MS | |
|---|---|
| Reflected power | 1300 W |
| Coolant gas (argon) flow rate | 13.5 L min−1 |
| Auxiliary gas (argon) flow rate | 0.85 L min−1 |
| Nebulizer gas (argon) pressure | 30.7 psi for Sr |
| Detection system | 6 Faraday collectors (low resolution) |
| Sample cone orifice | 0.9 mm (nickel) |
| Skimmer cones orifice | 0.6 mm (nickel) |
| Sample uptake rate | 100 μL min−1 |
| Transmission | 650 V ppm−1 for Sr |
| NIST SRM‐987 | ||||
|---|---|---|---|---|
| MC‐ICP‐MS | 2SD | TIMS | 2SD | |
| 0.71026 | 0.00001 | 0.71026 | 0.00001 | |
| 0.71023 | 0.00001 | 0.71027 | 0.00001 | |
| 0.71024 | 0.00001 | 0.71025 | 0.00001 | |
| 0.71022 | 0.00001 | 0.71025 | 0.00001 | |
| 0.71023 | 0.00001 | 0.71024 | 0.00000 | |
| 0.71024 | 0.00001 | 0.71024 | 0.00000 | |
| 0.71023 | 0.00001 | 0.71026 | 0.00000 | |
|
|
|
|
|
|
| Sample | Type | Place | Sample preparation | MC‐ICP‐MS | TIMS | |||
|---|---|---|---|---|---|---|---|---|
| 87Sr/86Sr | 2SD | 87Sr/86Sr | 2SD | Difference | ||||
| LA1 | Sap | Laurentides | Cation exchange chromatography using a AG50X‐8 resin | 0.7122 | 0.00003 | 0.7122 | 0.00002 | 0.00001 |
| LA1 | Sap | Laurentides | 48 h at 80°C using HNO3 + H2O2 | 0.7121 | 0.00002 | 0.7122 | 0.00002 | 0.00000 |
| LA2 | Maple syrup | Laurentides | Cation exchange chromatography using a AG50X‐8 resin | 0.7120 | 0.00002 | 0.7120 | 0.00002 | 0.00000 |
| SNA1 | Maple syrup | Saint Norbert d'Arthabaska | Cation exchange chromatography using a AG50X‐8 resin | 0.7092 | 0.00002 | 0.7091 | 0.00002 | 0.00000 |
| SNA1 | Maple syrup | Saint Norbert d'Arthabaska | 48 h at 80°C using HNO3 + H2O2 | 0.7092 | 0.00002 | 0.7091 | 0.00002 | 0.00000 |
| 175 | Maple syrup | Les Maskoutains | Cation exchange chromatography using a AG50X‐8 resin | 0.7098 | 0.00002 | 0.7098 | 0.00002 | −0.00001 |
| 175 | Maple syrup | Les Maskoutains | 48 h at 80°C using HNO3 + H2O2 | 0.7098 | 0.00003 | 0.7098 | 0.00005 | −0.00002 |
| 129 | Maple syrup | Rivière‐du‐Loup | Cation exchange chromatography using a AG50X‐8 resin | 0.7107 | 0.00001 | 0.7107 | 0.00001 | 0.00000 |
| 155 | Maple syrup | Vaudreuil‐Soulanges | Cation exchange chromatography using a AG50X‐8 resin | 0.7094 | 0.00001 | 0.7094 | 0.00002 | 0.00000 |
| Profile | Sample | 87Sr/86Sr | 2SD |
|---|---|---|---|
| La1 | Leaf litter | 0.7123 | 0.00001 |
| Leaves | 0.7122 | 0.00002 | |
| Stem | 0.7122 | 0.00002 | |
| Coarse roots | 0.7124 | 0.00003 | |
| Labile soil 0–10 cm | 0.7119 | 0.00002 | |
| Labile soil 10–20 cm | 0.7120 | 0.00005 | |
| Labile soil 20–30 cm | 0.7119 | 0.00002 | |
| Labile soil 30–40 cm | 0.7120 | 0.00005 | |
| Labile soil 40–50 cm | 0.7119 | 0.00003 | |
| Bulk soil 0–10 cm | 0.7166 | 0.00001 | |
| Bulk soil 10–20 cm | 0.7161 | 0.00002 | |
| Bulk soil 20–30 cm | 0.7142 | 0.00001 | |
| Bulk soil 30–40 cm | 0.7125 | 0.00001 | |
| Bulk soil 40–50 cm | 0.7162 | 0.00001 | |
| La2 | Leaf litter | 0.7134 | 0.00001 |
| Leaves | 0.7133 | 0.00001 | |
| Stem | 0.7133 | 0.00002 | |
| Coarse roots | 0.7134 | 0.00002 | |
| Labile soil 0–10 cm | 0.7131 | 0.00002 | |
| Labile soil 10–20 cm | 0.7130 | 0.00003 | |
| Labile soil 20–30 cm | 0.7131 | 0.00003 | |
| Labile soil 30–40 cm | 0.7130 | 0.00003 | |
| Labile soil 40–50 cm | 0.7139 | 0.00003 | |
| Bulk Soil 0–10 cm | 0.7142 | 0.00001 | |
| Bulk soil 10–20 cm | 0.7133 | 0.00002 | |
| Bulk soil 20–30 cm | 0.7133 | 0.00001 | |
| Bulk soil 30–40 cm | 0.7124 | 0.00001 | |
| Bulk soil 40–50 cm | 0.7139 | 0.00001 | |
| An1 | Leaf litter | 0.7093 | 0.00001 |
| Leaves | 0.7092 | 0.00001 | |
| Stem | 0.7092 | 0.00002 | |
| Coarse roots | 0.7094 | 0.00002 | |
| Labile soil 0–10 cm | 0.7091 | 0.00003 | |
| Labile soil 10–20 cm | 0.7093 | 0.00002 | |
| Labile soil 20–30 cm | 0.7092 | 0.00002 | |
| Labile soil 30–40 cm | 0.7091 | 0.00004 | |
| Labile soil 40–50 cm | 0.7093 | 0.00004 | |
| Bulk soil 0–10 cm | 0.7168 | 0.00001 | |
| Bulk soil 10–20 cm | 0.7165 | 0.00001 | |
| Bulk soil 20–30 cm | 0.7162 | 0.00002 | |
| Bulk soil 30–40 cm | 0.7162 | 0.00004 | |
| Bulk soil 40–50 cm | 0.7160 | 0.00002 | |
| An2 | Leaf litter | 0.7093 | 0.00002 |
| Leaves | 0.7092 | 0.00002 | |
| Stem | 0.7092 | 0.00001 | |
| Coarse roots | 0.7095 | 0.00001 | |
| Labile soil 0–10 cm | 0.7092 | 0.00002 | |
| Labile soil 10–20 cm | 0.7093 | 0.00002 | |
| Labile soil 20–30 cm | 0.7092 | 0.00002 | |
| Labile soil 30–40 cm | 0.7092 | 0.00003 | |
| Labile soil 40–50 cm | 0.7092 | 0.00003 | |
| Bulk soil 0–10 cm | 0.7185 | 0.00002 | |
| Bulk soil 10–20 cm | 0.7186 | 0.00002 | |
| Bulk soil 20–30 cm | 0.7167 | 0.00001 | |
| Bulk soil 30–40 cm | 0.7166 | 0.00001 | |
| Bulk soil 40–50 cm | 0.7211 | 0.00001 |
| La1 and La2 | An1 and An2 | ||||
|---|---|---|---|---|---|
| Collected season | Type | 87Sr/86Sr | 2SD | 87Sr/86Sr | 2SD |
| Early | Sap | 0.7121 | 0.00002 | 0.7092 | 0.00002 |
| Concentrate | 0.7121 | 0.00001 | 0.7091 | 0.00001 | |
| Syrup | 0.7119 | 0.00001 | 0.7092 | 0.00001 | |
| 1/4 | Sap | 0.7122 | 0.00003 | 0.7091 | 0.00002 |
| Concentrate | 0.712 | 0.00004 | 0.7091 | 0.00001 | |
| Syrup | 0.712 | 0.00002 | 0.7092 | 0.00002 | |
| Mid | Sap | 0.7118 | 0.00003 | 0.7092 | 0.00001 |
| Concentrate | 0.7118 | 0.00002 | 0.7091 | 0.00001 | |
| Syrup | 0.7119 | 0.00002 | 0.7091 | 0.00001 | |
| 3/4 | Sap | 0.712 | 0.00001 | 0.7091 | 0.00001 |
| Concentrate | 0.7118 | 0.00002 | 0.7092 | 0.00002 | |
| Syrup | 0.7121 | 0.00001 | 0.7092 | 0.00002 | |
| Late | Sap | 0.7121 | 0.00001 | 0.7092 | 0.00002 |
| Concentrate | 0.7119 | 0.00002 | 0.7092 | 0.00001 | |
| Syrup | 0.7117 | 0.00002 | 0.7092 | 0.00001 | |
| Province | Sample | Place | Region | 87Sr/86Sr | 2SD |
|---|---|---|---|---|---|
| St. Lawrence platform | L01 | Vaudreuil‐Soulanges | Montérégie | 0.7094 | 0.00001 |
| L02 | Haut St‐Laurent | Montérégie | 0.7102 | 0.00002 | |
| L03 | Hinchinbrooke | Hinchinbrooke | 0.7102 | 0.00002 | |
| L04 | Les Jardins‐de‐Napierville | Montérégie | 0.7099 | 0.00001 | |
| L05 | Les Maskoutains | Montérégie | 0.7098 | 0.00003 | |
| L06 | St‐Alexis‐De‐Montcalm | St‐Alexis‐De‐Montcalm | 0.7092 | 0.00001 | |
| L07 | Nicolet‐Yamaska | Centre‐du‐Québec | 0.7110 | 0.00001 | |
| L08 | Lotbinière | Chaudière‐Appalaches | 0.7161 | 0.00002 | |
| Appalachian | A01 | Brome‐Missisquoi | Estrie | 0.7168 | 0.00001 |
| A02 | Roxton‐Pond | Roxton‐Pond | 0.7069 | 0.00002 | |
| A03 | Acton | Montérégie | 0.7152 | 0.00001 | |
| A04 | d'Arthabaska | Centre‐du‐Québec | 0.7177 | 0.00002 | |
| A05 | Saint Norbert d'Arthabaska | Centre‐du‐Québec | 0.7091 | 0.00002 | |
| A06 | de L'Érable | Centre‐du‐Québec | 0.7168 | 0.00002 | |
| A07 | St‐Pierre‐De‐Broughton | St‐Pierre‐De‐Broughton | 0.7143 | 0.00002 | |
| A08 | St‐Severin‐De‐Beauce | St‐Severin‐De‐Beauce | 0.7159 | 0.00001 | |
| A09 | Robert‐Cliche | Chaudière‐Appalaches | 0.7170 | 0.00002 | |
| A10 | Beauce‐Sartigan | Chaudière‐Appalaches | 0.7119 | 0.00002 | |
| A11 | du Granit | Estrie | 0.7121 | 0.00001 | |
| A12 | Notre‐Dame‐Des‐Bois | Notre‐Dame‐Des‐Bois | 0.7127 | 0.00002 | |
| A13 | Haut‐Saint‐François | Estrie | 0.7111 | 0.00001 | |
| A14 | L'Islet | Chaudière‐Appalaches | 0.7174 | 0.00001 | |
| A15 | St‐Auber | St‐Auber | 0.7171 | 0.00001 | |
| A16 | Rivière‐du‐Loup | Bas‐Saint‐Laurent | 0.7107 | 0.00001 | |
| A17 | Témiscouata | Bas‐Saint‐Laurent | 0.7120 | 0.00002 | |
| A18 | La Mitis | Bas‐Saint‐Laurent | 0.7124 | 0.00002 | |
| A19 | Marsoui | Marsoui | 0.7102 | 0.00001 | |
| A20 | d'Avignon | Gaspésie–Îles‐de‐la‐Madeleine | 0.7098 | 0.00001 | |
| Grenville | G01 | Antoine‐Labelle | Laurentides | 0.7121 | 0.00001 |
| G02 | Laurentides | Laurentides | 0.7121 | 0.00002 | |
| G03 | Nominingue | Nominingue | 0.7124 | 0.00002 | |
| G04 | Papineau | l'Outaouais | 0.7105 | 0.00002 | |
| G05 | Montcalm | Lanaudière | 0.7102 | 0.00002 | |
| G06 | Montcalm | Lanaudière | 0.7092 | 0.00001 | |
| G07 | Pays‐d'en‐Haut | Laurentides | 0.7085 | 0.00001 | |
| G08 | L'avenir | L'avenir | 0.7116 | 0.00002 | |
| G09 | St‐Ubalde | St‐Ubalde | 0.7149 | 0.00002 | |
| G10 | Portneuf | Capitale‐Nationale | 0.7102 | 0.00001 | |
| G11 | Portneuf | Capitale‐Nationale | 0.7111 | 0.00002 |
- —MITACS 10.13039/501100004489
Peer Reviews
No public reviews on file for this paper yet. If you reviewed it on a platform where reviews are public (OpenReview, ICLR, NeurIPS, ICML), you can paste yours below so the community can read it here.
Videos
No videos yet. Explain this paper in a talk, walkthrough, or lecture? Add one.
Taxonomy
TopicsIsotope Analysis in Ecology · Archaeology and ancient environmental studies · Fermentation and Sensory Analysis
Introduction
1
Maple syrup is one of Canada's most important non‐timber forest products (NTFPs). The province of Quebec accounts for 91% of the Canadian production (more than 11 million gallons by year) representing the world's largest and most prestigious producer of maple syrup (75% of the world's production). Maple syrup is produced from the sap collected from maple trees ( Acer saccharum ) in the early spring. During the spring thaw, the difference in night‐time (−5°C to −10°C) and daytime (5°C to 10°C) temperatures creates pressure inside the tree that enables the sap to flow through a collection system. The sap is collected and concentrated by boiling (water evaporation) or by reverse osmosis followed by evaporation. The concentrate mostly consists of sucrose, glucose, fructose, and trace levels of oligosaccharides, organic acids, minerals, and amino acids (e.g., [1, 2]). Calcium (Ca), magnesium (Mg), and potassium (K) represent the major metals present in maple sap and syrup [3].
The certification of food products, their authenticity, and origins is a growing priority for consumers and producers. Fingerprinting Canadian maple syrups requires the development and implementation of forensic tools to link them to their corresponding production areas or terroir. Radiogenic isotope systematics including strontium (Sr) isotopes have proven value for authenticating food provenance (e.g., [4, 5, 6]). Sr is an alkaline Earth metal, occurring in nature as Sr^2+^. It can substitute for Ca^2+^ in a variety of rock‐forming minerals such as feldspars, gypsum, plagioclase, apatite, and carbonates [3, 7]. Sr has four naturally occurring stable isotopes whose abundances range from 0.55% to 0.58% for ^84^Sr, from 9.75 to 9.99% for ^86^Sr, from 6.94 to 7.14% for ^87^Sr, and from 82.3 to 82.8% for ^88^Sr [8]. ^84^Sr, ^86^Sr, and ^88^Sr isotopes occur in relatively stable percentages, whereas ^87^Sr gradually increases through ^87^Rb radioactive decay. Thus, ^87^Sr/^86^Sr mainly depends on the nature and age of the host rock: Older rocks and higher Rb contents yield more radiogenic ^87^Sr/^86^Sr ratios due to the prolonged production of ^87^Sr due to ^87^Rb decay.
Radiogenic isotope systematics such as Sr isotopes are increasingly used to authenticate the geographical origin of numerous agri‐food products (wine, milk, ciders, e.g., [9, 10, 11]). The underlying theory is that Sr concentrations and ^87^Sr/^86^Sr isotope ratios in agri‐food products are derived from the soil on which they grew. More precisely, the Sr absorbed by the plants is derived from the labile fraction (water/organic acid soluble portion) of the soil, and the chemical extraction of the labile fraction has been described elsewhere (e.g., [5, 12, 13]). The application of Sr isotopes to provenance studies requires the analysis of a high number of samples, and thus, rapid sample digestion, chemical separation, and analytical procedures are desired. Agri‐food products pose a problem for the rapid digestion of the samples due to the high content of organic material that leaves a black, relatively insoluble residue when attacked by mineral acids such as hydrochloric, nitric, and/or hydrofluoric acids. Removal/digestion of the organic material requires time‐consuming digestion of the sample via heat and/or repeated application of oxidizing reagents (nitric acid and/or peroxide; e.g., [5]).
We propose a simplified sample preparation technique that removes the need for sample heating or digestion/oxidation and that can be applied to most organic‐based liquids prior to Sr purification.
This purification technique was tested using maple syrup from different maple grooves from Quebec, Canada. These analyses are supported by soil profiles from two different maple syrup production areas. The selected samples span 3 different geological domains with well‐defined ages: the Grenville province (from Archean to Mesoproterozoic), the St. Lawrence Platform (upper and middle Ordovician), and the Appalachian Orogen (Cambrian and lower Ordovician).
This paper has three objectives: (i) test a simplified purification technique for high‐sugar agrifood beverages, by analyzing samples of maple syrup using MC‐ICP‐MS and TIMS; (ii) constraining the Sr isotope relationship between the soil, plant, sap, sap concentrate, and ultimately the maple syrup, focusing specifically on determining if the Sr isotope ratios are preserved during absorption from the soil and across the evaporation cycles; (iii) authenticating the origin of maple syrups using Sr isotope systematics coupled with a geological map of Quebec (1:2000.000, [14]).
Houle et al. [15] recently investigated the link between the ^87^Sr/^86^Sr ratios of sugar maple's tree rings and soil samples in 3 different places in Quebec, but, to our knowledge, strontium isotope ratios in maple syrup have never been tested. The maple syrup analyses are compared with previous Sr isotope studies of grapes, wine, milk, and cheese from the same geological provinces within Quebec [5, 11, 12].
Methods
2
State of Art
2.1
The Sr isotope tracing technique was developed by geoscientists to date the age of igneous rocks (geochronology) and trace the origin of geological reservoirs (crust vs. mantle) that gave rise to the rock in question. Sample preparation of rock samples typically involves crushing the rock to obtain a representative powder, followed by acid digestion of the rock to obtain a solution containing the Sr. The Sr is subsequently purified by ion exchange chromatography and then the isotope composition is analyzed via mass spectrometry. Rock dissolution by acid digestion is relatively straightforward involving either HCl or HNO_3_ (carbonates) or a combination of HF and HNO_3_ (silicates).
The digestion of wine, maple syrup, or honey typically involves the addition of a combination of nitric acid (HNO_3_) and peroxide (H_2_O_2_) to digest the organic material. For example, [16] studied the trace element geochemistry of maple syrup from Nova Scotia. Their sample preparation began with oxidizing the maple syrup with 10% HNO_3_ for 24 h, followed by additional attacks of concentrated HNO_3_ and H_2_O_2_ to eventually obtain a clear liquid for ICP‐MS concentration analysis. Similar digestion recipes have been used to obtain organic‐free liquids for Sr isotopes in wine and cider [5, 9, 12, 17, 18, 19]. The method often requires repeated applications of either HNO_3_ and/or peroxide.
Microwave digestion of organic samples such as wine and honey using nitric acid and H_2_O_2_ has been shown to speed up the digestion and oxidation but requires specialized microwave ovens and containers (e.g., [9, 20]). Alternatively, [21] used ultraviolet radiation and peroxide to decompose organic material in diluted wine samples prior to cation exchange chromatography. Durante et al. [22] proposed a simplified chemical protocol for extracting Sr from wine that involved equilibrating wine samples with concentrated nitric acid over a 12‐h period that resulted in a mineralized solution from which the Sr was extracted via cation exchange. The ashing technique is frequently used to reduce solid organic samples to an acid‐soluble ash and has been used to prepare liquid organic substances such as honey for Sr isotopes analyses [23]. The above sample preparation protocols involve combinations of concentrated acids that can lead to larger reagent blanks, with possible vigorous reactions between organic‐rich liquids and acids/peroxide, and often require multiple treatments to oxidize the organic material.
We describe below a simplified sample preparation protocol for organic liquids such as maple syrup, wine, or honey that removes the need for digestion reactions requiring combinations of nitric acid and peroxide. The method is based on the softening/decalcification of thin juice by cation chromatography, a technique that has been employed by sugar and fruit juice manufacturers for over 70 years. Color in sugars (cane or beet sugar) is caused by the presence of natural organic molecules as well as molecules produced during the refining process [24, 25]. The removal of unwanted color in sugar and softening of sugar (removal of K, Ca, and Fe) has been an important process in sugar refining since the early 20th century [26]. Naturally occurring Ca in the sugars also poses a problem in the refining process because evaporation of the sugar slurry during refining leads to large deposits of Ca (scaling) on the equipment [27]. The sugar industry found solutions to this problem by passing water‐diluted sugar juice (thin juice) through a cation exchange resin ([27]) that yielded Ca‐free, softened (hydrogenated) thin juice. This simple process is essentially exactly what is desired in order to isolate Sr for Sr isotope studies of agri‐food beverages.
We outline below a two‐column chromatography procedure that eliminates the need for acid digestion of liquid agrifood products. In this procedure, the sugar or beverage is diluted to form a thin juice, acidified, and loaded into a cation exchange column that traps the cations (Ca, Sr, K) in the juice. The juice and organic material are eluted, leaving behind the desired cations. The cations are subsequently eluted, and the Sr is purified via a second chromatography step.
Sampling Strategy
2.2
Samples from distinct producers were provided by the Centre ACER (Centre for Maple Research, Development and Technology Transfer in Quebec, Canada). The sampling sites were entered into a georeferenced database, using ArcGIS ENRI facilities, including background geology from the geological service of the government of Quebec, Canada [14].
A total of 39 maple syrup samples were selected from different maple syrup production areas spanning three geological provinces of contrasting age, structure, and rock types. These are the Grenville, Appalachian, and St. Lawrence platform geological provinces (Figure 1).
Map showing maple syrup sampling and soil profile locations and the surrounding geological provinces.
The Grenville Province is largely characterized by high‐grade metamorphic orthogneiss and paragneiss complexes with protolith ages ranging from 1.0 to 2.7 Ga. The province is bounded by the Superior and Churchill provinces in the north and sedimentary rocks of the St. Lawrence Platform and the Appalachian Province to the south. Cambrian‐aged rifting associated with the opening of the Iapetus Ocean along the southeastern margin of the Canadian Shield deposited sandstones, shales, and carbonates (570–430 Ma) that characterize the St. Lawrence platform. These Cambrian to Devonian‐aged sedimentary rocks are largely flat lying and overlay the Grenville Province. The Iapetus Ocean was closed by thrusting associated with the Acadian and Taconic orogenies that formed the Appalachian Province of Southern Quebec. These Appalachian orogenies folded, faulted, and metamorphosed the volcanic and sedimentary rocks (600–300 Ma) that formed outboard of the St. Lawrence Platform [28].
A detailed study of four soil profiles was carried out in maple groves within the Grenville (Nominingue) and Appalachian (Saint Norbert d'Arthabaska) geological provinces (Figure 2). The soil profiles from the Laurentide region of the Grenville Province (La1 and La2) are underlain by rocks from the Lacoste Magmatic suite, consisting of metamorphosed plutons that are interleaved with rocks of the Ascension and du Sourd supracrustal suites [29]. The Lacoste Magmatic Suite consists of tonalite, amphibolite, gabbro, enderbite, and monzogranite units [30, 31, 32, 33, 34, 35]. The Lacoste Magmatic Suite was emplaced at 1347 Ma and subsequently metamorphosed at 1059 Ma and ~1000 Ma during the Grenville Orogeny [29, 36].
Simplified geological map of studied soil profiles in Nominingue (A) and Saint Norbert d'Arthabaska (B) areas. Based on the Quebec Geological Survey regional map [14].
Soil profiles sampled close to the city of Saint Norbert d'Arthabaska (An1 and An2) are underlain by Ordovician to Lower Silurian bedrock of the Appalachian province, consisting of clayey limestone, slate, mudrock, sandstone, and conglomerate from the Bourret, Bulstrode, and Melbourne formations.
For each of the soil profile study areas, five different depth horizons were collected (0–10, 10–20, 20–30, 30–40, and 40–50 cm), following the course of the maple tree roots. We included sampling of coarse roots, stem, leaf, and litter leaf from tree superficies. To evaluate any potential variations related to the progression of the rising sap during the Spring season, samples of sap, sap concentrate (8°Brix for SN samples and 18°Brix for LA samples), and syrup were sampled during the following periods: early season, ¼‐season, mid‐season, ¾ season, and late season.
Sample Preparation
2.3
Sample preparation procedures and ^87^Sr/^86^Sr analyses (by TIMS and MC‐ICP‐MS) were carried out at the GEOTOP laboratories (Université du Québec à Montréal, Canada). Samples were prepared in a clean room (ISO 5 standard, 100 particles/ft2), and all digestions used acids prepared with subboiling distilled acids and Mill‐Q H_2_O, 18.2 MΩ cm for dilution. All plastic wares (pipette tips, centrifuge tubes, filters, and resin columns) were pre‐cleaned by soaking the plastics in 1‐N HCl for 24 h followed by soaking in milli Q water for 24 h.
The Sr was extracted from both the bulk soil and the labile fraction of the soil necessitating two different extraction protocols. The labile soil fraction was prepared using 2 g of soil sieved to < 2 mm. The soil was reacted twice with 10 mL of super pure ammonium acetate (NH_4_CH_3_CO_2_) for 8 h at room temperature. The supernatant portions were passed through 0.45‐μm polypropylene syringe filters using a 20‐mL syringe, and the solution was evaporated at 75°C in preparation for cation chromatography.
Bulk soil fraction samples were ashed in ceramic vessels for 8 h at 750°C (oven). One gram of the ashed soil was weighed into a Teflon beaker (15 mL) and dissolved with 5 mL of HF 29 N over 5 days at 85°C. The resulting solutions were evaporated and redissolved with 1 mL of 3‐N HNO_3_ at 85°C over 48 h.
Maple tree components (root, stem, leaf, leaf litter) were weighed (2 g) into a ceramic vessel and ashed in an oven for 8 h at 750°C. After cooling, samples were dissolved in Teflon beakers over a period of 24 h in a solution of 3 mL of nitric acid (3‐N HNO_3_) along with two drops of ultrapure hydrogen peroxide (30% H_2_O_2_).
In our simplified technique, 3 mL of the organic liquids (sap, sap concentrate or maple syrup) were poured into a 15‐mL centrifuge tube and diluted with 10 mL of Mill‐Q H_2_O and manually shaken to produce a thin juice. The thin juice was subsequently loaded in two 7.5‐mL aliquots onto 10‐mL Bio‐RadTM chromatography columns containing 4 mL of cleaned AG50‐X8 resin (100–200 mesh resin in a 1‐N HCl solution). Resin was cleaned by passing 5 mL of 6‐N HCl (three times), followed by 5 mL of 1 N HCl (three times). Once the sample was absorbed by the resin, the organic fraction of the thin juice was eluted by adding 15 mL of 1 N HCl (3 × 5 mL). The Sr and other cations were subsequently recovered by adding 10 mL of 6 N HCl (2 × 5 mL).
To provide validation, three samples were prepared using the protocol proposed above and the more traditional protocol in which 3 mL of sample is reacted with 16‐N HNO_3_ over a 24‐h period at 85°C followed by the addition of 2 drops of 30% H_2_O_2,_ until total digestion of organic matter [5, 12].
Regardless of the initial protocol, all samples were subsequently dried at 85°C for 24 h. In preparation for the purification of the Sr, the samples are dissolved in 1 mL of 8‐N HNO_3_ and placed in an ultrasonic bath for 10 min and then centrifuged for 10 min before loading onto the separation columns. Strontium was extracted from the samples by cation exchange chromatography using 0.25 mL of Eichrom Sr‐spec resin in a 1‐mL Bio‐RadTM column. The resin was washed using 2 mL of Mill‐Q H_2_O (one time) and 2 mL of 8 N HNO_3_ (three times). Samples were loaded (0.25 mL of sample in four times), rinsed (using 0.5 mL of 8‐N HNO_3_ for six times) and recovered (using 0.25 mL of 0.05‐N HNO_3_ for five times). At the end of the procedure, samples were dried at 85°C for 24 h. After evaporation, some maple syrup samples were split into two aliquots to compare analyses via TIMS and MC‐ICP‐MS. Samples analyzed by TIMS were dissolved in 1‐μL 16‐N HNO_3_ and loaded onto the Re‐filaments using 0.8‐μL tantalum oxide activator. Samples analyzed by MC‐ICP‐MS were dissolved using 5 mL of 2% HNO_3_ and then placed in an ultrasonic bath for 10 min before analysis.
Instrumentation and Measurements
2.4
For protocol validation, three maple syrup samples were analyzed via TIMS (Thermo Fisher) and multi‐collector inductively coupled plasma mass spectrometer (MC‐ICP‐MS, Nu Agilent). Although both instruments are capable of delivering the required precision (0.01%; [37], TIMS is favored for high precision analyses, while the MC‐ICP‐MS allows for more rapid data acquisition and higher sample throughput [13, 38]. The operating parameters for the instruments are given in Table 1. Samples and standards were introduced in solution mode using a CETAC Aridus II system in which the nebulizer gases (Ar, N_2_) were optimized for 1.5 L min^−1^ for Ar and 2–3 mL min^−1^ for N_2_. Potential interferences (Kr, residual Rb, Sr) were corrected by on‐peak‐zero analyses before each standard or sample analysis.
Repeated measurements (7) of the international standard NIST SRM 987 (Table 2) yielded a ^87^Sr/^86^Sr ratio of 0.71025 ± 0.00001 (2SD) for the TIMS and a 0.71024 ± 0.00001 (2SD) ratio for the MC‐ICP‐MS over the period of the study, with both agreeing with the certified value (0.710245 ± 0.000011; [39]. The measured Sr isotope ratios were corrected for instrumental fractionation by normalizing ratios to a ^86^Sr/^87^Sr ratio of 0.1194, and ^87^Rb interference was corrected using the ratio ^85^Rb/^87^Rb of 2.58745. The total procedure blank for all protocols was less than 100 pg of Sr.
Results
3
Protocol Comparisons
3.1
A comparison of the Sr isotope ratios for samples obtained by the proposed thin juice method versus the more traditional nitric acid/peroxide oxidation digestion method is shown in Table 3. Both protocols yielded identical Sr isotope ratios (within error) for sap and maple syrup samples LA1, SNA1, and 175, validating the thin juice method. These samples as well as maple syrup samples LA2, 129, and 155 analyzed by both TIMS and MC‐ICP‐MS instruments also produced similar results (within error). Thus, the thin juice method provides a rapid digestion/separation method for Sr isotopes in liquid‐based agri‐food products by either TIMS or MC‐ICP‐MS analysis.
Soil Profile Studies
3.2
Strontium isotope ratios from soil profiles and maple syrup samples are shown in Tables 4 and 5 and are plotted in Figure 3.
A comparison of 87Sr/86Sr values determined in bulk and labile fraction soil, maple root, stem, leaf litter, leaves, sap, concentrate sap, and syrup from Nomimingue (Laurentides) and Saint Norbert d'Arthabaska soil profiles.
In the Saint Norbert d'Arthabaska study area (An1 and An2 soil profiles), the ^87^Sr/^86^Sr isotope ratios of the bulk soils range from 0.7121 to 0.7168 and the labile fraction of the soils ranges from 0.7091 to 0.7093. The ^87^Sr/^86^Sr isotope ratios of the bulk soils are substantially more radiogenic and more variable than the ratios of the labile Sr fraction. The difference reflects the abundance of ^87^Sr in Rb‐rich silicates such as K‐Feldspar and micas that are only released through the HF‐HNO3 dissolution of the bulk soil fractions compared to the ^87^Sr‐poor phases (carbonates, loosely held Sr on mica surfaces) that are released during the labile soil extraction (see discussions in [5, 10, 12, 40, 41]).
The root, stem, leaf, and leaf litter samples yield ^87^Sr/^86^Sr ratios between 0.7092 and 0.7095. The sap, sap concentrate, and syrup sampled during different periods (early, ¼, mid, ¾, and late season) yielded very consistent values between 0.7091 and 0.7092. More importantly, the observed distribution entirely overlaps the range of values obtained from tree samples and the labile soil fraction (0.7091–0.7093).
The Sr‐isotope compositions of samples from the Laurentides region of the Grenville province (La1 and La2) are more variable. Labile soil fractions from La1 vary from 0.7119 to 0.7120 while bulk soil ratios vary from 0.7125 to 0.7166. The La2 profile yields higher ratios of 0.7130–0.7139 for the labile fraction soil and 0.7124–0.7142 for the bulk fraction soil. The different components of the maple tree show a strong correlation with the labile soil fraction, with ratios between 0.7124 and 0.7142 (La1) and 0.7124 and 0.7142 (La2). Maple syrup products, including sap and concentrate sampled during different periods of the season (early, ¼, mid, ¾, and late), vary between 0.7117 and 0.7122. ^87^Sr/^86^Sr values from the Laurentides study area are consistently higher than those from the Saint Norbert d'Arthabaska.
The large range in the labile soil fraction from the Laurentides area (0.712–0.714) suggests that the underlying geology is more variable than that in the Saint Norbert d'Arthabaska area. The heterogeneity of the labile soil values may reflect the presence of small intrusions and veins within the orthogneisses from Lacoste suite [32]. In contrast, the more limited range derived from the maple syrup samples was derived from maple syrup collected from trees over a wide area, thus representing an average of ^87^Sr/^86^Sr soil values in the producing region.
The results from all four studied profiles (Figure 3) confirm the similarity of the Sr isotope compositions of the labile soil fractions and corresponding maple trees and maple syrups. Thus, Sr isotopes are not affected by pedogenic and biologic processes, indicating that the Sr isotope composition of the labile soils can be determined by analyzing the corresponding maple products. In addition, the Sr isotope analyses of the sap, concentrate, and maple syrup products collected during early, ¼, mid, ¾, and late season of 2019 (Tables 4 and 5) yield comparable compositions. This is consistent with the observation that agrifood processing such as the fermentation of wine [13, 41, 42] or evaporation of maple syrup (present study) does not affect the ^87^Sr/^86^Sr isotopic signature of agrifood products.
Regional Maple Syrup Results
3.3
The ^87^Sr/^86^Sr isotope compositions for maple syrup samples from across Quebec are presented in Table 6. The large range (from 0.7069 to 0.7177) in the ^87^Sr/^86^Sr isotope ratios of the maple syrup from across Quebec (Figure 4A) reflects the diverse ages and rock types of the three geological provinces from which the maple syrup samples were derived.
Map showing the sample type and distribution of strontium isotope ratios (87Sr/86Sr) in the province of Quebec using both present and compiled bioavailable sample results. Maple syrup sampling locations of the study are indicated (circles, A) as well as other products (cheese, milk, wine) sampling sites (squares, B). See database in Supporting Information.
For example, the lowest ^87^Sr/^86^Sr ratio measured among the maple syrup samples was derived from a maple bush on the flanks of an intermediate to ultramafic Cretaceous alkaline intrusion in the Roxton‐Pond region, emplaced along the border of the Appalachian and St. Lawrence platform geological provinces.
In the Grenville province, the highest ^87^Sr/^86^Sr isotope composition (0.7149) is related to paragneiss rocks in the region of St‐Ubalde, while the lowest ^87^Sr/^86^Sr isotope composition (0.7085) is derived from a maple bush overlying a meta‐sedimentary sequence consisting of marble, calc‐silicate rocks, dolomite, quartz feldspathic schists, and quartzite from the Pays‐d'en‐Haut area. Maple syrup samples derived from granite and orthogneiss terrains within the Grenville province generally show a lower degree of variability in their ^87^Sr/^86^Sr isotope compositions (from 0.7102 to 0.7124). The samples from the Montcalm and Portneuf maple groves are derived from regions that straddle both the Grenville province and the St. Lawrence Platform; thus, the variation in their Sr isotope compositions (0.7092–0.7111) may reflect the geology of both provinces.
Appalachian province samples display values ranging from 0.7091 to 0.7177, reflecting the different geological features of the sampled terrains. The lowest value is associated with limestone‐rich terrains from Saint Norbert d'Arthabaska Centre‐du‐Québec as well as clay‐limestones sequences from d'Avignon, Gaspésie, and les Îles‐de‐la‐Madeleine (0.7098). The highest values are associated with a bedrock consisting of mica‐rich schists and metapelites that characterize the central portion of the Appalachian province.
In contrast to the above provinces, the variation in ^87^Sr/^86^Sr isotope compositions for maple samples from the St Lawrence platform is relatively low (0.7092–0.7110). The Lotbinière maple syrup value (0.7162) can be considered an outlier. The bedrock in this region consists of Ordovician mudrocks and shales of the Lorraine Group. The higher ^87^Sr/^86^Sr ratio could reflect the clay‐rich nature of the Lorraine Group.
Discussion
4
The Sr isotope data for the maple syrup analyses that are plotted on the map in Figure 4a are compared with the locations of previously studied agrifood products such as cheese, milk, and wine (Figure 4B). There is a general similarity in the range of Sr isotope ratios in a given geological province for the different agrifood products.
Bioavailable 87Sr/86Sr Map of Quebec
4.1
Strontium bioavailable mapping (isoscapes) uses the present‐day ^87^Sr/^86^Sr ratios of bedrock, soils, and plants to create a map in combination with geological data [43]. Bioavailable ^87^Sr/^86^Sr maps of varying types of samples, scales, and resolutions have been globally published for traceability purposes, in small or large scales [40]. Combining lithological and bioavailable maps provides a means of estimating the bioavailable ^87^Sr/^86^Sr; however, there are advantages and limitations of mapping bioavailable ^87^Sr/^86^Sr and bedrock background for provenance studies [41, 42, 43]. Authors (see reviews by [44]) have noted the indiscriminate use of isotopic data without the evaluation of types of sampled materials (rock, labile soils, ground water, plants, tooth, bone, wine, etc.). [45] concluded that small animals, plants, and soils are the preferred types of samples to develop ^87^Sr/^86^Sr isoscape maps. In light of this consensus, we combined the regional Sr isotope data for the maple syrup analyses of this study with previously published agrifood Sr isotope studies in Quebec (data in Table S1) to construct a bioavailable Sr isotope map for the province (Figure 5). The Sr isotope data was incorporated in ESRI ArcGIS Pro 3.0.0 using the Spatial Analyst and Geostatistical Analyst extensions coupled with a geological map of Quebec (1:2000.000, [14]).
(A) Lithological map of Quebec showing units with bioavailable 87Sr/86Sr results. The presented lithologies represent all units with 87Sr/86Sr information analyzed in this work or included from the literature. Agrifood 87Sr/86Sr values were extrapolated to the same rock units; (B) 87Sr/86Sr Isoscape showing the evolution of bioavailable strontium ratios into Superior, Grenville, Appalachian, and St. Lawrence platform geotectonic provinces individualized by period and lithology. Maps developed in ArcGIS Pro using the geological database from Quebec province [14].
The large sampling density, availability of high‐quality lithological maps, and proven strong correlation of ^87^Sr/^86^Sr values between rock, soil, labile soil, and agrifood products [10, 13, 18] lend themselves well to the production of an isocape. The isoscape provides context for future Sr isotope agrifood studies for terroir characterization and Sr isotope studies for biometric tracing of human and fauna migration.
In Figure 5A, we selected 26 lithological units that presented one or more Sr isotope results. Similar ^87^Sr/^86^Sr ratios for either maple syrup, tree roots, or other agricultural samples (milk, cheese) from the same geological unit underscore the geological dependence of the bioavailable Sr and the integrity of the ^87^Sr/^86^Sr isoscape maps. However, in the 26 different lithologies investigated, overlapping ^87^Sr/^86^Sr ratios were found in 8 of the lithological units, indicating that the strontium isotope ratios are not exclusive to a given geological unit.
In Figure 5B, the lithological units underlying the agrifood products from the province of Quebec are color‐coded into 5 different isotope groups based on spatial analysis (see Supporting Information) and represent the first bioavailable ^87^Sr/^86^Sr map for Canada.
The map reveals that lithologies with the highest Sr isotope ratios (0.7131–0.7177) are predominantly associated with mudrocks that are typically enriched in ^87^Sr due to their Rb‐rich compositions. Examples of these types of rocks are found in Cambrian to Ordovician (540–470 Ma) rocks in the Appalachian Province. Spatial patterns of ^87^Sr/^86^Sr results from Rb‐rich rocks are pronounced, following the regional geology, and elongated along a NE–SW direction, with higher ^87^Sr/^86^Sr in the central part of the map. These rocks encompass an age range between 550 and 435 Ma and are systematically higher than those of the adjoining Saint Lawrence platform (470–450 Ma). This distribution indicates that the ^87^Sr/^86^Sr results are not necessarily associated with a specific province or age, but with rock composition (Figure 5). For example, the lowest Sr isotope ratios are related to maple syrup samples from Sr‐rich carbonate rocks in the Grenville (0.7085), Appalachian (0.7090) and Saint Lawrence platform (0.7092) provinces. This first bioavailable ^87^Sr/^86^Sr map of Quebec is encouraging, but due to the high complexity of the geology, a clearer discrimination of ^87^Sr/^86^Sr distribution can be obtained by densifying and diversifying sample collections and geological unities.
Conclusions
5
This paper reported an improved method for the separation of strontium for ^87^Sr/^86^Sr isotope ratio studies in liquids by combining two different cation‐exchange chromatography steps. Results confirm that ^87^Sr/^86^Sr maple syrup methodology can be considered a reliable protocol for use in agri‐food provenance studies.
This study demonstrated that there is no fractionation of the ^87^Sr/^86^Sr ratio between the labile soil fraction, different parts of the maple tree, and all products from maple sap (sap, concentrate and maple syrup). We also did not notice differences during the different phases of evaporation of the sap to produce maple syrup. We confirm that the underlying geology is the dominant control on the isotope composition across different geological provinces in Quebec. The study demonstrates that the ^87^Sr/^86^Sr ratios of maple syrup are faithful to the underlying geology and that the ^87^Sr/^86^Sr ratios can be a powerful tracer of provenance at the local scale with local geological control.
The data from this study was used to develop a bioavailable ^87^Sr/^86^Sr map of Quebec that can be used to predict the geographical origin of agrifood products from southern Quebec. The map is a promising first step given the relatively small density of samples. Further sampling is needed to establish the robustness of the method and the map.
Author Contributions
R. Stevenson: conceptualization, investigation, funding acquisition, methodology, validation, visualization, writing – review and editing, supervision. M. Sadiki: conceptualization, investigation, funding acquisition, writing – review and editing, methodology, validation, resources. L. Lagacé: conceptualization, investigation, funding acquisition, methodology, validation, writing – review and editing, resources. D. Widory: conceptualization, investigation, funding acquisition, methodology, validation, writing – review and editing, supervision, resources, project administration.
Supporting information
Table S1. Agrifood sample type and ^87^Sr/^86^Sr ratios available in the literature for the province of Quebec. Sample coordinates are reported in the World Geodetic System 1984 (WGS84).
Table S2. 87Sr/86Sr isotopic data for agrifood samples from Quebec.
The reference list from the paper itself. Each links out to its DOI / PubMed record.
- 1L. Lagace , S. Leclerc , C. Charron , and M. Sadiki , “Biochemical Composition of Maple Sap and Relationships Among Constituents,” Journal of Food Composition and Analysis 41 (2015): 129–136, 10.1016/j.jfca.2014.12.030. · doi ↗
- 2M. F. Morselli , “Chemical Composition of Maple Syrup,” Maple Research Data No. 1, Burlington, 1975.
- 3J. G. Stuckel and N. H. Low , “The Chemical Composition of 80 Pure Maple Syrup Samples Produced in North America,” Food Research International 29 (1996): 373–379, 10.1016/0963-9969(96)00000-2. · doi ↗
- 4R. Cellier , S. Berail , J. Barre , et al., “Analytical Strategies for Sr and Pb Isotopic Signatures by MC‐ICP‐MS Applied to the Authentication of Champagne and Other Sparkling Wines,” Talanta 234 (2021): 122433, 10.1016/j.talanta.2021.122433.34364413 · doi ↗ · pubmed ↗
- 5V. Vinciguerra , R. Stevenson , K. Pedneault , A. Poirier , J.‐F. Hélie , and D. Widory , “Strontium Isotope Characterization of Wines From Quebec, Canada,” Food Chemistry 210 (2016): 121–128, 10.1016/j.foodchem.2016.04.017.27211629 · doi ↗ · pubmed ↗
- 6S. Voerkelius , G. D. Lorenz , S. Rummel , et al., “Strontium Isotopic Signatures of Natural Mineral Waters, the Reference to a Simple Geological Map and Its Potential for Authentication of Food,” Food Chemistry 118 (2010): 933–940, 10.1016/j.foodchem.2009.04.125. · doi ↗
- 7C. C. Schnetzler and J. A. Philpotts , “Partition Coefficients of Rare‐Earth Elements Between Igneous Matrix Material and Rock‐Forming Mineral Phenocrysts—II,” Geochimica et Cosmochimica Acta 34 (1970): 331–340, 10.1016/0016-7037(70)90110-9. · doi ↗
- 8M. Berglund and M. E. Wieser , “Isotopic Compositions of the Elements 2009 (IUPAC Technical Report),” Pure and Applied Chemistry 83 (2011): 397–410, 10.1351/PAC-REP-10-06-02. · doi ↗