Renal function and efficacy of dual antiplatelet vs. alteplase in minor stroke: a post hoc analysis of ARAMIS study
Xiao-Yi He, Chao He, Hui-Sheng Chen

TL;DR
This study found that kidney function does not significantly affect the effectiveness of two stroke treatments in patients with minor strokes.
Contribution
The study provides new evidence on the lack of interaction between renal function and treatment outcomes in minor stroke patients.
Findings
Patients with normal kidney function showed a trend toward better outcomes with DAPT compared to alteplase.
No significant differences in outcomes were observed in patients with mildly decreased or severely impaired kidney function.
The interaction between treatment and renal function was not statistically significant.
Abstract
This secondary analysis of the ARAMIS trial evaluated renal function’s modifying effects on therapeutic responses to dual antiplatelet therapy (DAPT) versus intravenous thrombolysis in acute minor ischemic stroke. Based on the as-treated set, we stratified patients by admission estimated glomerular filtration rate into three groups: normal renal function (≥90 mL/min/1.73 m2), mildly decreased renal function (eGFR 60 to 89 mL/min/1.73 m2), and moderate to severe impairment renal function group (<60 mL/min/1.73 m2). The primary endpoint was excellent functional outcome defined as a modified Rankin Scale score of 0–1 at 90 days. Among 615 analyzed patients, 367 (59.7%) exhibited normal renal function, 209 (34.0%) exhibited mildly decreased renal function and 39 (6.3%) exhibited moderate to severe impairment renal function. A numerically higher rate of excellent functional outcome was…
Genes, proteins, chemicals, diseases, species, mutations and cell lines named across the full text — each resolved to its canonical identifier and authoritative record.
Click any figure to enlarge with its caption.
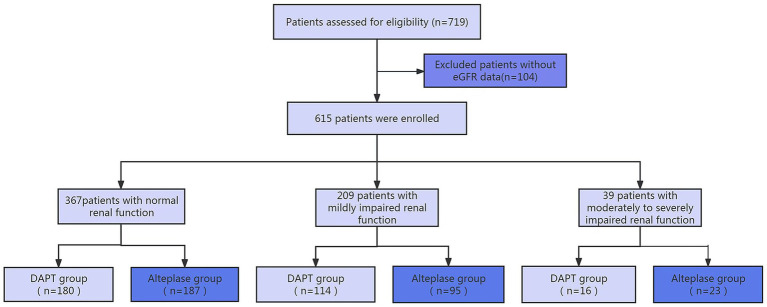 Figure 1
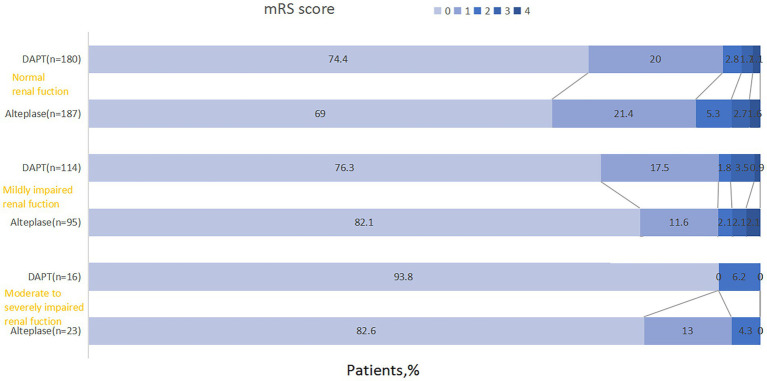 Figure 2
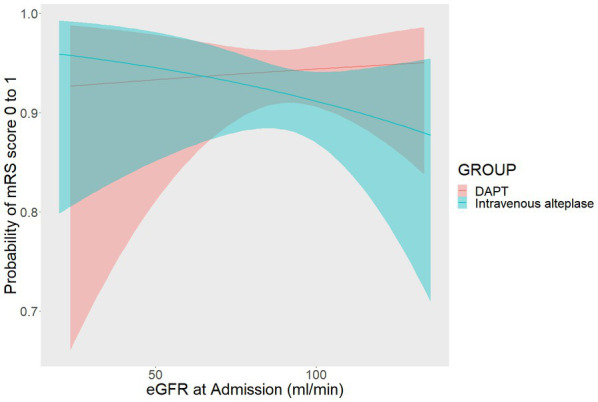 Figure 3
| Characteristics | Normal renal function ( | Mildly decreased renal function ( | Moderate to severe impairment renal function ( | |
|---|---|---|---|---|
| Age, y | 60 (54–66) | 70 (63–77) | 69 (62–78) | <0.001 |
| Sex | ||||
| Male | 260 (70.8) | 145 (69.4) | 24 (61.5) | 0.480 |
| Female | 107 (29.2) | 64 (30.6) | 15 (38.5) | |
| Current smokinga | 142 (38.7) | 61 (29.2) | 5 (12.8) | 0.001 |
| Current drinkinga | 67 (18.3) | 30 (14.4) | 9 (23.1) | 0.299 |
| Medical history | ||||
| Hypertension | 189 (51.5) | 117 (56.0) | 22 (56.4) | 0.540 |
| Diabetes | 89 (24.3) | 58 (27.8) | 14 (35.9) | 0.237 |
| Previous strokeb | 74 (20.2) | 52 (24.9) | 14 (35.9) | 0.056 |
| Previous TIA | 1 (0.3) | 2 (1.0) | 0 (0) | 0.424 |
| Onset to treatment time, min | 180 (129–226) | 187 (139–230) | 163 (120–217) | 0.236 |
| International normalized ratio | 0.99 (0.93–1.04) | 1.01 (0.95–1.06) | 0.96 (0.91–1.02) | 0.002 |
| Activated partial thromboplastin time, s | 31.7 (27.2–36.1) | 33.0 (28.3–37.4) | 32.3 (28.5–36.6) | 0.050 |
| Systolic blood pressure, mm Hg | 150 (138–163) | 150.0 (139–163) | 160 (138–170) | 0.242 |
| Diastolic blood pressure, mm Hg | 88 (80–97) | 87 (80–93) | 88 (80–98) | 0.181 |
| Blood glucose, mmol/L | 6.6 (5.5–9.3) | 6.5 (5.5–9.6) | 7.4 (5.7–9.7) | 0.403 |
| Baseline NIHSSc | 2 (1–3) | 2 (1–3) | 2 (1–3) | 0.822 |
| Estimated premorbid function (mRS) | ||||
| mRS 0 | 280 (76.3) | 145 (69.4) | 26 (66.7) | 0.122 |
| mRS 1 | 87 (23.7) | 64 (30.6) | 13 (33.3) | |
| Presumed stroke caused | ||||
| Large artery atherosclerosis | 56 (15.3) | 34 (16.3) | 4 (10.3) | 0.595 |
| Cardioembolic | 1 (0.3) | 0 (0) | 1 (2.6) | |
| Small artery occlusion | 93 (25.3) | 47 (22.5) | 10 (25.6) | |
| Other determined cause | 2 (0.5) | 2 (10.0) | 0 | |
| Undetermined cause | 215 (58.6) | 126 (60.3) | 24 (61.5) | |
| Characteristics | Normal renal function ( | Mildly decreased renal function ( | Moderate to severe impairment renal function ( | ||||||
|---|---|---|---|---|---|---|---|---|---|
| DAPT ( | Alteplase ( | DAPT ( | Alteplase ( | DAPT ( | Alteplase ( | ||||
| Age, y | 60 (54–67) | 60 (55–66) | 0.439 | 69 (63–77) | 71 (63–78) | 0.446 | 71 (64–80) | 68 (60–78) | 0.310 |
| Sex | |||||||||
| Male | 122 (67.8) | 138 (73.8) | 0.205 | 86 (75.4) | 59 (62.1) | 0.037 | 9 (56.3) | 15 (65.2) | 0.571 |
| Female | 58 (32.2) | 49 (26.2) | 28 (24.6) | 36 (37.9) | 7 (43.8) | 8 (34.8) | |||
| Current smokinga | 66 (36.7) | 76 (40.6) | 0.434 | 35 (30.7) | 26 (27.4) | 0.598 | 1 (6.3) | 4 (17.4) | 0.631 |
| Current drinkinga | 32 (17.8) | 35 (18.7) | 0.563 | 20 (17.5) | 10 (10.5) | 0.150 | 2 (12.5) | 7 (30.4) | 0.262 |
| Medical history | |||||||||
| Hypertension | 100 (55.6) | 89 (47.6) | 0.127 | 69 (60.5) | 48 (50.5) | 0.147 | 10 (62.5) | 12 (52.2) | 0.522 |
| Diabetes | 44 (24.4) | 45 (24.1) | 0.932 | 36 (31.6) | 22 (23.2) | 0.176 | 6 (37.5) | 8 (34.8) | 0.862 |
| Previous strokeb | 36 (20.0) | 38 (20.3) | 0.939 | 26 (22.8) | 26 (27.4) | 0.448 | 6 (37.5) | 8 (34.8) | 0.862 |
| Previous TIA | 1 (0.6) | 0 (0) | 0.490 | 1 (0.9) | 1 (1.1) | 1.000 | 0 (0) | 0 (0) | NA |
| OTT, min | 184 (136–230) | 168 (123–216) | 0.061 | 184 (135–227) | 188 (147–233) | 0.389 | 163 (107–212) | 188 (124–225) | 0.710 |
| INR | 0.99 (0.92–1.04) | 0.98 (0.94–1.05) | 0.582 | 1.02 (0.96–1.08) | 0.99 (0.93–1.04) | 0.012 | 0.95 (0.90–1.05) | 0.97 (0.91–1.00) | 0.875 |
| APTT, s | 31.3 (27.0–36.1) | 32.1 (27.4–36.1) | 0.507 | 33.9 (28.2–38.7) | 32.5 (28.4–36.1) | 0.129 | 31.9 (27.7–38.6) | 32.3 (28.5–36.6) | 0.977 |
| SBP, mm Hg | 150 (136–166) | 152 (138–161) | 0.773 | 152 (138–167) | 150 (140–161) | 0.528 | 149 (131–166) | 167 (145–174) | 0.036 |
| DBP, mm Hg | 88 (81–95) | 89 (80–98) | 0.629 | 87 (80–94) | 87 (80–93) | 0.546 | 87 (77–96) | 90 (82–98) | 0.297 |
| BG, mmol/L | 6.6 (5.4–10.6) | 6.6 (5.5–8.7) | 0.916 | 6.6 (5.5–10.6) | 6.2 (5.4–8.5) | 0.292 | 7.2 (5.6–17.1) | 7.4 (6.2–9.7) | 0.786 |
| Baseline NIHSSc | 2 (1–3) | 2 (1–3) | 0.512 | 2 (1–3) | 2 (2–3) | 0.057 | 2 (1–3) | 2 (1–3) | 0.953 |
| Estimated premorbid function (mRS) | |||||||||
| mRS 0 | 142 (78.9) | 138 (73.8) | 0.252 | 81 (71.1) | 64 (67.4) | 0.565 | 8 (50.0) | 18 (78.3) | 0.066 |
| mRS 1 | 38 (21.1) | 49 (26.2) | 33 (28.9) | 31 (32.6) | 8 (50.0) | 5 (21.7) | |||
| Presumed stroke caused | |||||||||
| LAA | 28 (15.6) | 28 (15.0) | 0.737 | 20 (17.5) | 14 (14.7) | 0.943 | 1 (6.3) | 3 (13.0) | 0.879 |
| Cardioembolic | 1 (0.6) | 0 (0) | 0 (0) | 0 (0) | 0 (0) | 1 (4.3) | |||
| SAO | 45 (25.0) | 48 (25.7) | 25 (21.9) | 22 (23.2) | 5 (31.3) | 5 (21.7) | |||
| ODC | 0 (0) | 2 (1.1) | 1 (0.9) | 1 (1.1) | 0 (0) | 0 (0) | |||
| UC | 106 (58.9) | 109 (58.3) | 68 (59.6) | 58 (61.1) | 10 (62.5) | 14 (60.9) | |||
| Outcome | Renal function | DAPT | Alteplase | Treatment effect metric | OR (95% CI) | Adjusteda OR (95% CI) | Adjustedb
| ||
|---|---|---|---|---|---|---|---|---|---|
| mRS 0 to 1 at 90 daysc | Normal | 170 (94.4) | 169 (90.4) | OR | 1.811 (0.812–4.037) | 0.147 | / | / | 0.337 |
| Mildly decreased | 107 (93.9) | 89 (93.7) | 1.030 (0.334–3.178) | 0.958 | 1.095 (0.343–3.494) | 0.878 | |||
| Moderate to severe impairment | 15 (93.8) | 22 (95.7) | 0.682 (0.040–11.769) | 0.792 | 0.536 (0.025–11.342) | 0.688 | |||
| mRS 0 to 2 at 90 daysc | Normal | 175 (97.2) | 179 (95.7) | OR | 1.564 (0.502–4.874) | 0.440 | / | / | 0.447 |
| Mildly decreased | 109 (95.6) | 91 (95.8) | 0.958 (0.250–3.674) | 0.950 | 0.899 (0.225–3.595) | 0.881 | |||
| Moderate to severe impairment | 16 (100.0) | 23 (100.0) | NA | NA | NA | NA | |||
| mRS distribution at 90 days | Normal | OR | 1.347 (0.857–2.117) | 0.196 | / | / | |||
| Mildly decreased | 0.723 (0.368–1.420) | 0.347 | 0.691 (0.345–1.384) | 0.297 | |||||
| Moderate to severe impairment | 2.930 (0.304–28.191) | 0.352 | 2.995 (0.282–31.785) | 0.363 | |||||
| ENI within 24 hd | Normal | 26 (14.4) | 42 (22.5) | OR | 0.583 (0.340–0.999) | 0.050 | / | / | 0.518 |
| Mildly decreased | 18 (15.8) | 23 (24.2) | 0.587 (0.295–1.168) | 0.129 | 0.643 (0.316–1.310) | 0.224 | |||
| Moderate to severe impairment | 2 (12.5) | 3 (13.0) | 0.952 (0.140–6.465) | 0.960 | 0.788 (0.103–5.897) | 0.808 | |||
| END within 24 he | Normal | 8 (4.4) | 18 (9.6) | OR | 0.437 (0.185–1.031) | 0.059 | / | / | 0.536 |
| Mildly decreased | 2 (1.8) | 5 (5.3) | 0.321 (0.061–1.696) | 0.181 | 0.314 (0.059–1.679) | 0.176 | |||
| Moderate to severe impairment | 1 (6.3) | 4 (17.4) | 0.317 (0.032–3.138) | 0.326 | 0.622 (0.053–7.343) | 0.706 | |||
| Change in NIHSS at 24 hf | Normal | 0 (−0.75 to 0) | 0 (−1.00 to 0) | GMR | 0.057 (−0.368–0.482) | 0.105 | / | / | |
| Mildly decreased | 0 (−1.00 to 0) | 0 (−1.00 to 0) | −0.054 (−0.440–0.331) | 0.782 | −0.049 (−0.439–0.340) | 0.804 | |||
| Moderate to severe impairment | −0.50 (−1.00 to 0) | 0 (−1.00 to 0) | −0.660 (−1.872–0.551) | 0.285 | −0.414 (−1.673–0.845) | 0.519 | |||
| Stroke or other vascular events within 90 days | Normal | 0 (0) | 2 (1.1) | HR | NA | 0.996 | / | / | 0.997 |
| Mildly decreased | 0 (0) | 0 (0) | NA | NA | NA | NA | |||
| Moderate to severe impairment | 0 (0) | 0 (0) | NA | NA | NA | NA | |||
| Death at 90 days | Normal | 0 (0) | 0 (0) | RD | NA | NA | / | NA | NA |
| Mildly decreased | 0 (0) | 0 (0) | NA | NA | NA | NA | |||
| Moderate to severe impairment | 0 (0) | 0 (0) | NA | NA | NA | NA | |||
| sICHg | Normal | 0/180 (0) | 0/187 (0) | RD | NA | NA | / | / | 1.000 |
| Mildly decreased | 0/114 (0) | 1/95 (1.1) | NA | 0.996 | NA | 0.996 | |||
| Moderate to severe impairment | 0/16 (0) | 0 (0) | NA | NA | NA | NA | |||
| Any bleeding events | Normal | 2/180 (1.1) | 14/187 (7.5) | OR | 0.139 (0.031–0.620) | 0.010 | / | / | 0.035 |
| Mildly decreased | 1/114 (0.9) | 2/95 (2.1) | 0.412 (0.037–4.610) | 0.592 | 0.388 (0.034–4.398) | 0.444 | |||
| Moderate to severe impairment | 1/16 (6.25) | 0 (0) | 0.000 | 0.998 | 0.000 | 0.998 |
| Characteristics | Normal renal function ( | Abnormal renal function ( | ||||
|---|---|---|---|---|---|---|
| DAPT ( | Alteplase ( | DAPT ( | Alteplase ( | |||
| Age, y | 60 (54–67) | 60 (55–66) | 0.439 | 70 (63–77) | 71 (62–78) | 0.673 |
| Sex | ||||||
| Male | 122 (67.8) | 138 (73.8) | 0.205 | 95 (73.1) | 74 (62.7) | 0.080 |
| Female | 58 (32.2) | 49 (26.2) | 35 (26.9) | 44 (37.3) | ||
| Current smokinga | 66 (36.7) | 76 (40.6) | 0.434 | 36 (27.7) | 30 (25.4) | 0.686 |
| Current drinkinga | 32 (17.8) | 35 (18.7) | 0.563 | 22 (16.9) | 17 (14.4) | 0.587 |
| Medical history | ||||||
| Hypertension | 100 (55.6) | 89 (47.6) | 0.127 | 79 (60.8) | 60 (50.8) | 0.116 |
| Diabetes | 44 (24.4) | 45 (24.1) | 0.932 | 42 (32.3) | 30 (25.4) | 0.233 |
| Previous strokeb | 36 (20.0) | 38 (20.3) | 0.939 | 32 (24.6) | 34 (28.8) | 0.455 |
| Previous TIA | 1 (0.6) | 0 (0) | 0.490 | 1 (0.8) | 1 (0.8) | 1.000 |
| OTT, min | 184 (136–230) | 168 (123–216) | 0.061 | 180 (135–222) | 188 (139–231) | 0.418 |
| INR | 0.99 (0.92–1.04) | 0.98 (0.94–1.05) | 0.582 | 1.02 (0.95–1.08) | 0.98 (0.93–1.04) | 0.605 |
| APTT, s | 31.3 (27.0–36.1) | 32.1 (27.4–36.1) | 0.507 | 33.7 (28.2–38.7) | 32.4 (28.5–36.1) | 0.929 |
| BG, mmol/L | 6.6 (5.4–10.6) | 6.6 (5.5–8.7) | 0.916 | 6.7 (5.5–10.6) | 6.6 (5.5–8.9) | 0.005 |
| SBP, mmHg | 150 (136–166) | 152 (138–161) | 0.773 | 152 (138–166) | 152 (140–165) | 0.521 |
| DBP, mmHg | 88 (81–95) | 89 (80–98) | 0.629 | 87 (80–95) | 87 (80–94) | 0.804 |
| Baseline NIHSSc | 2 (1–3) | 2 (1–3) | 0.512 | 2 (1–3) | 2 (1–3) | 0.093 |
| Estimated premorbid function (mRS) | ||||||
| mRS 0 | 142 (78.9) | 138 (73.8) | 0.252 | 89 (68.5) | 82 (69.5) | 0.861 |
| mRS 1 | 38 (21.1) | 49 (26.2) | 41 (31.5) | 36 (30.5) | ||
| Presumed stroke caused | ||||||
| LAA | 28 (15.6) | 28 (15.0) | 0.737 | 21 (16.2) | 17 (14.4) | 0.950 |
| Cardioembolic | 1 (0.6) | 0 (0) | 0 (0) | 1 (0.8) | ||
| SAO | 45 (25.0) | 48 (25.7) | 30 (23.1) | 27 (22.9) | ||
| ODC | 0 (0) | 2 (1.1) | 1 (0.8) | 1 (0.8) | ||
| UC | 106 (58.9) | 109 (58.3) | 78 (60.0) | 72 (61.0) | ||
| Outcome | Renal function | DAPT | Alteplase | Treatment effect metric | Unadjusted | Adjusteda | Adjustedb
| ||
|---|---|---|---|---|---|---|---|---|---|
| treatment difference (95% CI) | treatment difference (95% CI) | ||||||||
| mRS 0 to 1 at 90 dc | Normal | 170 (94.4) | 169 (90.4) | OR | 1.811 (0.812–4.037) | 0.147 | / | / | 0.357 |
| Abnormal | 122 (93.8) | 111 (94.1) | 0.962 (0.338–2.738) | 0.942 | 0.959 (0.331–2.776) | 0.938 | |||
| mRS 0 to 2 at 90 dc | Normal | 175 (97.2) | 179 (95.7) | OR | 1.564 (0.502–4.874) | 0.440 | / | / | 0.566 |
| Abnormal | 125 (96.2) | 114 (96.6) | 0.877 (0.230–3.347) | 0.848 | 0.928 (0.236–3.654) | 0.915 | |||
| mRS distribution at 90 d | Normal | OR | 1.347 (0.857–2.117) | 0.196 | / | / | |||
| Abnormal | 0.801 (0.428–1.498) | 0.487 | 0.790 (0.418–1.492) | 0.467 | |||||
| ENI within 24 hd | Normal | 26 (14.4) | 42 (22.5) | OR | 0.583 (0.340–0.999) | 0.050 | / | / | 0.862 |
| Abnormal | 20 (15.4) | 26 (22.0) | 0.643 (0.337–1.227) | 0.180 | 0.565 (0.288–1.107) | 0.096 | |||
| END within 24 he | Normal | 8 (4.4) | 18 (9.6) | OR | 0.437 (0.185–1.031) | 0.059 | / | / | 0.599 |
| Abnormal | 3 (2.3) | 9 (7.6) | 0.286 (0.076–1.083) | 0.065 | 0.268 (0.068–1.055) | 0.060 | |||
| Change in NIHSS at 24 hf | Normal | 0 (−0.75 to 0) | 0 (−1.00 to 0) | GMR | 0.057 (−0.368–0.482) | 0.792 | / | / | |
| Abnormal | 0 (−1.00 to 0) | 0 (−1.00 to 0) | −0.191 (−0.570–0.188) | 0.324 | −0.186 (−0.572–0.200) | 0.345 | |||
| Stroke or other vascular events within 90 d | Normal | 0 (0) | 2 (1.1) | HR | NA | 0.996 | / | / | 0.997 |
| Abnormal | 0 (0) | 0 (0) | NA | NA | NA | NA | |||
| Death at 90 d | Normal | 0 (0) | 0 (0) | RD | NA | NA | / | / | NA |
| Abnormal | 0 (0) | 0 (0) | NA | NA | NA | NA | |||
| sICHg | Normal | 0/180 (0) | 0/187 (0) | RD | NA | NA | / | / | 0.997 |
| Abnormal | 0/130 (0) | 1/118 (0.8) | NA | 1.000 | NA | 0.996 | |||
| Any bleeding events | Normal | 2/180 (1.1) | 14/187 (7.5) | OR | 7.202 (1.613–32.159) | 0.010 | / | / | 0.117 |
| Abnormal | 2/130 (1.5) | 2/118 (1.7) | 1.103 (0.153–7.960) | 0.922 | 1.040 (0.143–7.562) | 0.969 | |||
Peer Reviews
No public reviews on file for this paper yet. If you reviewed it on a platform where reviews are public (OpenReview, ICLR, NeurIPS, ICML), you can paste yours below so the community can read it here.
Videos
No videos yet. Explain this paper in a talk, walkthrough, or lecture? Add one.
Taxonomy
TopicsBlood Pressure and Hypertension Studies · Acute Ischemic Stroke Management · Antiplatelet Therapy and Cardiovascular Diseases
Introduction
Intravenous thrombolysis constitutes standard care for acute ischemic stroke, its clinical utility in minor nondisabling strokes remains a subject of clinical equipoise (1). Contemporary evidence demonstrates dual antiplatelet therapy’s (DAPT) capacity to mitigate stroke recurrence when initiated within 24 h of symptom onset (2, 3), though its functional outcome benefits remain unestablished. Recently, the ARAMIS (Antiplatelet vs. R-tPA for Acute Mild Ischemic Stroke) trial established noninferiority of DAPT versus alteplase for achieving 90-day functional independence (mRS 0–1) in minor strokes treated within 4.5 h (4).
Chronic kidney disease affects >30% of ischemic stroke patients (5), with emerging data implicating renal insufficiency as an independent predictor of stroke severity, post-stroke disability, and mortality (6–13). Further studies suggest that renal function modulates therapeutic efficacy across stroke interventions—influencing antiplatelet response (14), as well as thrombolysis (15) and thrombectomy outcomes (16). In addition, patients with renal dysfunction have increased platelet activation and aggregation, with a higher prevalence of poor responsiveness to aspirin or clopidogrel antiplatelet treatment (17–19). Despite these associations, the potential modification of DAPT versus thrombolysis treatment effects by renal status in minor stroke remains unexplored.
This investigation leverages ARAMIS trial data to elucidate renal function’s potential role as an effect modifier between DAPT and alteplase in minor nondisabling stroke, evaluating both therapeutic efficacy and safety profiles across renal function strata.
Methods
Study design and participants
The ARAMIS trial methodology has been comprehensively documented in primary publications (4), which was a multicenter randomized design comparing dual antiplatelet therapy (DAPT) against intravenous alteplase in minor stroke (NIHSS ≤ 5 with nondisabling deficits) treated ≤4.5 h post-onset. Inclusion required age ≥ 18 years with preserved consciousness (score = 0) and absence of clinically significant focal deficits (single-item NIHSS ≤ 1). Creatinine availability served as an exclusion criterion. Regulatory approvals were obtained from the General Hospital of Northern Theater Command ethics board and participating centers, with written informed consent from all participants.
Renal stratification
Participants underwent renal function categorization using admission eGFR values: normal renal function group (≥90 mL/min/1.73 m^2^), mildly decreased renal function group (eGFR 60 to 89 mL/min/1.73 m^2^), and moderate to severe impairment renal function group (<60 mL/min/1.73 m^2^) (14, 20, 21). Therapeutic protocols included:
Thrombolysis arm: Weight-adjusted alteplase (0.9 mg/kg; 10% bolus + 90% infusion) capped at 90 mg, followed by standard antiplatelet regimens 24 h after alteplase.DAPT arm: Clopidogrel loading (300 mg) on the first day and followed 75 mg/d (12 ± 2d) with aspirin (100 mg/d) followed by guideline-directed maintenance.Neurological status was quantified via NIHSS at baseline and 24 h post-randomization. Follow-up evaluations at 90 days captured functional outcomes (mRS), vascular events, and safety endpoints.
Calculation of eGFR
The eGFR was calculated using the Chronic Kidney Disease Epidemiology Collaboration creatinine equation (CKD-EPI) (22): eGFR = 141 × min(SCr/k,1)^α^× max(SCr/k,1)^–1.209^ × 0.993^Age^ × 1.018 (if female). Sex-specific coefficients: k = 0.7 (F)/0.9 (M); α = −0.329 (F)/−0.411 (M). The CKD-EPI China equation was calculated with a coefficient of 1.1 (23).
Study outcomes
The primary outcome was excellent functional outcome at 90 days, defined as a modified Rankin Scale (mRS) score of 0 to 1. The secondary outcomes were favorable functional outcome (mRS score of 0 to 2) at 90 days, change in NIHSS score at 24 h, early neurological improvement at 24 h (defined as a decrease of 2 or more points in the NIHSS score), early neurological deterioration at 24 h (defined as an increase of 2 or more points in the NIHSS score but not as a result of cerebral hemorrhage), new stroke or other vascular events at 90 days, 90-day all-cause mortality, and ordinal shift of the mRS score at 90 days. The safety outcomes were symptomatic intracerebral hemorrhage (sICH), defined as evidence of bleeding on head computed tomographic scan associated with neurological deterioration (≥4-point increase in NIHSS score), and any bleeding event during the study.
Statistical analysis
This exploratory secondary analysis was based on the as-treated set. Non-normal continuous variables expressed as median [IQR] with Mann–Whitney comparisons. Categorical data analyzed via χ^2^ tests.
For functional outcome at 90 days, change in NIHSS score at 24 h, early neurological improvement at 24 h, early neurological deterioration at 24 h, new stroke or other vascular events at 90 days, 90-day all-cause mortality, ordinal shift of mRS score at 90 days, sICH and any bleeding event, binary logistic regression analyses were performed. The treatment effects for the above outcomes are presented as odds ratios (ORs) with 95% confidence intervals (CIs). Covariate adjusted analyses were also performed for all outcomes, adjusting for the unbalanced baseline characteristics with p < 0.05. The interaction between renal function and treatment effect was also analyzed. As a sensitive analysis, we further compared the treatment effects in another grouping method (eGFR: ≥90 vs. <90 mL/min/1.73m^2^). SPSS 26.0 software and R software version 4.1.0 (R Foundation for Statistical Computing) were used for statistical analysis, and a bilateral test was used. When p < 0.05 there was statistical significance.
Results
Baseline characteristics
As shown in Figure 1, following exclusion of 104 participants lacking baseline eGFR measurements, the final cohort comprised 615 individuals stratified by renal function status: normal (n = 367, 59.7%) versus mildly decreased (n = 209, 34.0%) and moderate to severe impairment (n = 39, 6.3%) (Figure 1). Table 1 presented patient characteristics among three groups by eGFR category. Baseline demographic disparities emerged between renal subgroups for age, smoking history, and international normalized ratio. Table 2 compared the patient characteristics between DAPT and alteplase groups across the three groups. Treatment arms maintained balance across renal function categories except for sex and international normalized ratio in mildly decreased renal function subgroup, and systolic pressure in moderate to severe impairment renal function subgroup (Table 2).
The flow chart of the study.
Table 3 presented clinical outcomes. Intervention effects stratified by renal function revealed a numerically higher proportion of excellent functional outcome (mRS 0–1) with DAPT versus alteplase in normal renal function (94.4% vs. 90.4%; absolute difference 4.0%, OR = 1.81 [95% CI 0.81–4.04], p = 0.147), contrasting with comparable efficacy in mildly decreased renal function subgroup (93.9% vs. 93.7%; absolute difference: 0.2%; adjusted OR = 1.095 [95% CI 0.343–3.494], p = 0.878) and moderate to severe impairment renal function subgroup (93.8% vs. 95.7%; absolute difference: 1.9%; adjusted OR = 0.536 [95% CI 0.025–11.342], p = 0.688) (Table 3). Formal interaction testing demonstrated nonsignificant renal function-by-treatment effect on primary outcome (adjusted P interaction = 0.337). As shown in Figure 2, parallel patterns emerged for functional recovery (mRS 0–2) and ordinal mRS distribution.
Distribution of modified Rankin Scale (mRS) score between three groups according to renal function status.
Consistent with primary trial findings (4), thrombolysis arm exhibited greater 24-h neurological improvement rates and lower neurological deterioration incidence compared to DAPT, irrespective of renal status (Table 3). Secondary endpoints including 24 h NIHSS change, 90-day vascular events, and mortality showed no intergroup differences (Table 3).
As to the safety outcomes, no sICH occurred in patients with normal renal function and moderate to severe impairment renal function subgroup, while 1 patient experienced sICH in the alteplase group with mildly decreased renal function subgroup (Table 3).
As a sensitive analysis, we analyzed the results in patients stratified by eGFR ≥90 vs. <90 mL/min/1.73m^2^. The baseline characteristics of this stratification population are shown in Table 4. The similar results were found in this grouping patients (Table 5).
Table 4: Comparison of patient characteristics between the two groups by eGFR ≥90 vs.<90 mL/min/1.73m2.
Table 5: Clinical outcomes stratified by eGFR ≥ 90 vs. <90 mL/min/1.73m2.
When eGFR was used as a continuous variable, DAPT was more likely to result in an excellent functional outcome than alteplase in patients with normal renal function (OR = 1.448 [95% CI 0.773–2.713], p = 0.247). As shown in Figure 3, the likelihood of an excellent functional outcome increased as eGFR increased in the DAPT group, but there was a reverse trend in the alteplase group.
The relationship between the probability of modified Rankin Scale (mRS) score 0 to1 and estimated glomerular filtration rate (eGFR).
Discussion
The ARAMIS trial established non-inferiority of dual antiplatelet therapy (DAPT) versus intravenous alteplase for achieving 90-day functional independence in minor nondisabling strokes treated within 4.5 h. Our exploratory analysis revealed a numerical trend favoring DAPT over thrombolysis in preserved renal function cohorts (adjusted OR = 1.81), though statistical significance remained elusive potentially due to subgroup sample constraints.
In agreement with the previous epidemiological statistics (24), patients with renal impairment were older and had a higher burden of current smoking in this post hoc analysis. These results seem plausible given the obvious influence of age (25), and smoking (26)on renal function, and their close associations with stroke (27).
In this secondary analysis, we found that patients with better renal function are more likely to have an excellent functional outcome in DAPT group, which is consistent with previous findings that renal function was associated with the antiplatelet treatment effect after stroke (14). Nephropathy was associated with altered cerebral perfusion, cerebral neurovascular coupling, and blood vessel integrity (28). Furthermore, the kidney and brain share similar microvasculature and vaso-regulation, which makes them susceptible to microvascular dysfunction (29). These findings indicate that renal function may mirror cerebral autoregulation function (30). Collectively, we argue that impaired renal function may weaken the treatment effect of DAPT through impairing cerebral autoregulation, remodeling the cerebral vasculature, and reducing cerebral blood flow (CBF) (11). Similar to this phenomenon, previous studies have shown that patients with renal impairment did not benefit from intravenous thrombolysis treatment (31). One possible explanation could be that patients with renal insufficiency have reduced fibrinolysis rates, which may be due to less clot permeability and higher clot rigidity (32, 33). In addition, potential mechanisms by which renal impairment affects outcome and complications of intravenous thrombolysis may involve renal anemia, oxidative stress, inflammation, endothelial dysfunction, and paradoxical effects on hemostatic abnormalities, including increased risk of both bleeding and thrombosis (34, 35).
The major strength of this study was the first report to investigate the effect of renal function on the efficacy and safety of DAPT vs. alteplase based on a multicenter, randomized, open-label, blinded end-point assessment, noninferiority study. However, we admitted several limitations. The main limitation was the sample imbalance between two groups, which may weaken the statistical power as well as the validity of the findings. For example, moderate to severe impairment group only has 39 patients (6.3%). Second, only Chinese individuals were enrolled in this study, which may affect the generalizability of this finding given the differences in co-morbid factors and stroke etiology compared with other populations. Third, high rates of the primary outcome due to mild neurological deficit may have created a ceiling effect that limited the opportunity for either agent of DAPT or alteplase to show superiority to the other. These limitations would affect the generalizability of this finding. Finally, this finding should be interpreted with caution due to the nature of the secondary analysis.
In conclusion, among patients with normal renal function, DAPT was associated with a numerically higher, but not statistically significant, rate of excellent functional outcome at 90 days in patients with minor nondisabling acute ischemic stroke presenting within 4.5 h of symptom onset, compared with alteplase.
The reference list from the paper itself. Each links out to its DOI / PubMed record.
- 1Khatri P Kleindorfer DO Devlin T Sawyer RN Jr Starr M Mejilla J. Effect of alteplase vs aspirin on functional outcome for patients with acute ischemic stroke and minor nondisabling neurologic deficits: the PRISMS randomized clinical trial. JAMA. (2018) 320:156–66. doi: 10.1001/jama.2018.8496, PMID: 29998337 PMC 6583516 · doi ↗ · pubmed ↗
- 2Wang Y Wang Y Zhao X Liu L Wang D Wang C. CHANCE investigators. Clopidogrel with aspirin in acute minor stroke or transient ischemic attack. N Engl J Med. (2013) 369:11–9. doi: 10.1056/NEJ Moa 1215340, PMID: 23803136 · doi ↗ · pubmed ↗
- 3Johnston SC Easton JD Farrant M Barsan W Conwit RA Elm JJ. Clopidogrel and aspirin in acute ischemic stroke and high-risk TIA. N Engl J Med. (2018) 379:215–25. doi: 10.1056/NEJ Moa 1800410, PMID: 29766750 PMC 6193486 · doi ↗ · pubmed ↗
- 4Chen HS Cui Y Zhou ZH Zhang H Wang LX Wang WZ. Dual antiplatelet therapy vs Alteplase for patients with minor nondisabling acute ischemic stroke: the ARAMIS randomized clinical trial. JAMA. (2023) 329:2135–44. doi: 10.1001/jama.2023.7827, PMID: 37367978 PMC 10300686 · doi ↗ · pubmed ↗
- 5Ovbiagele B Schwamm LH Smith EE Grau-Sepulveda MV Saver JL Bhatt DL. Patterns of care quality and prognosis among hospitalized ischemic stroke patients with chronic kidney disease. J Am Heart Assoc. (2014) 3:e 000905. doi: 10.1161/JAHA.114.000905, PMID: 24904017 PMC 4309090 · doi ↗ · pubmed ↗
- 6Masson P Webster A Hong M Turner R Lindley RI Craig JC. Chronic kidney disease and the risk of stroke: a systematic review and meta-analysis. Nephrol Dial Transplant. (2015) 30:1162–9. doi: 10.1093/ndt/gfv 00925681099 · doi ↗ · pubmed ↗
- 7Ovbiagele B Sanossian N Liebeskind DS Kim D Ali LK Pineda S. Indices of kidney dysfunction and discharge outcomes in hospitalized stroke patients without known renal disease. Cerebrovasc Dis. (2009) 28:582–8. doi: 10.1159/000247602, PMID: 19844098 · doi ↗ · pubmed ↗
- 8Kumai Y Kamouchi M Hata J Ago T Kitayama J Nakane H. FSR investigators. Proteinuria and clinical outcomes after ischemic stroke. Neurology. (2012) 78:1909–15. doi: 10.1212/WNL.0b 013e 318259 e 110, PMID: 22592359 · doi ↗ · pubmed ↗