Publisher Correction: Evaluating climate-related financial policies’ impact on decarbonization with machine learning methods
Paola D’Orazio, Anh-Duy Pham

Abstract
Click any figure to enlarge with its caption.
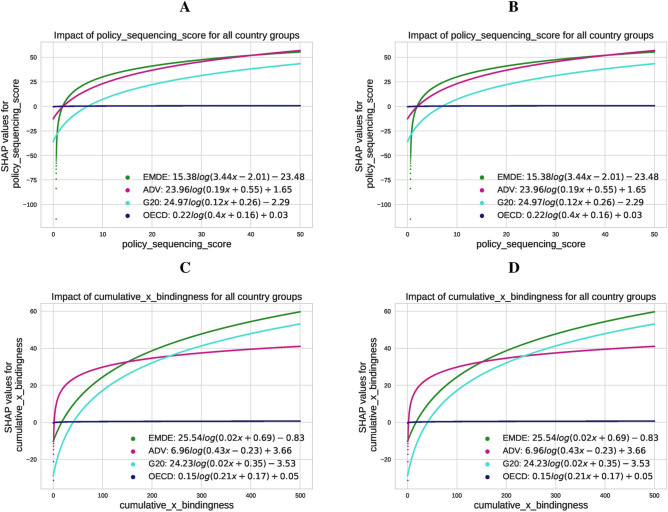 Figure 7
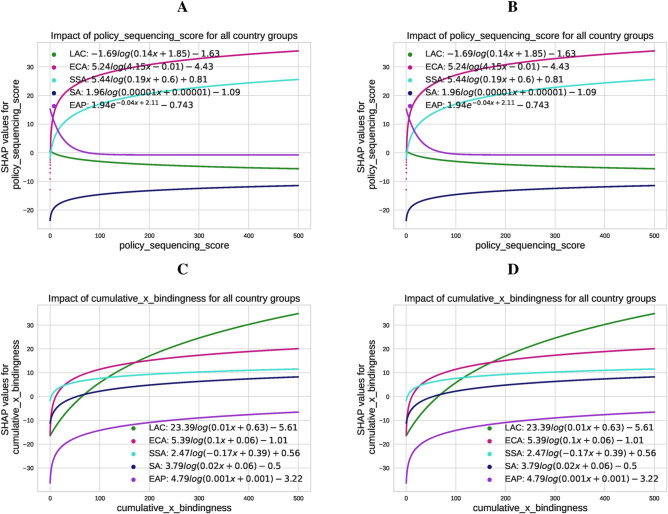 Figure 8
Peer Reviews
No public reviews on file for this paper yet. If you reviewed it on a platform where reviews are public (OpenReview, ICLR, NeurIPS, ICML), you can paste yours below so the community can read it here.
Videos
No videos yet. Explain this paper in a talk, walkthrough, or lecture? Add one.
Taxonomy
TopicsEnergy, Environment, Economic Growth
Correction to: Scientific Reports 10.1038/s41598-025-85127-7, published online 11 January 2025
The original version of this Article contained errors in Fig. 7 and Fig. 8, where panels A and C in both figures were duplications of panels B and D.
The original Fig. 7 and Fig. 8 and accompanying legends appear below.Fig. 7. Fitted SHAP values: impact of the policy sequencing score and bindingness-weighted adoption on \documentclass[12pt]{minimal} \usepackage{amsmath} \usepackage{wasysym} \usepackage{amsfonts} \usepackage{amssymb} \usepackage{amsbsy} \usepackage{mathrsfs} \usepackage{upgreek} \setlength{\oddsidemargin}{-69pt} \begin{document}$${\text{CO}}_{2}$$\end{document} emissions (Panels A and C) and renewable energy production (Panels B and D) across country groups (EMDE, ADV, G20, OECD). The results highlight differing trends based on structural, institutional, and economic contexts, with notable contrasts between EMDEs and advanced economies.Fig. 8. Fitted SHAP values illustrating the impact of the policy sequencing score and the bindingness-weighted adoption on \documentclass[12pt]{minimal} \usepackage{amsmath} \usepackage{wasysym} \usepackage{amsfonts} \usepackage{amssymb} \usepackage{amsbsy} \usepackage{mathrsfs} \usepackage{upgreek} \setlength{\oddsidemargin}{-69pt} \begin{document}$${\text{CO}}_{2}$$\end{document} emissions and renewable energy production across different country groups. Panel (A) displays the SHAP values for the effect of the PSS score on \documentclass[12pt]{minimal} \usepackage{amsmath} \usepackage{wasysym} \usepackage{amsfonts} \usepackage{amssymb} \usepackage{amsbsy} \usepackage{mathrsfs} \usepackage{upgreek} \setlength{\oddsidemargin}{-69pt} \begin{document}$${\text{CO}}_{2}$$\end{document} emissions for regions: Latin America and the Caribbean (LAC), Europe and Central Asia (ECA), Sub-Saharan Africa (SSA), South Asia (SA), and East Asia and the Pacific (EAP). Panel (B) shows the SHAP values for the PSS score’s impact on renewable energy production for the same regions. Panels C and D depict the SHAP values for the effect of cumulative bindingness-weighted policy adoption on \documentclass[12pt]{minimal} \usepackage{amsmath} \usepackage{wasysym} \usepackage{amsfonts} \usepackage{amssymb} \usepackage{amsbsy} \usepackage{mathrsfs} \usepackage{upgreek} \setlength{\oddsidemargin}{-69pt} \begin{document}$${\text{CO}}_{2}$$\end{document} emissions (Panel C) and renewable energy production (Panel D) across these regions. The fitted SHAP values are calculated using logarithmic transformations, capturing region-specific variations in the influence of policy adoption and sequencing.
The original Article has been corrected.