Spontaneous Cell Detachment from Temperature Gradients: Getting the Method Ready for Antimicrobial Drug Testing at Cell Culture Level
Csongor Tibor Urbán, Soroush Bakhshi Sichani, Gabriela Ueda Modaffore, Christ Glorieux, Jonas Gruber, Derick Yongabi, Minne Paul Lettinga, Patrick Wagner

TL;DR
This paper explores how temperature gradients cause cells to detach, showing it can be used to test the effects of antimicrobial drugs on yeast cultures.
Contribution
The study introduces a method using temperature gradients and cell detachment to evaluate antimicrobial drug effects at the cell culture level.
Findings
The dwell time td is influenced by chip temperature, temperature gradient strength, and cell count.
The method successfully detects the impact of antibiotics and antiseptics on yeast cultures.
Reference assays confirm the validity of the spontaneous-detachment method for drug testing.
Abstract
Spontaneous cell detachment describes an effect in which eukaryotic cells first sediment onto a heated chip and then detach from it spontaneously and collectively after a sharply defined dwell time td. This behavior is triggered by the temperature gradient between the chip and the colder supernatant liquid. Notably, td allows distinguishing between different yeast strains and cancer-cell lines. At the same time, it also varies in the presence of nutrients and cytotoxins, suggesting an added value of this method for pharmacological studies. In the present work, we study the role of fluid convection on the detachment of yeast cells experimentally and by simulations using a sample compartment with a variable aspect ratio. Hereby, we found that the absolute chip temperature, the strength of the temperature gradient and the number of cells inside the sample compartment all affect the dwell…
Genes, proteins, chemicals, diseases, species, mutations and cell lines named across the full text — each resolved to its canonical identifier and authoritative record.
Click any figure to enlarge with its caption.
 Figure 1
 Figure 2
 Figure 3
 Figure 4
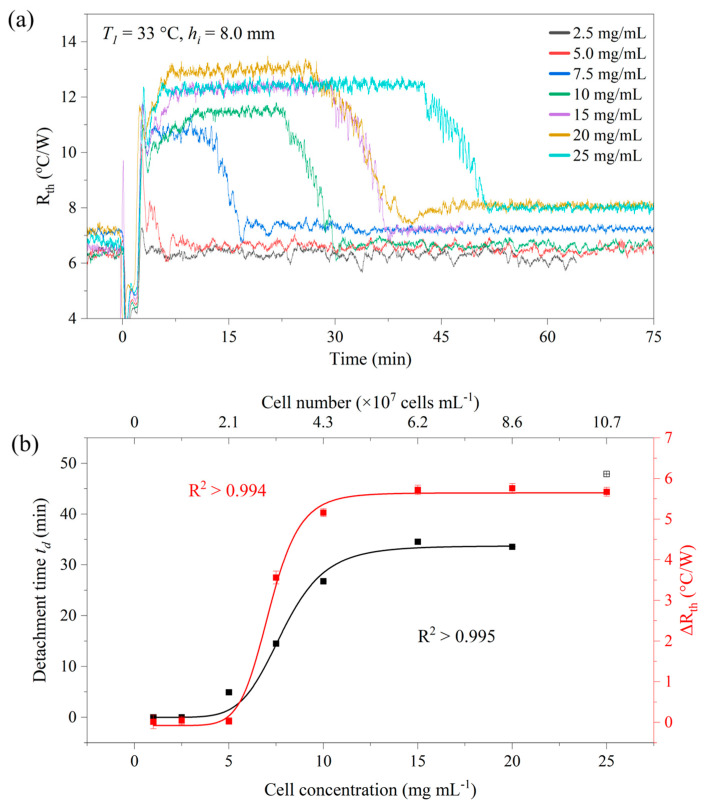 Figure 5
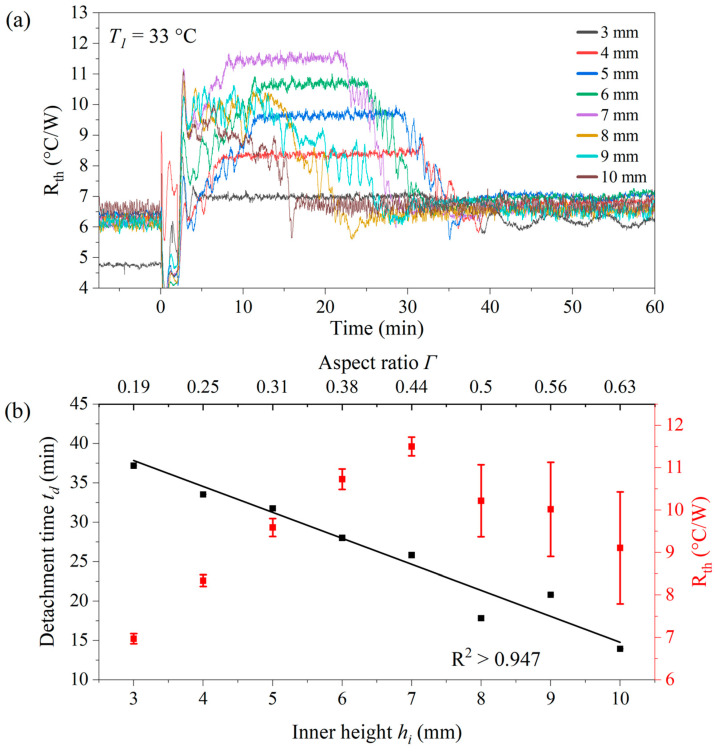 Figure 6
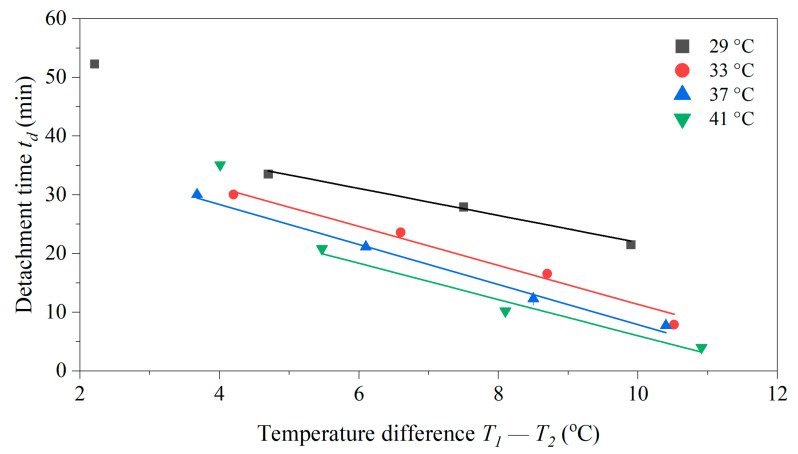 Figure 7
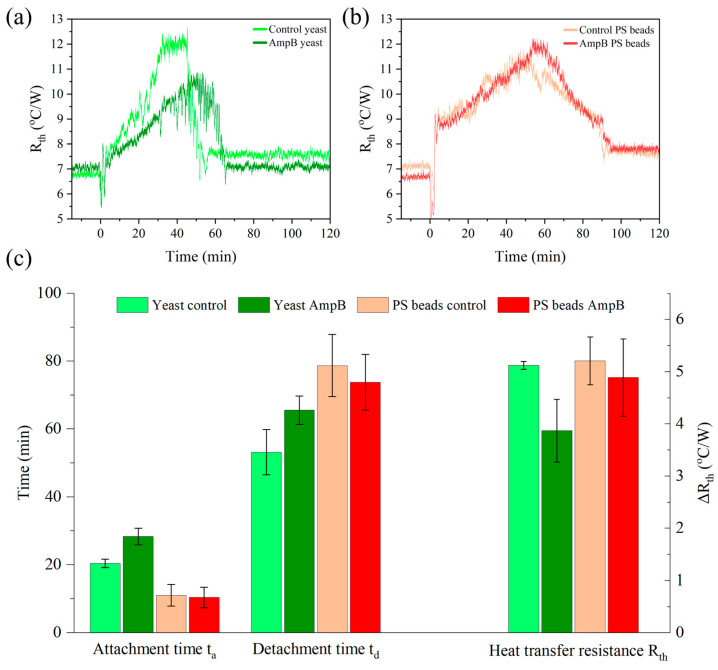 Figure 8
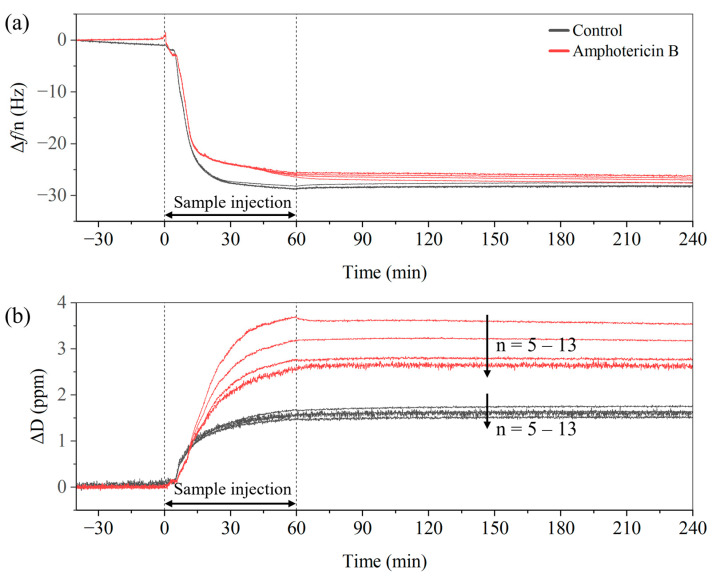 Figure 9
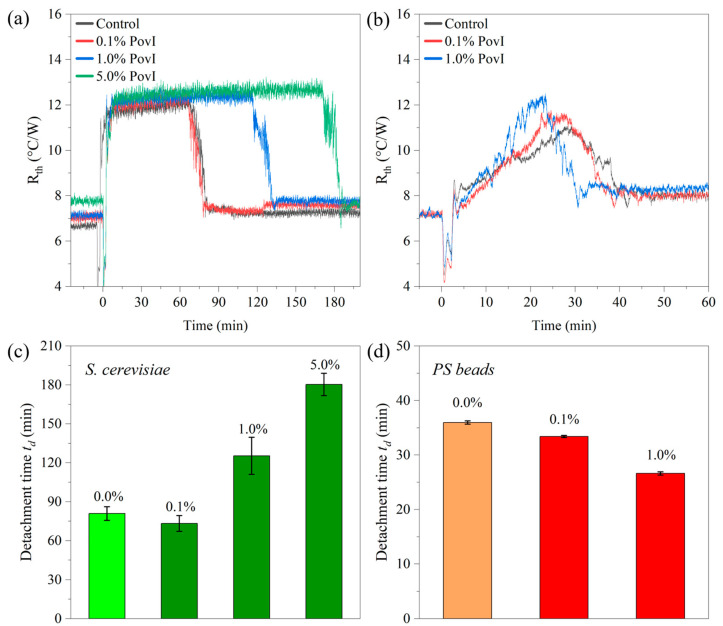 Figure 10
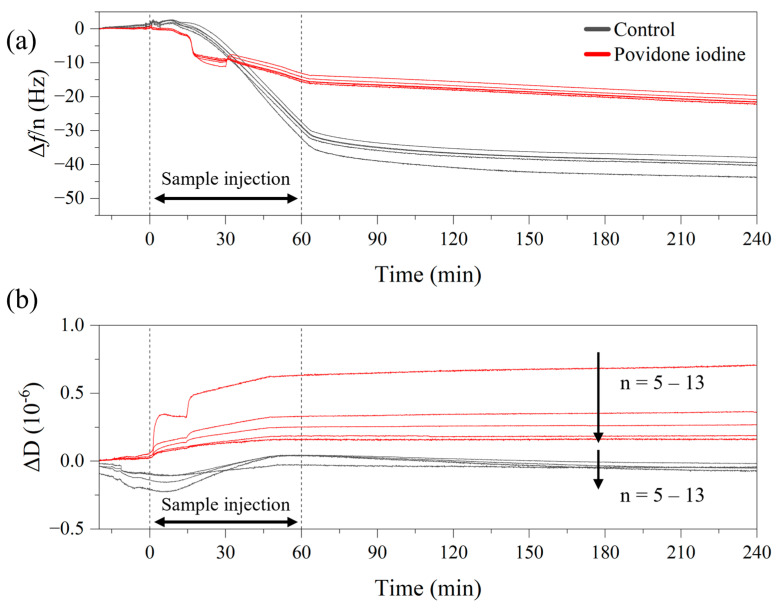 Figure 11
- —Industrial Research Funds IOF of KU Leuven
- —Research Foundation Flanders FWO
Peer Reviews
No public reviews on file for this paper yet. If you reviewed it on a platform where reviews are public (OpenReview, ICLR, NeurIPS, ICML), you can paste yours below so the community can read it here.
Videos
No videos yet. Explain this paper in a talk, walkthrough, or lecture? Add one.
Taxonomy
TopicsMicrofluidic and Bio-sensing Technologies · Microfluidic and Capillary Electrophoresis Applications · 3D Printing in Biomedical Research
1. Introduction
Bio and chemosensors detect a wide variety of targets, from small molecules to whole cells. They typically combine a receptor element with a transducer to obtain quantitative signals to indicate the concentration of the target elements within a sample. Many of these transducers rely on optical, electronic, electrochemical and microgravimetric sensing principles. Comprehensive review articles can be found in Refs. [1,2,3,4]. The present work will address a thermal transducer known as the heat-transfer method (HTM). This method measures the interfacial thermal resistance (ITR) between a solid chip, often functionalized with target-selective receptors, and the liquid sample. Although ITR is easy to measure, ab initio calculations are complex, and most numerical results are derived from molecular dynamics simulations [5]. HTM was introduced in 2012 in the context of DNA mutation analysis [6]. Since then, numerous applications have been developed, including small-molecule detection of PFAS compounds in water and soil, which is a recent example [7]. HTM enables the detection of bacteria and human cells in complex samples [8,9,10,11] and can also identify Noro and SARS-CoV-2 virus particles in bodily fluid samples by integrating the HTM readout with suitable receptors [12,13]. An overview of all applications utilizing HTM can be found in Ref. [14]. The technique can also measure ITR with chips without a receptor coating, allowing it to probe ITR changes when a cell layer is present at the interface between the chip and the supernatant.
The spontaneous cell-detachment effect, first reported by Yongabi et al. [15], describes a collective phenomenon observed in eukaryotic cells, including yeast and cancer cells. The cells initially settle onto a heated chip, and after a specific dwell time, they detach collectively with a characteristic detachment time t_d_. This effect is thermally driven and differs from cell detachment in adherent cancer-cell lines and enzymatic cell detachment [16,17]. Depending on the chip temperature and the cell type, typical t_d_ values range between 10 min and 2 h. Importantly, detachment occurs without external triggers and t_d_ is sharply defined. The effect is highly reproducible with minimal variability [15,18]. Although the effect can be probed with multiple transducers, measuring the thermal resistance R_th_ between the chip and the supernatant liquid provides high signal-to-noise ratios. Impedance spectroscopy and microgravimetry using a quartz–crystal microbalance are also viable options, though they offer a lower signal-to-noise ratio [18]. According to live-cell imaging with confocal fluorescence microscopy on HeLa cells, the separation between the chip and the cells is below 100 nm after detachment [15]. However, this distance is large enough to allow cells to move freely via Brownian motion across the chip surface, significantly reducing the cell–chip interaction.
Multiple factors may contribute to the detachment of cells from the chip surface. Thermophoretic forces naturally drive particles and cells from warmer to cooler regions [19,20,21]. In addition, cell membrane protrusions, known as blebs, can form on the heated side of the cells, a process involving a reorganization of the cytoskeleton [22]. Bernoulli forces resulting from convective fluid movement are a third option, but previous modeling data suggest that the resulting forces are possibly too weak to lift sedimented cells [15]. A fourth possibility is an increase of the Archimedes forces due to the thermal expansion of the cells upon contact with the chip. However, the expansion coefficients reported in the literature suggest this effect is minimal [23]. Cell proliferation can be ruled out, as detachment occurs long before proliferation can take place. Additionally, no signs of proliferation were observed in live-cell imaging [15]. In summary, the most plausible explanation to date involves a combination of membrane blebs, thermophoretic forces and convection. However, the reason why this effect occurs only after a certain detachment time t_d_ remains a significant unresolved question.
Besides the fundamental issue of the driving mechanisms, the current knowledge on the effect consists mainly of empirical observations [15,18]. Together, they indicate that the method can be used for cell identification, checking their metabolic status and probing their response to cytotoxic compounds. Hence, one may think of applications in drug-efficacy studies and antimicrobial-resistance testing. A review of existing techniques can be found in Ref. [24]. The following is known in summary: (i) The dwell time t_d_ decreases with increasing chip temperature T1 according to an exponential scaling law. (ii) For a given value of T1, t_d_ depends on the cell type, as observed for cancer-cell lines and different yeast strains. Yeast cells with functional flocculation genes detach faster than yeast with altered FLO genes. (iii) Nutrients accelerate detachment in a concentration-dependent way, suggesting a role of metabolic processes in the effect. (iv) Blebbistatin and DMSO (dimethyl sulfoxide) cause a concentration-dependent lengthening of t_d_. Blebbistatin blocks the activity of the motor protein myosin and prevents bleb formation, while DMSO increases cell membrane porosity and exerts oxidative stress at higher doses [25,26]. (v) At low chip temperatures (e.g., 25 °C) and in the presence of nutrients, yeast cells show sustained oscillations of the R_th_ signal with a defined periodicity that resembles glycolytic oscillations [27].
When comparing the data in Refs. [15,18], it is evident that, for the same cell type (S. cerevisiae) and chip temperature, dwell times t_d_ can vary. The difference in t_d_ occurs when probing the effect in sample compartments with differing dimensions as quantified by the aspect ratio Γ (height-to-diameter ratio), a key parameter in microfluidics [28]. Adjusting the height affects the temperature gradient and internal temperature distribution for a given chip temperature. Since Γ determines whether heat transport is governed by conduction or convection, it is crucial to reassess whether convection is the physical driver of cell detachment. Additionally, it may facilitate the exchange of intercellular signaling molecules [29,30]. This work aims to define the most sensitive geometry to detect this effect. To achieve this, we will use a sample compartment with an adjustable inner height covering a broad range of Γ. Experimental and computational results will demonstrate that convection is present in all cases where cell detachment occurs. The detachment time t_d_ for yeast cells will be studied as a function of temperature, temperature gradient, cell concentration and the aspect ratio Γ. Finally, we will show that with the optimized device settings, it is straightforward to employ thermal detachment as a facile technique to study the efficacy of antimicrobial compounds. One antimicrobial used is Amphotericin B, an established drug for treating fungal infections (e.g., Candida albicans and S. cerevisiae). This compound binds to ergosterol in the yeast cell membrane [31,32,33,34]. The second drug is povidone-iodine, an antiseptic of which iodine ions can easily permeate cell walls and membranes, leading to the oxidation of proteins, nucleic acids and fatty acids [35,36,37].
2. Materials and Methods
2.1. HTM Sensing Device with a Variable Aspect Ratio
The device is depicted in Figure 1a as a schematic cross-section, and Figure 1b shows a photographic image. T1 is the chip temperature, T2 is the temperature inside the sample compartment and the thermal resistance is calculated as R_th_ = (T1 − T2) P^−1^, where P denotes the applied heating power [6,14]. The sample compartment, made of PEEK (polyether ether ketone), has a cylindrical shape with a 16 mm diameter. It is on top of a round sensor chip made of polished stainless steel without further modifications (alloy AISI 304, 22 mm diameter, 1.0 mm thickness, Testas NV, Wommelgem, Belgium). The sensor chip was heated at its underside to a predefined temperature T1 using a power resistor (Farnell MPR-20, 47 Ω, Farnell, Machelen, Belgium). Combined with a copper disk (23.0 mm diameter, 7.0 mm height), this enabled a homogeneous temperature distribution. The temperature T1 inside the copper disk was measured with an embedded thermocouple (type K, 0.5 mm diameter, TC Direct, Nederweert, The Netherlands). The chip was pressed mechanically onto the copper disk with a thin interlayer of heat-conducting silver paint to minimize the roughness effects. The inner height h_i_ of the sample compartment can be regulated between 2.0 and 16.0 mm, corresponding to aspect ratios between 0.125 and 1.0. This was enabled by a piston-like top lid, sealed with O-rings, which can be moved up and down with screw S1 (AISI 304, pitch of 1.00 mm per rotation). Screw S2, with the same alloy and pitch, moves relative to screw S1 and features a channel through which a second thermocouple runs down to the sample compartment. This way, the tip with the thermocouple junction can be positioned at any point along the central axis of the compartment. The thermocouple channel was sealed from below with an additional O-ring.
The sample inlet and outlet have openings of 1.5 mm^2^, and their central part was placed 2.5 mm above the chip surface in all measurements to keep the sedimentation time short. The inlet and outlet are integrated into rotatable PEEK cylinders (embedded in the upper PEEK body) to freely regulate their height above the chip surface between 0.5 mm and 6 mm. The lower PEEK body, which houses the copper disk and power resistor, minimizes heat loss in the lateral directions, while downward heat loss was further reduced by a press-fit Teflon disk (20.0 mm thickness in its central part and 10 cm diameter). All components are chemically resilient and can be sterilized.
HTM measurements with this device were performed using a custom-built module designed to regulate and monitor temperatures via a closed-loop feedback system [38]. This device functions as a dual-channel voltage source, providing up to 50 W per channel, and serves both as the primary power supply and temperature control unit. A LabVIEW-based PID controller was employed to maintain the T1 chip temperatures within the range of 25 to 42 °C. The chosen PID parameters were 1–6–0 in agreement with Ref. [38].
2.2. Heat and Mass Transfer Simulations with COMSOL
To understand the role of temperature distribution and convective flow profiles inside the sample compartment in the detachment effect, the system was studied with finite element modeling with COMSOL Multiphysics software Version 6.2 (COMSOL Inc., Burlington, VT, USA), see Ref. [39] for the weblink. To simplify the 3-dimensional device into a 2-dimensional geometry, a 2D-axisymmetric COMSOL model was built, as shown in Figure S1 of the Supporting Information S1. This made the simulations computationally leaner without compromising accuracy. The simulated materials, including their thermophysical properties, are listed in Table 1.
The temperature of the copper block was set to a defined temperature of T1, and it was covered with a stainless-steel chip. The flow cell height was parametrically adjusted by varying the aspect ratio with the inner height from 2.0 to 8.0 mm while keeping the base radius at 8.0 mm. Fourier’s law, see Equation (1), was used to model the heat transport in domains 1–6, see Supporting Information S1, as follows:
where κ represents the thermal conductivity (W m^−1^ K^−1^) and T represents temperature (K). A density gradient will form in the heated water domain due to a temperature gradient and a gravitational body force. This density gradient, calculated by the following Equation (2), will contribute to heat transport across the geometry, which can be calculated by the Rayleigh number, as described in Ref. [41]:
where g represents the gravitational constant (N kg^−1^), β the thermal expansion coefficient (K^−1^), T1 − T2 the temperature difference between the bottom and top plate (K), L the distance between these two plates (m), α the thermal diffusivity (m^2^ s^−1^), and v representing the fluid’s kinematic viscosity (Pa s). Laminar flow modeling is based on the Navier-Stokes equations that consider the energy balance, the momentum balance and the mass balance of the sample domain, see Equations (3)–(5), as follows:
where ρ represents the density (kg m^−3^), C_p_ the isobaric heat capacitance (J kg^−1^ K^−1^), u the velocity field (m s^−1^) and I the unity tensor. These equations were coupled via the non-isothermal laminar flow interface, selected for modeling because the temperature difference between the bottom and top plate (at ambient temperature T_a_ = 20 °C) stays within 13 °C.
2.3. Spontaneous Cell-Detachment Measurements with S. cerevisiae
For the initial characterization of the device, pure Milli-Q water was used to exclude any salt deposits on the stainless-steel chip. For measurements with yeast cells, 1 × PBS buffer was used containing 137 mM NaCl, 2.7 mM KCl, and 10 mM of phosphates, resulting in pH 7.4 at room temperature. One PBS tablet (Sigma Aldrich, St. Louis, MO, USA) was dissolved per 200 mL of Milli-Q water. S. cerevisiae was obtained as dried yeast from Dr. Oetker (Bielefeld, Germany). Commercially available yeast was chosen for its low cost, ease of cultivation and consistent quality, making it suitable for method development. The yeast pellets were resuspended in 1 × PBS buffer by vortexing for 10 s. OD600 measurements (Ultrospec 2100 pro, Biochrom Ltd., St. Albans, UK) confirmed that the expected concentrations, calculated from the dissolved cell mass, were consistent with the observed data. In this article, all concentrations are expressed in mg mL^−1^ ranging from 1 mg mL^−1^ up to 25 mg mL^−1^ (4.28 × 10^6^ cells to 1.07 × 10^8^ cells per mL). Measurements were verified by manual particle counting using a Neubauer-improved counting chamber (Paul Marienfeld GmbH and Co. KG, Lauda-Königshofen, Germany). To inject the dissolved yeast samples into the HTM sensor setup, an automated syringe pump (ProSense NE 500, Oosterhout, The Netherlands) was set to a flow rate of 5.0 mL min^−1^ for 2.0 min. The injected volume of 10 mL exceeds the inner volume of the sample compartment by a factor of 3.6 (2.81 mL when the top lid is at the highest used position, h_i_ = 14 mm). During sedimentation, dwelling and detachment, no flow was imposed inside the sample compartment. Between each measurement, the sensor device was thoroughly cleaned with 70% ethanol and dried with nitrogen gas. To improve the accuracy, all measurements were performed with the sensor device and the flow pump enclosed in a temperature-controlled incubator (model R-TH-50, Labtech Instrument Co., Ltd., Dongguan, China). The ambient temperature T_a_ inside the incubator was set to 20.0 °C unless mentioned otherwise.
2.4. Drug Exposure Measurements with Amphotericin B and Povidone-Iodine
For detachment measurements in the presence of an antimicrobial, first Amphotericin B (AmpB) was used (Product code A2942, Sigma-Aldrich, St. Louis, MO, USA) dissolved in Milli-Q water. The samples were prepared with a volume of 10 mL at the concentrations of 15 mg yeast mL^−1^ and 10 µM AmpB, as well as without AmpB as a negative control. The minimum inhibitory concentration (MIC) of AmpB for S. cerevisiae is in the order of 0.03 to 1.0 mg L^−1^, and 10 µM corresponds to 9.24 mg L^−1^ [42]. The yeast suspensions (in 5.0 mL 1 × PBS) and the AmpB solutions (in 5.0 mL Milli-Q) were prepared separately. After mixing, they were incubated at 30 °C for 48 h to let AmpB interact with the cells. The detachment measurements were started by injecting the samples into the HTM device. These measurements were repeated with polystyrene (PS) microbeads (5 µm diameter, density 1.05 g cm^−3^, Merck, Darmstadt, Germany), which are similar in size to yeast but are assumed to be insensitive to AmpB. Finally, quartz–crystal microbalance measurements were carried out on yeast cells (QCM-D E4, Biolin Scientific, Gothenburg, Sweden) to assess whether AmpB affects their viscoelastic properties.
For testing the impact of the antiseptic drug povidone-iodine (PovI), a complex of polyvinylpyrrolidone with I_3_^−^ ions (iso-Betadine^®^ Dermicum 10%, Viatris Health-care, Hoeilaert, Belgium) was used, which contains 10 g of the PovI complex per 100 mL. Yeast samples of 10 mg mL^−1^ (total volume of 10 mL) were prepared in 1 × PBS buffer (negative control) as well as in 1 × PBS supplemented with 1, 10 and 50% v/v iso-Betadine. Given the fact that the active compound in this commercial product was already tenfold diluted, these samples are addressed as 0.1, 1.0 and 5.0%. Before the HTM measurements, the samples were incubated for 30 min at room temperature. Longer incubation times (such as with AmpB) were unnecessary due to the fast biocidal action of PovI. These measurements were also repeated with PS microbeads instead of yeast cells and consolidated with QCM-D data.
2.5. Reference Methods
To visualize the yeast cells with and without exposure to AmpB and PovI, images were obtained at room temperature using a widefield microscope (DM 750M, Leica Microsystems, Heerbrugg, Switzerland) coupled with a CCD camera (Leica MC170 HD). For cell imaging, a 100×/0.85 NA objective was used (N Plan Epi 100×/0.85 from the same manufacturer). The corresponding data is provided in Supporting Information S3. Based on our current understanding, t_d_ of spontaneous cell detachment is directly linked to metabolic activity. Therefore, a resazurin reagent (purity > 99%, Acros Organics, Thermo Fisher Scientific, Geel, Belgium) was used to assess cell viability. Respiratory reactions in the mitochondria cause the reduction of resazurin (blue color) to resorufin (pink color). The color change serves as an indicator of viable, metabolically active cells. Resazurin solutions (15 µM) were prepared in 1 × PBS buffer (pH 7.4). Cell suspensions were incubated at 30 °C for 30 min. Treated cells were incubated in 10 µM AmpB or 5% PovI, respectively. After incubation, cells were centrifuged at 2000× g for 5 min at 4 °C. Centrifugation was performed three times, and cells were resuspended in 1 × PBS buffer. Finally, the cell suspensions were incubated with the resazurin solution (10% v/v) for 6 h. Cell viability assay can be used to confirm that cells are metabolically active after the detachment process (see Supporting Information S4). Since buoyancy and surface interactions could influence detachment, the density and contact angle of all fluids and substrates were measured using a density meter (Densito, Mettler Toledo N.V., Zaventem, Belgium) and a contact angle device (DataPhysics, OCA 25, Filderstadt, Germany). The corresponding data can be found in Supporting Information S5.
3. Results
3.1. Thermal Resistance of the Device for Different Aspect Ratios
Prior to biological measurements with yeast cells, the device was characterized by measuring its thermal resistance signal according to R_th_ = (T1 − T2)/P using Milli-Q water. For these experiments, T1 was set to 33 °C and T_a_ to 20 °C. R_th_ entails the ITR between the chip and the liquid and the thermal resistance of the liquid column. Note that the heating power P does not completely pass through the chip–liquid interface, but a major fraction is dissipated into the environment. Details are discussed in Section 3.1, where the thermal conductivity of water was determined in comparison to the literature data. Figure 2 shows the corresponding data for inner heights from 2.0 to 14.0 mm with the tip of the T2 thermocouple at the top position (1 mm underneath the top lid) and the middle position at h_i_/2.
The nearly linear increase of R_th_ with increasing h_i_ for the top position relates to the increasing thermal resistance of the taller water column. For h_i_ = 2.0 mm, the data points have identical values as expected, while for larger inner heights, such as h_i_ = 14.0 mm, the middle position was expected to yield half of the R_th_ value for the top position. In good approximation, R_th_ values of 3.55 +/− 0.21 °C/W (middle) versus 7.38 +/− 0.62 °C/W were obtained when choosing h_i_ = 14.0 mm. As seen in Figure 2, there was a deviation from the linearity of R_th_ when looking at intermediate h_i_ values. This deviation can be understood when the convective motion of the fluid is considered. Therefore, the internal temperature and velocity profiles of the sample compartment were studied with the COMSOL heat and mass transfer module. The data for the given condition (T1 = 33 °C, T_a_ = 20 °C) and h_i_ = 3.0 mm, respectively, 8.0 mm, are shown in Figure 3. Other settings of T1 and h_i_ utilized within this article were modeled as well, and the corresponding data are provided in Supporting Information S1. In addition, the Rayleigh numbers were calculated for each condition (the background is described in Ref. [41]). From this, it was concluded that convection was always in the laminar regime.
To assess the influence of convection on the obtained R_th_ values, the thermal conductivity of water was measured as the reference material. The settings were T1 = 33 °C and h_i_ = 10.0 mm. We used an algorithm developed by Stilman et al. to determine the heating power P_d_ that dissipates to the ambient without passing the interface between the chip and the sample compartment [40]. P_d_ was hereby derived from measuring P and T2 with an empty air-filled sample compartment, and the thermal conductivity of the air column (κair = 0.0262 W m^−1^ K^−1^, see Table 1) was taken into account. Then, the measurement was repeated after filling the compartment with Milli-Q water. Taking the dimensions of the water column into account, a nominal κ value of 1.091 W m^−1^ K^−1^ was obtained. This value exceeds the literature value of Table 1 by a factor of two, indicating that convection strongly enhances heat transfer. For a systematic study on this effect, including different aspect ratios and vessel shapes, we refer to recent work by Hartmann and co-authors [43].
The contribution of convection to heat transfer can be effectively suppressed by inverting the device, ensuring that the heated chip surface faces downward. The corresponding data for h_i_ = 10.0 mm and chip temperatures T1 from 25 °C up to 55 °C are provided in Supporting Information S2. Following the algorithm of Ref. [40], T2 and P were measured with an empty sample compartment to determine again the dissipated power P_d_. For T1 = 35 °C, κH20 = 0.652 W m^−1^ K^−1^, which is in close agreement with its literature value, see Table 1. For 1 × PBS, the same analysis yielded κ1×PBS = 0.523 W m^−1^ K^−1^. Thermal conductivity values of 1 × PBS are only available in its frozen state [44], but a decreased thermal conductivity, compared to H_2_O, is plausible given the formation of hydration shells around the ions that decrease the mobility of H_2_O molecules in diffusion [45].
3.2. Temperature-Dependence of the Detachment Time of Yeast Cells
In the next set of measurements, a constant concentration of yeast cells was used (c_yeast_ = 20 mg mL^−1^) in 1 × PBS buffer and with the ambient temperature set to T_a_ = 20.0 °C. Figure 4a shows the R_th_ data as a function of time for h_i_ = 3.0 mm, and the corresponding data for h_i_ = 8.0 mm are included in Figure 4b. The chip temperatures T1 range from 25 °C up to 40 °C and the start of the sample injection was set as t = 0. While detachment can be observed for all T1 values in the case of h_i_ = 8.0 mm, there was no identifiable detachment effect for h_i_ = 3.0 mm when T1 was below 30 °C. This indicated that convective movement of the fluid media was essential to stimulate the effect. According to computational modeling, when using h_i_ = 8.0 mm, maximum fluid velocities v_max_ were between 1.66 mm s^−1^ (T1 = 25 °C) and 5.02 mm s^−1^ (T1 = 40 °C). In the case of h_i_ = 3.0 mm, the v_max_ values range between 5.41 × 10^−3^ mm s^−1^ and 0.57 mm s^−1^ for the same temperature regime. For an inner height of 3.0 mm, the lowest temperature at which detachment occurred was 31 °C, corresponding to v_max_ = 0.341 mm s^−1^. This correlates to a maximum shear stress of 9.9 × 10^−4^ Pa. Notably, after detachment, R_th_ does not fully recover to its baseline value from before the cells were introduced into the compartment. It can be inferred that the presence of the remaining cells continues to contribute to R_th_. At lower cell concentrations, R_th_ after detachment remains indistinguishable from its baseline value [15,18]. Figure 4c shows the detachment times t_d_ for both inner heights as a function of T1. While the data for h_i_ = 3.0 mm span only a narrow temperature range, the empirical fit function Equation (6), adapted from [15,18], accurately represents the data for h_i_ = 8.0 mm, R^2^ > 0.996, as follows:
where T1 is given in °C, t0 is the horizontal asymptote, A is the amplitude parameter and theta is the scaling factor. The numerical values of the fit parameters are t0 = 22.0 +/− 2.3 min, A = 129.5 +/− 4.0 min and θ = 4.2 +/− 0.4 °C. These values were calculated using the Levenberg–Marquardt algorithm, implemented within the Origin software package, 2023b [46]. The absolute values of the parameters are in the same order as in the previous work. While Bakshi Sichani et al. have found a strain dependence of θ between different yeast strains, θ appears to be influenced by the exact geometry of the sample compartment [18].
Given the objective of this work to develop a technology for drug efficacy testing, the goal is to establish a setting where the detachment time can be derived from the measured data. Therefore, Section 3.5 focuses on an inner height of h_i_ = 8.0 mm, where detachment was observed at all chip temperatures. Furthermore, the assay time should be short, indicating the need for higher chip temperatures. At T1 = 37 and 40 °C, detachment had already occurred before the sedimentation was completed, see Figure 4c. In conclusion, T1 = 30 or 33 °C represents a good compromise between minimizing assay times (t_d_ < 60 min) and maintaining a highly resolved R_th_ plateau.
3.3. Detachment Effect with Different Cell Concentrations
First, a standard setting was used with T1 = 33.0 °C and h_i_ = 8.0 mm (T_a_ = 20.0 °C). Detachment measurements were performed with cell concentrations c_yeast_ ranging from 2.5 mg mL^−1^ up to 25 mg mL^−1^. This corresponded to absolute cell numbers between 1.07 × 10^7^ and 1.07 × 10^8^ when taking the volume of the sample compartment into account. The raw R_th_ data and the corresponding detachment times t_d_ are shown in Figure 5a,b. The trend shows that t_d_ decreases with lower concentrations and levels off at higher concentrations. However, the situation was different at the lowest concentrations (1.0 and 2.5 mg mL^−1^). Here, no detachment was visible, indicating that detachment happens during the sample injection, resulting in t_d_ = 0 min. Between 15 and 20 mg mL^−1^, t_d_ remains effectively constant, making these concentrations advisable for the drug exposure study in Section 3.5. The expected changes in t_d_ can then be attributed to the effect of the antimicrobial without being influenced by minor uncertainties in the exact cell concentration. For the highest concentration studied, c_yeast_ = 25 mg mL^−1^, the lengthening of t_d_ was observed to approximately 50 min, indicating that the assay would take longer than required. Excluding the highest concentration, all data points in Figure 5b follow an empirical logistic fit according to Equation (7):
where t_d_ is given in minutes, c_yeast_ and c′yeast in mg mL^−1^, t_dmin_ and t_dmax_ the lower and upper horizontal asymptotes, respectively, in minutes and p a dimensionless steepness factor with the numerical values of t_dmin_ ≈ 0 min, t_dmax_ = 33.7 +/− 1.8 min, c′yeast = 7.8 +/− 0.3 mg mL^−1^ and p = 6.9 +/− 1.1. The parameters and their uncertainties were again determined using the Levenberg–Marquard algorithm, and R^2^ was 0.995.
3.4. Detachment Effect with Different Aspect Ratios
In the next series of measurements, the absolute cell number was kept constant at n = 3.4 × 10^7^ cells, corresponding to a concentration of 8 mg mL^−1^ when h_i_ = 8.0 mm. Inner heights ranging from 3.0 to 10.0 mm were selected, with corresponding concentrations decreasing from 21.33 mg mL^−1^ to 6.40 mg mL^−1^ to keep n at its predefined value. Figure 6a shows R_th_ as a function of time for the different inner heights, while the corresponding detachment times t_d_ and ΔR_th_ values (height of the plateau over the baseline) are provided in Figure 6b.
Although the decrease in t_d_ with increasing h_i_ seems counterintuitive, it is important to note that in all cases, the cells are injected into the sample compartment at a height of 2.0 mm above the chip surface, ensuring that the sedimentation time remains similar. The key difference is in the convective behavior of the fluid, and using COMSOL simulations, maximum fluid velocities ranged from v_max_ = 0.55 mm s^−1^ for h_i_ = 3.0 mm up to 3.94 mm s^−1^ in the case of h_i_ = 8.0 mm at T1 = 33 °C heating temperatures. Supporting Information S1 provides the corresponding flow patterns and v_max_ as a function of h_i_. This data further supports the idea that convection aids in spontaneous detachment. To reduce assay times, larger inner heights that enhance convection can be used. In Figure 6, at larger inner heights (>7.0 mm), the plateau of R_th_ was less clearly defined (with a larger uncertainty on ΔR_th_). However, the absolute yeast concentrations are low and below the optimum of c_yeast_ = 15–20 mg mL^−1^ identified in Figure 5 above.
3.5. Role of the Temperature Difference T1 − T2 for the Dwell Time
To investigate whether thermophoretic forces are involved in the detachment effect, measurements were performed at T1 = 29, 33, 37 and 41 °C with h_i_ = 8.0 mm and cell concentration c_yeast_ = 10.0 mg mL^−1^, see Figure 7. To control the temperature gradient, the ambient temperature provided by the incubator was set to T_a_ = 15, 20 and 25 °C. The temperature T2, measured with the thermocouple in the fluid, is then not only determined by T1 but also by T_a_. While the temperature gradient across the yeast layer was difficult to determine, the temperature difference T1 − T2 was used to indicate its magnitude. If thermophoresis was the only force at work, then t_d_ would be a unique function of T1 − T2 and all data points would align along a single curve. As shown in Figure 7, this was not observed. Although t_d_ decreases nearly linearly with an increasing temperature difference (also expected in the case of thermophoretic forces), the traces for the different chip temperatures T1 do not cross. Looking at T1 − T2 = 7 °C, t_d_ was shortest for T1 = 41 °C and longest for 29 °C. The data does not exclude thermophoretic contributions to the detachment effect, but convection and the biological effects discussed in Section 3.5 must be considered.
3.6. Detachment Effect in the Presence of the Antimicrobial Amphotericin B
To investigate whether the thermal detachment technique can assess the impact of antimicrobial drugs on microorganisms, yeast suspensions were prepared at a concentration of 15 mg mL^−1^ S. cerevisiae. A mixture of 50 vol.% 1 × PBS and 50 vol.% Milli-Q was used with and without 10 µM AmpB. All samples were incubated for 48 h at 30.0 °C under dark conditions before starting the measurement. The selected yeast concentration corresponds to the region where t_d_ was widely insensitive to c_yeast_ (see Figure 5b). The measurement parameters were T1 = 30.0 °C, T_a_ = 20.0 °C and h_i_ = 8.0 mm. These settings came with low noise and a clear plateau of the R_th_ signal, resulting in accurately defined t_d_ values. Figure 8a presents the corresponding data for R_th_ as a function of time, clearly showing that t_d_ for the negative control (53.2 ± 6.7 min) was the shortest, while t_d_ of the AmpB treated sample has increased to 65.6 ± 4.2 min. A more refined analysis shows that the lengthening of t_d_ goes along with a lengthening of the attachment time t_a_ as defined by its 50% value, and the increase of the thermal resistance ΔR_th_ was less pronounced for the AmpB-treated cells.
Furthermore, to test whether the lengthening of t_d_ was a biological effect, the experiment was repeated in the same manner, using PS beads instead of yeast cells. The concentration of the PS beads was also chosen as 15 mg mL^−1^ to work under similar conditions. The actual number of particles may differ slightly because of the larger diameter of the PS beads (5.0 µm) compared to yeast cells (3.6 µm). However, this difference was partially offset by the lower mass density of PS (1.05 g cm^−3^) relative to yeast (1.10 g cm^−3^). As seen in Figure 8b, PS also detaches, possibly due to convective shear forces and thermophoresis. However, consistently shorter attachment times t_a_ and longer detachment times t_d_ were noted compared to yeast samples. For comparison, Figure 8c shows all data as bar charts (average of three independent replicates). In contrast to yeast, there was no statistically significant difference between the beads exposed to AmpB and those not when comparing the t_a_, t_d_ and ΔR_th_ data. In conclusion, physical effects must be at work in both cases to make the cells or particles detach. Still, only yeast changes its detachment behavior in response to the antibiotic.
To benchmark the HTM-derived results on yeast against an established reference method, two specimens were studied (with and without AmpB) with the dissipation-sensitive quartz–crystal microbalance QCM-D. This technique is well established for analyzing soft-matter interface layers, including cell adhesion and detachment, and has also been used in antimicrobial resistance testing [46,47,48,49]. The samples were prepared the same way as for HTM, see Section 2.5, and the QCM-D was set to 30 °C to resemble the conditions used in the HTM measurement as closely as possible. Figure 9a shows the frequency shift delta f/n for the overtones n = 5 to 13 as a function of time; we could not obtain stable data for the overtones n = 1, 3. After the 60 min injection time at a flow rate of 0.1 mL min^−1^, no flow was applied. Samples with and without AmpB show similar values of Δf/n with a minimal spreading between the different overtones. Figure 9b shows the time-dependent dissipation signal ΔD and we note that ΔD of the AmpB-treated yeast was twice as high as for the non-treated version, irrespective of the overtone. In addition, especially for the treated yeast, there was an apparent spreading between the overtones, suggesting that the layer of the treated cells has pronounced viscoelastic properties [50]. This agrees with the observations that AmpB intercalates into the cell walls, making them less rigid. No noticeable detachment effect was observed during the 4 h measurement period using QCM-D. This was expected, as the QCM-D compartments are designed to maintain a uniform temperature distribution without convection effects.
3.7. Detachment Effect in the Presence of the Antiseptic Polyvidone Iodine
Finally, the effect of the antiseptic PovI was studied at concentrations of 0.1, 1.0 and 5.0% on the detachment behavior, including a control without the antiseptic agent. As mentioned in Section 2.5, the incubation was only for 30 min at room temperature and the measurement settings were T1 = 30 °C, c_yeast_ = 15 mg mL^−1^ and h_i_ = 8.0 mm. As seen in Figure 10a, the 1.0% dose caused the lengthening of t_d_ by 45 min while the R_th_ plateau was well defined. The plateau resembled that of intact yeast cells, see Figure 4 and Figure 5, meaning that iodine does not affect the integrity of cell walls as seen with AmpB. Repeating the measurement with PS microbeads in Figure 10b did not show the lengthening effect, instead detachment seems to accelerate. Tentatively, this can be understood by the density of the PovI solution (measured value 1.04 g mL^−1^), which was already close to the density of the PS beads (1.05 g mL^−1^). At these densities, buoyancy becomes a significant factor. For an easy comparison, Figure 10c,d provides the t_d_ data of these experiments as bar charts. In conclusion, PovI was more potent in changing the detachment behavior of yeast cells, which was attributed to its fast action mechanisms.
To demonstrate that QCM-D was also able to indicate cell damage by PovI, Figure 11a shows the frequency shift Δf/n for the control (no PovI) and for 5% v/v PovI with the QCM-D instrument at T = 30 °C and c_yeast_ = 15 mg mL^−1^. The corresponding dissipation data are provided in Figure 11b.
4. Discussion and Conclusions
The spontaneous detachment of eukaryotic cells from the interface between a solid chip and a supernatant aqueous medium under a temperature gradient is governed by several factors. These include the cell type, the cell concentration, the aspect ratio of the sample compartment and the chip temperature. We designed and studied a sample compartment with an adjustable inner height to advance the method toward a valuable tool for in vitro drug testing. In the future, it can potentially serve as an alternative to photonics-based techniques for whole-cell characterization and MIC determination in microorganisms [51,52]. The optimal aspect ratio was approximately 0.5. At lower gamma values, the detachment effect was not observable at chip temperatures below 30 °C, while high gamma values introduced noise on the thermal-resistance signal. The moment of cell detachment, t_d_, indicates the cell type under study (in case of an unknown strain). For known strains, changes in t_d_ can reveal the effects of factors such as nutrients and antimicrobial drugs.
For high-throughput screening, the assay time should be short, ideally less than 60 min, which can be achieved using sufficiently high chip temperatures. Nevertheless, small changes in t_d_ caused by low drug concentrations must be accurately measurable. Therefore, the uncertainty in determining t_d_ should be minimal, ideally below 1 min. A compromise between measurement speed and accuracy was achieved with chip temperatures of 29–35 °C. The optimal cell concentration for yeast was between 15 and 20 mg mL^−1^. Higher concentrations resulted in a significant increase in t_d_, while at lower concentrations t_d_ can deviate when a nominal concentration is not met accurately. Furthermore, placing the device inside a temperature-stabilized enclosure enhanced the stability of the thermal-resistance signal. The absolute chip temperature was a contributing factor for detachment, especially considering its role as a partly biologically driven mechanism. With the current device, it was not possible to determine whether convection or thermophoresis is responsible for lifting the cells from the chip surface. Future studies will address this question using more advanced instruments capable of generating shear flow without a temperature gradient or producing a temperature gradient without convective fluid movement.
Regarding future research directions, the sensor device and method can be utilized in several ways and, as it measures the impact of toxic substances on cell cultures, it falls into the category of cell-based biosensors, see Refs. [53,54,55]. We expect that in vitro drug testing will be an important application of the methodology, which is not necessarily limited to yeast cells because spontaneous detachment was already observed on human cell lines [15]. As an initial proof of concept for drug testing, the effects of the antibiotic Amphotericin B and the antiseptic povidone-iodine were studied. The latter led to an extremely retarded detachment even at low doses. Conversely, the method can assess a cell line’s susceptibility to a specific drug. If no susceptibility is noticed, it may serve as an indicator of antimicrobial resistance. From a practical perspective, working with a multiplexed device allowing multiple measurements simultaneously will be promising. Reducing the volume of individual sample compartments could be a viable option for cell types that are difficult to cultivate. Whether miniaturized sample compartments affect the optimal cell concentration, determined in the present work for yeast, needs to be verified. The theoretical limit would be compartments hosting only a single cell and a few research articles are available that address measuring thermal conductivity and heat capacity at the single cell level with advanced methods [56,57]. A current limitation of the approach is the lack of real-time imaging, which limits detailed insight into the detachment dynamics. Future work will address this by integrating live-cell imaging to enhance interpretability and support the reliability of finite element modeling. Additionally, a comprehensive study will compare various cell types and include an in-depth evaluation of drug efficacy for several antibiotics and their concentrations.
The reference list from the paper itself. Each links out to its DOI / PubMed record.
- 1Chen C. Wang J. Optical Biosensors: An Exhaustive and Comprehensive Review Analyst 20201451605162810.1039/C 9AN 01998 G 31970360 · doi ↗ · pubmed ↗
- 2Poghossian A. Schöning M.J. Recent Progress in Silicon-Based Biologically Sensitive Field-Effect Devices Curr. Opin. Electrochem.20212910081110.1016/j.coelec.2021.100811 · doi ↗
- 3Baranwal J. Barse B. Gatto G. Broncova G. Kumar A. Electrochemical Sensors and Their Applications: A Review Chemosensors 20221036310.3390/chemosensors 10090363 · doi ↗
- 4AkgönüllüS. Özgür E. Denizli A. Recent Advances in Quartz Crystal Microbalance Biosensors Based on the Molecular Imprinting Technique for Disease-Related Biomarkers Chemosensors 20221010610.3390/chemosensors 10030106 · doi ↗
- 5Chen J. Xu X. Zhou J. Li B. Interfacial Thermal Resistance: Past, Present, and Future Rev. Mod. Phys.2022942500210.1103/Rev Mod Phys.94.025002 · doi ↗
- 6van Grinsven B. Vanden Bon N. Strauven H. Grieten L. Murib M. Jiménez Monroy K.L. Janssens S.D. Haenen K. Schöning M.J. Vermeeren V. Heat-Transfer Resistance at Solid–Liquid Interfaces: A Tool for the Detection of Single-Nucleotide Polymorphisms in DNAACS Nano 201262712272110.1021/nn 300147 e 22356595 · doi ↗ · pubmed ↗
- 7Ahmadi Tabar F. Lowdon J.W. Caldara M. Cleij T.J. Wagner P. Diliën H. Eersels K. van Grinsven B. Thermal Determination of Perfluoroalkyl Substances in Environmental Samples Employing a Molecularly Imprinted Polyacrylamide as a Receptor Layer Environ. Technol. Innov.20232910302110.1016/j.eti.2023.103021 · doi ↗
- 8Cornelis P. Givanoudi S. Yongabi D. Iken H. DuwéS. Deschaume O. Robbens J. Dedecker P. Bartic C. Wübbenhorst M. Sensitive and Specific Detection of E. coli Using Biomimetic Receptors in Combination with a Modified Heat-Transfer Method Biosens. Bioelectron.20191369710510.1016/j.bios.2019.04.02631048213 · doi ↗ · pubmed ↗