Diffusion Coefficients and Activation Energies of Diffusion of Organic Molecules in Poly(lactic acid) Films
Johann Ewender, Rafael Auras, Uruchaya Sonchaeng, Frank Welle

TL;DR
This study measures how organic molecules diffuse through poly(lactic acid) films and uses the data to model diffusion behavior for predicting performance in packaging.
Contribution
The paper provides novel diffusion coefficients and activation energies for 55 organic molecules in PLA films and establishes predictive modeling parameters.
Findings
Diffusion coefficients and activation energies were determined for 55 organic molecules in PLA films.
Activation energy correlated with molecular volume and pre-exponential factor.
PLA diffusion behavior was compared with polyethylene terephthalate and polyethylene naphthalate.
Abstract
Poly(lactic acid) (PLA) is one of the most important bio-based and industrial compostable materials in food packaging. Its barrier properties towards oxygen and moisture are well documented. However, data on barrier properties of PLA towards organic molecules are scarce in the literature. This study investigated the diffusion of various organic molecules, including n-alkanes, 1-alcohols, 2-ketones, ethers, esters, amines, and aromatics, in two commercial PLA films with thicknesses of 20 µm and 30 µm. The diffusion coefficient (DP) values were determined from lag time in permeation tests conducted at temperatures ranging from 20 °C to 90 °C. The films were also characterized in terms of crystallinity, rigid and mobile amorphous fractions, and molecular weight. Activation energies (EA) were calculated based on the temperature dependence of the DP using the Arrhenius approach. In total,…
Genes, proteins, chemicals, diseases, species, mutations and cell lines named across the full text — each resolved to its canonical identifier and authoritative record.
Click any figure to enlarge with its caption.
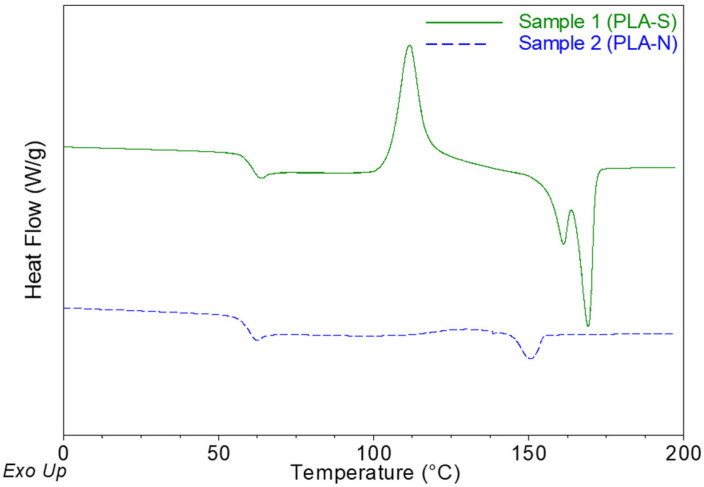 Figure 1
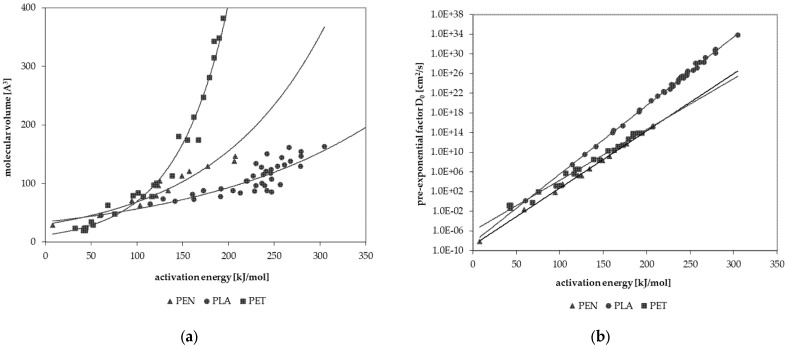 Figure 2
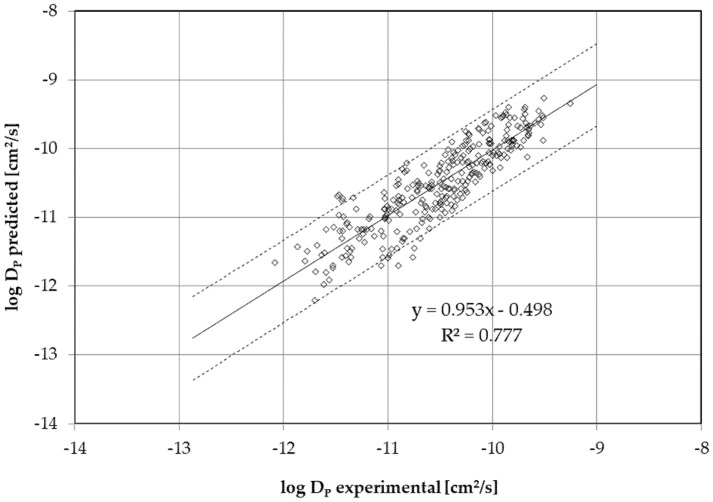 Figure 3
- —Federal Ministry of Food and Agriculture
Peer Reviews
No public reviews on file for this paper yet. If you reviewed it on a platform where reviews are public (OpenReview, ICLR, NeurIPS, ICML), you can paste yours below so the community can read it here.
Videos
No videos yet. Explain this paper in a talk, walkthrough, or lecture? Add one.
Taxonomy
Topicsbiodegradable polymer synthesis and properties · Nanocomposite Films for Food Packaging · Polymer crystallization and properties
1. Introduction
Poly(lactic acid)—PLA—is a leading bio-based and compostable plastic material widely used in food packaging and agricultural applications. Its mechanical, thermal, and structural properties, as well as its barrier performance against oxygen and moisture, have been extensively studied [1,2]. Adequate oxygen and moisture barriers are essential for extending the shelf life of packaged foods. Additionally, the diffusion of organic molecules through PLA determines its effectiveness as a barrier to flavoring substances and influences the migration of substances from PLA packaging into food. However, studies on the barrier properties of PLA towards organic molecules and diffusion coefficients of organic substances in PLA remain scarce because measuring organic vapor diffusion is challenging and requires specialized instrumentation and methodologies [3]. An overview of PLA barrier properties has been published, reporting the lack of these mass transfer data and the lack of consideration of PLA as a three-phase structure comprising a crystalline fraction, a mobile amorphous fraction, and a rigid (or restricted) amorphous fraction (RAF) [2]. The presence of RAF in semicrystalline PLA plays a crucial role in mass transfer due to the increased free volume, particularly at temperatures below the glass transition temperature, affecting the diffusion of gases and perhaps organic molecules, especially [4].
The migration of polymer ingredients, monomers, additives, and non-intentionally added substances from PLA packaging materials into food or food simulants was also investigated [5,6,7,8]. In addition, the sensory properties of PLA are relevant for the food law compliance evaluation of packed products in PLA packaging [9]. Understanding the diffusion properties of organic molecules in PLA is critical for assessing the transfer of substances from packaging materials into the products. Predictive modeling approaches have been developed to estimate the migration of monomers and additives from packaging into food using diffusion coefficients (D_P_). For conventional fossil-based polymers like polyolefins, polystyrene, polyethylene terephthalate, polyamide, etc., such modeling parameters have been well established [10,11]. For these polymers, diffusion modeling can be used to support conformity assessment or product development. Therefore, the migration prediction can support or even greatly simplify the assessment of packaging safety and regulatory compliance. Diffusion coefficients in bio-based polymers are also of interest in other areas such as bioengineering, e.g., in the nanostructure of bone [12], cartilage [13], or the extracellular space of the brain [14]. However, these modeling parameters have not yet been systematically determined for bio-based polymers like PLA. Diffusion modeling parameters are typically derived from migration experiments or experimentally determined D_P_, which can be correlated with the molecular weight or molecular volume of the substances. Such correlations enable the prediction of D_P_ for untested molecules [10,15].
This study aimed to determine the diffusion coefficients of organic substances in PLA using permeation experiments, specifically lag time tests. The tested substances included a range of organic compounds with varying polarity and functional groups. The activation energies of diffusion (E_A_) for these molecules were then calculated from the temperature dependence of D_P_. From the E_A_, the diffusion modeling parameters were derived.
2. Results
2.1. Film Characterization
2.1.1. Differential Scanning Calorimetry (DSC)
The tested PLA films (PLA-S and PLA-N) were characterized for their crystallinity (X_C_) and rigid and mobile amorphous fractions (X_RAF_ and X_MAF_, respectively). Figure 1 shows representative DSC thermograms. As shown in Table 1, all thermal properties of the films, glass transition temperature (Tg), cold crystallization temperature (T_c_), and melting temperature (T_m_), except for the X_MAF_ percentage, exhibit statistical differences between PLA-S and PLA-N. Both films are predominantly amorphous.
2.1.2. Fourier-Transform Infrared (FTIR) Spectroscopy
The FTIR absorbance spectra of PLA-S and PLA-N are provided in the Supplementary Materials (Figures S1–S5). Despite differences in peak intensities, both films’ peak positions remain identical, confirming their identical chemical structures. The variations in peak intensities are likely due to differences in film thickness and sample variability.
2.1.3. Gel Permeation Chromatography
Gel permeation chromatography (GPC) was used to determine the molecular weight of the PLA films. Table 2 presents the number average molecular weight (M_n_), weight average molecular weight (M_w_), and dispersity (Đ_M_) of PLA-S and PLA-N. The Đ_M_ values were calculated as M_w_/M_n_. The M_n_ values of PLA-S and PLA-N differ significantly, while their M_w_ values do not.
2.2. Diffusion Coefficient Determination
The diffusion coefficients (D_P_) of organic substances like n-alkanes, 1-alcohols, 2-ketones, ethers, esters, amines, and aromatics were determined from the lag time through the two commercial biaxially oriented PLA films, PLA-S and PLA-N. For the 20 μm PLA film (PLA-S), 57 individual D_P_ were determined. Furthermore, 233 D_P_ were measured for the 30 µm film (PLA-N). Overall, 290 D_P_ for 55 organic substances were determined within this study for both investigated PLA films. The D_P_ were assessed between 20 °C and 90 °C. However, due to the low diffusivity of organic substances in PLA, most of the D_P_ were measured between 70 °C and 90 °C, above the Tg of PLA, as indicated in Table 3. Only the gaseous alkanes (methane, ethane, and n-propane) could be measured at temperatures below the Tg of PLA in a reasonable time. For higher molecular weight substances, the permeation rates for the tested organic compounds were too low and, therefore, below the analytical detection limits of the applied lag time method. The experimentally determined diffusion coefficients are given in the Supplementary Materials (Table S1 for PLA-S and Table S2 for PLA-N). D_P_ values for the same compounds, such as 1-octanol, 1-butanol, and n-hexane for both samples, are comparable and between experimental errors.
The activation energies of diffusion (EA) were derived from the temperature dependence of D_P_. E_A_ was only calculated if the following criteria were met to determine the activation energies as accurately as possible: at least four diffusion coefficients were available, showing good linearity in the Arrhenius plot (r^2^ > 0.95) over at least a 15 °C temperature range. If the temperature range is too small, the slope of the linear correlation in the Arrhenius plot is too inaccurate, and the E_A_ calculated thereof is consequently also inaccurate. The E_A_, as well as the pre-exponential factors, D0, are presented in Table 3 for PLA-S and Table 4 for PLA-N.
3. Discussion
The experimentally determined D_P_ values for the 55 individual molecules of different polarity, functional groups, as well as molecular size, can be considered as representative of typical permeants of migrants of PLA. In general, large molecules diffuse slower through a polymer matrix compared with smaller molecules of a similar structure. As expected, higher molecular volume V results in lower D_P_ at a given temperature. More-over, higher temperature results in higher D_P_, which is expected from an Arrhenius relationship. However, due to the low diffusivity of PLA, the largest molecule tested in this study was di-iso-propyl naphthalene, with a molecular weight of 212.3 g/mol (molecular volume 227.94 Å^3^). Larger molecules therefore diffuse very slowly in the polymer so that the lag time is very long. For example, the lag time of di-iso-propyl naphthalene at 80 °C and 20 µm film is about 3 days. At the lower temperature of 60 °C, the lag time of di-iso-propyl naphthalene increases to approximately 18 years, as predicted for the diffusion modeling approach established in this study. We can assume a thinner PLA film of 10 µm will decrease the lag time to about 4.5 years, but this is still too long for an experimental determination of the lag time. In addition, thin films of 10 µm are not commercially available. The experimental measurement window is therefore very limited and is a condition determined by molecule size, film thickness, and temperature. Furthermore, due to the low diffusivity of PLA, almost all D_P_ in this study were measured above the glass transition temperature, where the PLA is in the rubbery state. This means that the diffusion is higher than in the glassy state and is an additional overestimating factor for predicting the migration below T_g_.
As a result, the experimentally determined D_P_ show a very strong dependence on the temperature. The E_A_ were calculated from this dependence. The E_A_ and the D0 values for each permeant were calculated from the Arrhenius relationship below or above Tg. The results show good linearity for the investigated permeants, indicating that the diffusion process follows Fick’s laws of diffusion. Figure 2 shows the correlations between E_A_ and the molecular volume V, as well as between E_A_ and the pre-exponential factor D0, respectively. The experimental data for PLA are shown in comparison with the published activation energy data for polyester PET [15] and PEN [16]. For all three polyester polymers, the E_A_ values are in the same order of magnitude for small molecules up to V of approximately 100 Å^3^ and for EA of about 120 kJ/mol. For larger molecules, the EA values for PLA are significantly higher than those of PET and PEN. The D0 values for all three polyesters follow a strong linear relationship over the range of approximately 20 orders of magnitude for PET and PEN, and approximately 40 orders of magnitude for PLA. The slope of the E_A_ and D0 correlation for PLA is different from the slopes determined for PET and PEN. Compared to PET and PEN, the increase in activation energy with molecule size is significantly more substantial for PLA. This means that even small molecules exhibit high activation energies of diffusion. A high activation energy implies that the temperature has a much stronger influence on diffusion. Therefore, increasing temperature has a high influence on the migration of substances into food or food simulants. This increase is not as significant for PET and PEN. However, like PET and PEN, PLA is a low-diffusible polymer which only releases substances into the food in small quantities unless high-swelling food simulants are used.
The two correlations can be used to determine the diffusion modeling parameters for PLA for Equation (1). This equation was developed for PET [15] but also applies to PLA, and the correlations can be established for PLA as well (Figure 2). According to Equation (1), the D_P_ can be predicted from the molecular volume V with the diffusion modeling parameters a to d for PLA. The parameters a to d are the slope and the axis intercept, respectively, in the two correlations for PLA. The parameter a is the slope of the correlation between pre-exponential factors D0 and E_A_, with b being the intercept of this correlation. Parameters c and d are the intercept and slope of the correlation between V and E_A_. The diffusion modeling parameters derived from the two correlations are given in Table 5 along with the previously reported values for PET [15] and PEN [16]. In Equation (1), V is the molecular volume and T is the temperature in Kelvin.
Figure 3 shows a comparison of the experimentally determined D_P_ with the predicted D_P_ from Equation (1) and the parameters a to d from Table 5. As a result, the slope of the correlation is near 1 and the straight line almost passes through the origin, which indicates the D_P_ were predicted realistically and well over the molecular size and temperature range. However, there is a certain spread in the data of experimentally determined D_P_ versus predicted D_P_, possibly due to slight differences among the PLA-S and PLA-N films. The two dashed lines represent the 95% confidence interval of the correlation. Previously, it has been shown that not only the crystallinity of the films—in this case, both mostly amorphous—but also the X_RAF_, albeit small compared with X_MAF_, and M_n_ play a role in D_P_ [17,18].
A comparison of the experimentally determined diffusion coefficients with data from the literature [2] is very difficult. On the one hand, there is very little data available. Secondly, the permeation rates were mostly determined while the diffusion coefficients were not. However, the few D_P_ measured previously are generally higher than the D_P_ measured in this study. It is very likely the permeation is measured at higher concentrations, which leads to interactions between the permeant and the polymer in the case of PLA, which probably increases the measured D_P_.
4. Materials and Methods
4.1. Materials
Two commercial biaxially oriented PLA films were used in this study:
- PLA-S: A 20-µm biaxially oriented PLA film (Evlon^®^, BI-AX International Inc., Wingham, ON, Canada).
- PLA-N: A 30-µm biaxially oriented PLA film (Nativia^®^, Taghleef Industries, Newark, DE, USA).
4.2. Film Characterization
4.2.1. Differential Scanning Calorimetry (DSC)
A differential scanning calorimeter, Q100 (TA Instruments, New Castle, DE, USA), calibrated with indium standards, was used for characterization and investigation of the crystallinity of the films. The film samples, 5–10 mg, were weighed and sealed in an aluminum pan, and the thermal analyses were performed in nitrogen atmosphere with a flow rate of 70 mL/min. For film characterization, the samples were cooled from room temperature to −50 °C, heated from −50 to 200 °C (first heating cycle), maintained isothermally for 1 min at 200 °C, cooled until −50 °C, and finally heated to 200 °C (second heating cycle). The temperature ramp rate for all the cycles was 10 °C/min. The characterization for each film was run in triplicate and the results were analyzed with the TA Instruments Universal Analysis 2000 software version 4.5A to determine the Tg, T_c_, and T_m_, as well as the enthalpies associated with these temperatures based on results from the second heating cycle. The degree of crystallinity (X_C_) was calculated from Equation (2):
where ΔH_m_ and ΔH_c_ are the enthalpy of melting and the enthalpy of cold crystallization of the sample, respectively. ΔH_f_^0^ is the enthalpy of fusion of pure crystalline sample, which is 93.1 J/g for PLA [19]. The mobile amorphous fraction (X_MAF_) was calculated from Equation (3):
where ΔC_p_ and ΔC_p_^0^ are the changes in heat capacity at T_g_ for the semicrystalline sample and the fully amorphous sample, respectively. ΔC_p_^0^ for a fully amorphous PLA is 0.639 J/(g °C) [20]. The rigid amorphous fraction (X_RAF_) was calculated from Equation (4):
4.2.2. Fourier-Transform Infrared Spectroscopy
Chemical functional groups in the films were identified using Fourier-transform infrared (FTIR) spectroscopy (IRAffinity-1S, Shimadzu, Columbia, MD, USA) in both transmittance and attenuated total reflectance (ATR) modes. Each spectrum was recorded with a resolution of 2 per cm and a mirror speed of 2.8 mm/s, with a total of 20 scans per measurement.
4.2.3. Gel Permeation Chromatography
Molecular weight distribution was determined by gel permeation chromatography (GPC) using a Waters 1515 system (Waters, Milford, MA, USA) equipped with a refractive index detector (Waters 2414) and HR Stryragel^®^ columns of 7.8 mm × 300 mm (HR4, HR3, and HR2). Approximately 10 mg of PLA was dissolved in 5 mL of tetrahydrofuran (THF) (Pharmco-Aaper, Brookfield, CT, USA), filtered through a 0.45 µm PTFE filter (Simsii, Inc., Port Irvine, CA, USA), and injected into a 2 mL GPC glass vial. All GPC runs were eluted with THF at a flow rate of 1.0 mL/min at 35 °C for 50 min and an injection volume of 100 µL. A calibration curve was constructed using polystyrene standards with the Mark–Houwink constants K = 0.0164 mL/g and α = 0.704. Data were analyzed using Waters Breeze2^®^ software version 3.30. Each sample was analyzed in triplicate.
4.2.4. Statistical Analysis
Statistical analyses of DSC and GPC data were performed by one-way analysis of variance (ANOVA), followed by Tukey’s multiple comparison test at a 95% confidence level (α = 0.05) using SAS^®^ Studio Release 3.8 (SAS Institute Inc., Cary, NC, USA).
4.3. Diffusion Coefficient Determination
4.3.1. Permeants
Two types of permeants were tested: liquid permeants and permanent gases.
Liquid permeants: n-alkanes (n-pentane to n-tetradecane), 1-alcohols (1-propanol to 1-octanol), 2-ketones (acetone to 2-octanone), cyclic alkanes, ethers, ketones (tetrahydrofuran, cyclohexane, 4-vinylcyclohexene, 1,3-dioxolane, 2-methyl-1,3-dioxolane, 1,4-dioxane, cyclopentane, cyclopentanone, cyclohexanone), esters (formic acid methyl ester to formic acid heptyl ester), amines (pyridine, pyrrol, 2,6-lutidine, aniline, 2-aminobenzonitrile), and aromatic substances (benzene, toluene, ethylbenzene, n-propylbenzene, n-butylbenzene, naphthalene, 1-methylnaphthalene, 1-ethylnaphthalene, 2,7-di-iso-propylnaphthalene, phenanthrene, anthracene). The respective groups of substances were mixed and measured together.Permanent gases: Methane, ethane, n-propane, and n-butane were tested as a mixture of gaseous alkanes.
4.3.2. Permeation Cell
PLA films were clamped in a permeation steel cell between two sealant rings. The surface area of the tested films was 191 cm^2^. The permeation cell, placed in a climate chamber, was divided into a lower and an upper space by the film. The lower space had a volume of 7667 cm^3^. The permeants were introduced into the cell as follows:
- Liquid permeants: The liquid mixtures were injected into the lower space of the permeation cell through a septum using a syringe. Upon injection, the permeants evaporated immediately at high temperatures (65 °C to 90 °C).
- Permanent gases: The gaseous alkane mixture was flushed through the lower space of the permeation cell with a constant gas flow.
The upper space of the permeation cell was permanently rinsed with a pure stream of nitrogen (20 mL/min) which moved the permeated substances out of the cell. The nitrogen stream went through a connected enrichment unit and the permeants were trapped on this unit over a period of 20 min. The enrichment unit was connected to a gas chromatograph (GC) with flame ionization detection. The permeants were directly desorbed into the GC, where their quantities were determined through quantitative analysis. During the GC run, the next sample was trapped on the enrichment unit and subsequently injected into the GC. By using this method, one kinetic point was measured every 45 min.
Gas Chromatographic conditions for the different permeants were as follows:
- Liquid permeants: Column: Rxi 624, length: 60 m, internal diameter: 0.32 mm, film thickness: 1.8 µm, carrier gas: 120 kPa helium. Temperature program: 40 °C (2 min), rate 10 °C/min to 200 °C, rate 20 °C/min to 270 °C, and held for 8 min. Pre-trap: substances collected on 20 mm length by 5 mm diameter of Carbopack B, desorbed at 350 °C. Main trap: substances focused at −46 °C on 30 mm length by 1.4 mm diameter of Carbopack B, desorbed at 320 °C.
- Permanent gases: Column: Poraplot Q, length: 30 m, internal diameter: 0.53 mm, film thickness: 20 µm, carrier gas: 120 kPa helium. Temperature program: 70 °C (0.5 min), rate 30 °C/min to 150 °C, and held for 5 min. Pre-trap: substances collected on 20 mm length by 5 mm diameter of Carbopack B, desorbed at 350 °C. Main trap: substances focused at −46 °C on 30 mm length by 1.4 mm diameter of active charcoal 140–280 µm, desorbed at 320 °C.
4.3.3. Diffusion Coefficient Calculation
Isostatic and quasi-isostatic methods are often used to determine the permeation of organic substances through films [21]. In these methods, a film is clamped in a permeation cell and brought into contact with a known concentration of the permeant on one side. The permeated quantity is purged with an inert carrier gas and brought for quantification, if necessary after concentration, to the detector. The lag time is the intersection of the x-axis of the tangent to the steady-state concentrations. The lag time can be used to calculate the D_P_ according to Equation (5) [2]. Calibration was performed with injections of the applied permeants at known amounts. The diffusion coefficients D_P_ (in cm^2^/s) were calculated from the lag times (in s) according to Equation (5), where l is the film thickness (in cm). The activation energies of diffusion E_A_ were calculated from the D_P_ at various temperatures according to the Arrhenius equation (Equation (6)) below or above Tg, where D0 is the pre-exponential factor, R is the gas constant, and T is the temperature in Kelvin.
4.3.4. Molecular Volume Calculations
The molecular volumes were calculated using the freely accessible program Molinspiration [22]. The program calculates the molecular volumes using a group-based contribution method.
5. Conclusions
In this study, a total of 290 diffusion coefficients were experimentally determined from the lag times of the various substances during permeation through PLA. From this, 38 activation energies of diffusion were calculated. The diffusion coefficients D_P_ as well as the activation energies of diffusion E_A_ correlate well with the molecular volume V of the permeants. The pre-exponential factors D0 also correlate with the E_A_. If other molecules are following such correlations, the D_P_ and E_A_ of other substances in PLA can be predicted from the V. The data are used to establish the diffusion modeling parameters for PLA. These modeling parameters can now be used to predict both the permeation of organic substances through PLA and the migration of monomers, additives, or other substances from PLA. The D_P_ determined in this study are actual diffusion coefficients. However, in migration studies, which are usually carried out in food simulants, other effects such as swelling of the packaging surface may occur, which increase diffusion and thus migration [8,23,24]. In real foods, however, such swelling effects occur less frequently.
Furthermore, the prediction of migration using diffusion modeling should always be overestimated [11,25]. The overestimation factor in D_P_ predicted from Equation (1) and the modeling parameters in Table 5 are 1.3 on average (median 1.0). The D_P_ are therefore predicted very well from the diffusion parameters a to d and Equation (1). This is shown in the log–log plot (Figure 3), which shows a slope near 1 and where the correlation line runs almost completely through the origin. At the same time, however, this means that almost half of the D_P_ underestimate the migration or permeation. To achieve a slight overestimation, the molecule size can be virtually reduced to predict higher diffusion coefficients. Based on the experimental data, a 30% molecular size reduction appears sufficient as a worst-case scenario. This reduction of the molecular volume by 30% results in a mean overestimation factor of 9.2 (median 4.6). In practice, this appears to be a good overestimation factor for predicting the D_P_ with a sufficient overestimation of the actual migration. This means the overestimation factor in migration is about 3, because the diffusion coefficient correlates with the square root of the migration.
The reference list from the paper itself. Each links out to its DOI / PubMed record.
- 1Lim L.-T. Auras R. Rubino M. Processing technologies of poly(lactic acid)Prog. Polym. Sci.20083382085210.1016/j.progpolymsci.2008.05.004 · doi ↗
- 2Sonchaeng U. Iniguez-Franco F. Auras R. Selke S. Rubino M. Lim L.-T. Poly(lactic acid) mass transfer properties Prog. Polym. Sci.2018868512110.1016/j.progpolymsci.2018.06.008 · doi ↗
- 3Ewender J. Welle F. Determination and prediction of the lag-times of hydrocarbons through a PET film Packag. Technol. Sci.20142796397410.1002/pts.2085 · doi ↗
- 4Macnamara J.F.Jr. Vallery R. Gidley D. Auras R. Density and crystallinity correlations: Enhancing moisture barrier properties in poly(L-lactic acid), poly(D-lactic acid), and stereocomplex-poly(L,D-lactic acid) films J. Appl. Polym. Sci.2025 e 5698610.1002/app.56986 · doi ↗
- 5Bradley E.L. Biobased Materials Used in Food Contact Applications: An Assessment of the Migration Potential. Report of the Food and Environment Research Agency, York (2010)Available online: https://www.food.gov.uk/sites/default/files/media/document/a 03070.pdf(accessed on 6 April 2025)
- 6Aznar M. Ubeda S. Dreolin N. Nerin C. Determination of non-volatile components of a biodegradable food packaging material based on polyester and poly-lactic acid (PLA) and its migration to food simulants J. Chromatogr. A 201915831810.1016/j.chroma.2018.10.05530477716 · doi ↗ · pubmed ↗
- 7Ubeda S. Aznar M. Alfaro P. Nerin C. Migration of oligomers from a food contact biopolymer based on polylactic acid (PLA) and polyester Anal. Bioanal. Chem.20194113521353210.1007/s 00216-019-01831-031053956 · doi ↗ · pubmed ↗
- 8Mutsuga M. Kawamura Y. Tanamoto K. Migration of lactic acid, lactide and oligomers from polylactide food-contact materials Food Addit. Contam. Part A 2008251283129010.1080/0265203080201752918608493 · doi ↗ · pubmed ↗