Development and Application of SSR Markers for Aquilaria sinensis on the Basis of Whole-Genome Resequencing Data
Yu Chen, Kunlin Wu, Jieru Xu, Shenghe Zhao, Zhihua Tu, Dandan Rao, Beibei Chen, Nanbo Jiao, Jinhui Chen, Xiaona Dong

TL;DR
This study develops and validates SSR markers for Aquilaria sinensis using whole-genome resequencing data to better understand its genetic diversity and support conservation efforts.
Contribution
The study introduces a novel SSR marker framework for A. sinensis using resequencing data to enhance genetic resource management.
Findings
56,657 SSR sequences were identified, with dinucleotide repeats being the most common.
20 high-quality SSR primer pairs successfully classified 149 accessions into three subpopulations with 95.97% accuracy.
Genetic variation within individuals accounted for 84% of the total variation in A. sinensis.
Abstract
Aquilaria sinensis (Lour.) Spreng. is an economically important tree specie that produces agarwood, a valuable medicinal and aromatic resin, when injured. However, its large-scale cultivation has led to confusion regarding its resources and genetic backgrounds, hindering the conservation and management of A. sinensis accessions. This study systematically developed and validated simple sequence repeat (SSR) molecular markers by using whole-genome resequencing (WGR) data from 60 A. sinensis accessions to elucidate their genetic diversity and population structure. A total of 56,657 SSR sequences (24,430 loci) were identified, which were dominated with dinucleotide repeat motifs (73.59%). After stringent quality control, 46 high-quality SSR loci were obtained, and 93 primer pairs were designed for amplification validation. Ultimately, 20 primer pairs with stable amplification and high…
Genes, proteins, chemicals, diseases, species, mutations and cell lines named across the full text — each resolved to its canonical identifier and authoritative record.
Click any figure to enlarge with its caption.
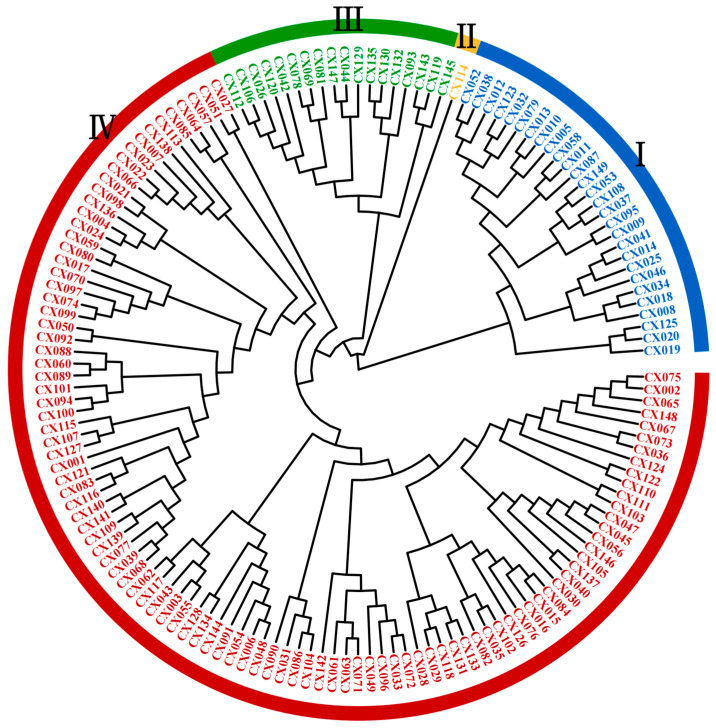 Figure 1
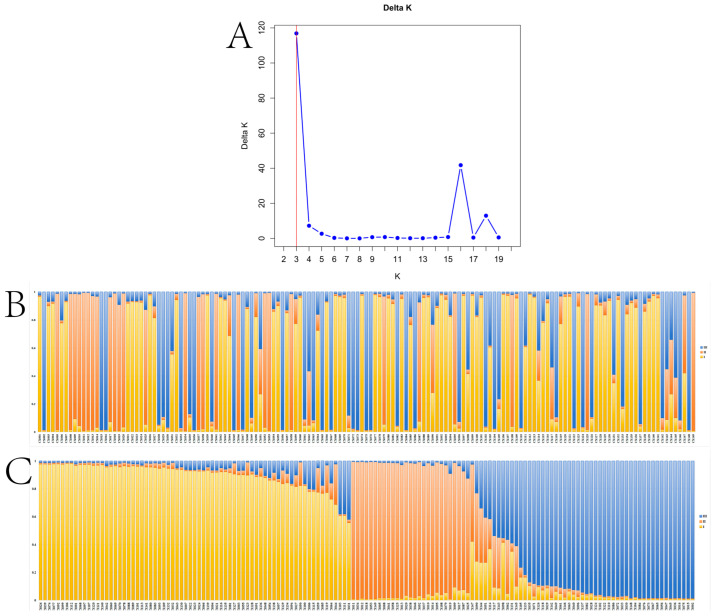 Figure 2
- —Technical Innovation Project of Hainan Provincial Scientific Research Institutes
- —Key Laboratory of Tropical Forestry Resources Monitoring and Application of Hainan Province
- —Guangdong Basic and Applied Basic Research Foundation
Peer Reviews
No public reviews on file for this paper yet. If you reviewed it on a platform where reviews are public (OpenReview, ICLR, NeurIPS, ICML), you can paste yours below so the community can read it here.
Videos
No videos yet. Explain this paper in a talk, walkthrough, or lecture? Add one.
Taxonomy
TopicsWood and Agarwood Research · Identification and Quantification in Food · Microbial Metabolism and Applications
1. Introduction
Aquilaria sinensis (Lour.) Spreng., a tree species of the Thymelaeaceae family, is renowned for its ability to produce agarwood, a resinous substance formed in response to external injury and fungal infection [1,2]. A. sinensis produces terminal or axillary umbellate inflorescences with bisexual flowers. This species exhibits self-incompatibility and is primarily pollinated by noctuids, pyralids, and geometrids [3,4]. Seed dispersal is primarily mediated by hornets [4].
Agarwood is highly valued not only for its medicinal properties, but also as a precious incense in religious and cultural practices, with a long history of utilization in regions such as India, the Middle East, China, and Japan [5]. Pharmacological studies have demonstrated that bioactive components in agarwood, including sesquiterpenes and phenylethyl chromone derivatives, exhibit anti-inflammatory, sedative, antioxidant, antimicrobial, and antitumor activities [6,7,8,9,10,11]. By 2013, the global agarwood market had reached an estimated value of USD 6–8 billion, with the market continuing to expand rapidly [12]. In China, A. sinensis was historically distributed across multiple southern provinces, including Hainan, Guangdong, Guangxi, and Yunnan. However, healthy A. sinensis trees do not produce agarwood, and the overexploitation of wild populations has led to their sharp decline [13]. Although artificial cultivation and agarwood induction techniques (e.g., mechanical drilling, electrical stimulation, and fungal inoculation) have been widely adapted, challenges such as unclear accession origins, ambiguous genetic backgrounds, and cultivar misidentification severely hinder the sustainable utilization of A. sinensis and the efficient production of agarwood [14,15,16]. Therefore, developing a rapid and accurate accession identification method is critical for the conservation and genetic improvement of this species.
Simple sequence repeat (SSR) markers, also known as microsatellites, consist of motifs of tandem repeats of 1–6 nucleotides. Owing to their codominant inheritance, high polymorphism, genome-wide distribution, reproducibility, and technical simplicity, SSR markers have been extensively applied in genetic diversity analysis, germplasm identification, genetic linkage mapping, and marker-assisted breeding [17,18,19]. For instance, SSR marker development in rice and wheat has significantly advanced the construction of genetic maps and trait-associated gene localization [20,21]. However, SSR-based studies on A. sinensis are still limited. Zou et al. used SSR and sequence-related amplified polymorphism (SRAP) markers to analyze the genetic diversity of 112 agarwood accessions and classified them into five geographically distinct groups that were consistent with their origins [22]. Xu et al. further identified 407 SSR loci within 92 candidate genes associated with agarwood formation and utilized 16 polymorphic primers to investigate the genetic diversity and population structure of 179 A. sinensis accessions [13]. Despite these developments, the lack of genome-wide SSR marker development has restricted the comprehensive exploration and utilization of A. sinensis genetic resources.
Recent advancements in whole-genome resequencing (WGR) technology, coupled with reduced costs, have revolutionized molecular marker development and genetic breeding in plants. High-throughput sequencing enables the rapid identification of genetic markers, including single nucleotide polymorphisms (SNPs), insertions/deletions (InDels), and structural variations (SVs). It also integrates functional genomics to elucidate the genetic basis of traits, thereby enhancing the efficiency of the marker-assisted selection. As of 2023, WGR has been applied to 187 terrestrial plant species, encompassing 54,413 accessions of cereals, legumes, vegetables, and other crops, and has resulted in successfully mapping the loci associated with yield, stress tolerance, and quality traits [23]. These studies have shown that WGR not only facilitates the development of efficient markers, but also accelerates the genetic improvement of complex traits through integration with transcriptomic and phenotypic data.
In this study, we developed genome-wide SSR markers for A. sinensis by using WGR data, and evaluated their polymorphism and application potential. A total of 56,657 SSR loci were identified from 168,459 sequences, from which 46 high-quality SSR loci were selected after stringent screening. Primers designed for these loci were preliminarily validated using eight DNA samples, which yielded 20 pairs with stable and reproducible amplification for subsequent genetic diversity assessment. By establishing a high-density SSR marker system, this research provides an essential tool for accession identification, genetic diversity analysis, and the molecular breeding of A. sinensis while laying a foundation for elucidating the genetic mechanisms underlying the agarwood formation.
2. Results
2.1. SSR Locus Characteristics
A total of 56,657 SSR sequences were identified from 168,459 sequences, which comprised 4747 mononucleotide repeats (8.38%), 41,695 dinucleotide repeats (73.59%), 9550 trinucleotide repeats (16.86%), 644 tetranucleotide repeats (1.14%), 13 pentanucleotide repeats (0.02%), and 8 hexanucleotide repeats (0.01%) (Table 1). After accounting for complementary base pairing, 86 distinct motifs were identified across 149 A. sinensis accessions. Tetranucleotide motifs were the most diverse (34 types), followed by trinucleotide motifs (28 types), while mono-, di-, penta-, and hexanucleotide motifs contained 2, 8, 8, and 6 types, respectively (Table S1). Among the mononucleotide repeats, A/T motifs were the most abundant (3013; 63.47%), followed by C/G motifs (1731; 36.53%). AT/AT motifs (15,194; 36.44%), followed by TA/TA motifs, were the most dominant dinucleotide repeats (12,840; 30.80%). Among the trinucleotide repeats, TAT/ATA motifs were predominant (3007; 31.49%), followed by AAT/ATT (2789; 29.20%) and TTA/TAA (2749; 28.79%). The highest frequencies were observed for TATG/CATA motifs (228; 35.40%) and ATAC/GTAT (135; 20.96%) tetranucleotide repeats, whereas the penta- and hexanucleotide motifs exhibited limited representation and dispersed distributions (Table S1).
The genotypic frequencies of the SSR loci across the 149 A. sinensis accessions were calculated. The most frequent SSR alleles ranged from 0.15 to 0.87, followed by secondary (0.08–0.47) and tertiary alleles (0.00–0.28) (Table S2). Notably, the SSR locus Scaffold_5532_109254228 (with a CTT repeat motif) showed equal allele frequencies for the most common and the second-most common alleles (both at 0.15), with a slight difference from the third allele (frequency of 0.13). Similar patterns were observed for the loci Scaffold_5532_8308141, Scaffold_8152_16679434, and Scaffold_3585_64368533 (Table S2). All the other SSR loci displayed a dominance across the genotypes within the population. These SSR profiles provide a foundation for marker-assisted selection and breeding strategies in A. sinensis.
2.2. SSR Primer Development
After collapsing and statistically analyzing SSR loci from identical genomic regions, 51,910 SSR sequences were found to originate from 24,430 SSR loci. Thus, 24,430 SSR loci were identified in A. sinensis using the population genome resequencing-derived VCF file. After the removal of the mononucleotide repeats, 22,486 SSR loci remained. The further exclusion of compound loci (containing multiple SSRs within 100 bp) resulted in 13,560 candidate loci.
A total of 152 SSR loci passed quality control. After excluding the loci lacking secondary common genotypes (defined as the second-most frequent genotype in the population), 46 high-confidence SSR loci were retained.
Three primer pairs were designed for each of the 46 SSR loci. Primers with short target fragments, ≥4 consecutive nucleotide repeats, or extreme GC contents were discarded; this yielded 93 candidate primer pairs. To identify polymorphic SSR loci, primers were initially screened (Table S3) using three A. sinensis DNA samples.
Primers that failed to amplify ≥3 distinct bands, that produced ambiguous peaks, or that showed amplification failures were discarded. A secondary screening (Table S4) was conducted by using eight randomly selected A. sinensis DNA samples that confirmed primers that yielded ≥3 reproducible bands and had polymorphism information content (PIC) > 0.30. Ultimately, 20 polymorphic SSR primer pairs were selected for genetic diversity analysis. Among these, trinucleotide repeats dominated (15 pairs), followed by dinucleotide repeats; only AquSSR34 represented a tetranucleotide repeat (Table 2).
2.3. SSR Polymorphism Evaluation
The polymorphism of 20 SSR loci was evaluated across 149 A. sinensis accessions on several parameters, which we briefly describe below. A total of 121 alleles were detected, where the number of observed alleles (Na) per locus ranged from 3 to 12 (mean: 6.050). AquSSR07, AquSSR34, and AquSSR89 exhibited the lowest Na (3 alleles each), while AquSSR29 showed the highest Na (12 alleles; Table 3). The effective number of alleles (Ne) ranged from 1.256 (AquSSR14) to 3.751 (AquSSR10), with a mean of 2.511. Notably, Ne values were consistently lower than Na across all the loci, which indicated an uneven allele distribution in the population (Table 3).
Further, the observed heterozygosity (Ho) ranged from 0.181 (AquSSR22) to 0.932 (AquSSR94), with a mean of 0.495. The expected heterozygosity (He) varied between 0.204 (AquSSR14) and 0.733 (AquSSR10), averaging 0.557 (Table 3). Furthermore, the Shannon’s information index (I) values ranged between 0.478 (AquSSR14) and 1.457 (AquSSR40), with an average of 1.063 (Table 3). These results indicate moderate levels of genetic diversity within the studied population.
Moreover, the polymorphism information content (PIC) values ranged from 0.196 (AquSSR14) to 0.688 (AquSSR10), with a mean of 0.507. Based on PIC classification thresholds (low: PIC < 0.25; moderate: 0.25 ≤ PIC < 0.50; high: PIC ≥ 0.50), two loci (AquSSR14, AquSSR34) were categorized as exhibiting low polymorphism, seven showed moderate polymorphism, and eleven displayed high polymorphism. AquSSR10 demonstrated the highest PIC value (0.688), underscoring its utility in genetic analyses (Table 3).
2.4. Genetic Diversity Analysis
2.4.1. Clustering Analysis
UPGMA clustering based on Nei’s genetic distance classified the 149 A. sinensis accessions into four major groups, which are represented by distinct colors in Figure 1. Group I comprised 28 accessions (18.79% of the total), namely, CX052, CX038, CX012, CX123, CX032, CX079, CX013, CX010, CX005, CX058, CX011, CX087, CX149, CX053, CX108, CX037, CX095, CX009, CX041, CX014, CX025, CX046, CX034, CX018, CX008, CX125, CX020, and CX019. Group II contained a single accession (CX114, 0.67%), exhibiting significant genetic divergence from the others. Group III comprised 18 accessions (12.08%), that is, CX112, CX106, CX026, CX120, CX042, CX078, CX069, CX081, CX147, CX044, CX129, CX135, CX130, CX132, CX093, CX143, CX119, and CX145. The remaining 102 accessions (68.46%) formed Group IV. The distinct clustering of CX114 suggests its potential value for its inclusion in core germplasm repositories (Figure 1).
2.4.2. Population Genetic Structure
Next, we analyzed the genetic structure of the 149 accessions with the help of Structure, which revealed clear genetic differentiation and distinct clustering patterns among different groups. Further analysis using Structure2.3.4 revealed optimal population subdivision at K = 3 (the meaning of the K-value is the number of clusters by which the group is intended to be divided; ΔK = 116.890; Figure 2, Table S5).
2.4.3. Population Genetic Diversity Analysis
Genetic diversity indices for the three clusters divided using population genetic structure analysis were calculated with GenAlex6.5 (Table 4 and Table S5): Ho ranged from 0.471 to 0.561 (mean: 0.505), while He varied between 0.470 and 0.603 (mean: 0.526). Cluster II exhibited the highest Ho and He values. Further, F values ranged from −0.002 to 0.063, with Cluster III showing negative F values, which indicated a higher heterozygosity. I averaged 0.975 (range: 0.851–1.141), with Cluster II displaying the highest genetic differentiation. Overall, moderate genetic diversity was observed across clusters, with Cluster II exhibiting the greatest divergence.
An analysis of molecular variance (AMOVA) revealed 11% of genetic variation among populations and 89% within populations (Table 5). Pairwise Fst values (0.051–0.085; Table 6) indicated low genetic differentiation (Fst < 0.15) among the three clusters.
2.4.4. Fingerprint Profiling
A binary matrix (0/1) was generated on the basis of the presence/absence of SSR amplification bands across the 20 loci (126 alleles). All the accessions, except CX002/CX075, CX015/CX084, and CX103/CX111, were unambiguously distinguished, which achieved a discrimination rate of 95.97% (Figure S1).
3. Discussion
SSRs, also known as microsatellites or short tandem repeats (STRs), consist of 1–6 nt repeat units that are widely distributed across a plant genome. Due to their high informativeness, polymorphism, codominant inheritance, and reproducibility, SSRs are widely used for studying genetic diversity, constructing genetic linkage maps, and enabling germplasm identification and marker-assisted breeding [24,25]. For instance, using SSR markers, Yan et al. successfully clustered 342 maize accessions and elucidated their pedigree relationships and genetic diversity, which highlighted the critical role of SSRs in deciphering genetic structure and evolutionary relationships [26].
Next-generation sequencing (NGS) technologies have revolutionized large-scale SSR marker development programs. Recent studies have extensively utilized transcriptomic or genomic data to identify SSR markers for plant genetic diversity analysis [27,28]. While the development of transcriptome-derived SSRs remains a commonly used approach, transcriptome-derived SSRs’ distribution patterns differ significantly from genomic SSRs. For example, Yu et al. compared SSR distributions in the genome (14,733 loci) and transcriptome (5411 loci) of Lycium barbarum, and found that trinucleotide repeats dominated the genome (66.51%), whereas dinucleotide repeats prevailed in the transcriptome (49.27%). This discrepancy suggests that transcriptome-based approaches may overlook numerous polymorphic loci [29].
With the declining cost of DNA sequencing, high-quality reference genomes and genome resequencing projects have advanced rapidly. As of 2023, genome resequencing had been applied to 187 plant species [23]. Compared to transcriptome- or genome-derived SSR development, whole-genome resequencing (WGR) enables more efficient identification of polymorphic SSR loci. In this study, we obtained 168,459 sequences on single nucleotide polymorphisms and long-fragment insertions from the WGR data of 60 A. sinensis accessions, and produced 56,657 SSR sequences (24,430 loci) from 168,459 sequences, with dinucleotide repeats (73.59%) being the most abundant, followed by trinucleotide repeats (16.86%). This pattern is consistent with the transcriptome-based SSR findings in A. sinensis [13].
The wild populations of A. sinensis, a key economic and ecological species in Hainan Province, have suffered a severe decline due to overexploitation for medicinal and aromatic uses. The challenge in maintaining diversity in its population is further compounded by the ambiguity in the genetic background of the cultivated stocks. To address this, researchers have focused on genetic diversity and population structure analysis [22,30]. In this study, we developed SSR markers using resequencing data and selected 20 loci (PIC: 0.196–0.688; mean: 0.507) to analyze 149 accessions. These markers have classified the germplasm into three subpopulations with 95.97% identification accuracy. Our study identified fewer subpopulations (K = 3) compared to Xu et al.’s 16-subgroup classification. This divergence likely reflects our intentional sampling bias toward cultivated varieties with demonstrated high agarwood-yielding traits, which may possess reduced genetic diversity due to selective breeding practices [13]. Notably, both studies demonstrated that the clustering patterns of A. sinensis show no significant correlation with geographic distribution. This discordance likely reflects extensive anthropogenic translocations [13]. Compared to traditional transcriptome-based methods, WGR provides broader genome coverage and identifies greater numbers of highly polymorphic SSR loci; it enriches the marker resources for molecular ID development. The SSR system established here not only accurately differentiates A. sinensis accessions but also enhances genetic diversity analysis, laying a foundation for germplasm conservation, molecular breeding, and genetic research in this species. In subsequent studies, we will continue to conduct research such as multiplex PCR and GWAS based on these 20 SSR markers, with the aim of finding key SSR markers to enhance agarwood production and for application in A. sinensis breeding.
4. Materials and Methods
4.1. DNA Extraction
Fresh leaf samples were collected from 149 A. sinensis accessions (Table S6). The samples were homogenized using a Biosample High-throughput Horizontal Mill system (Suzhen Biotechnology, Hangzhou, China). Genomic DNA was extracted using the Plant Genomic DNA Extraction Kit (Tiangen Biotech, Beijing, China). DNA quality was assessed with the help of 1% agarose gel electrophoresis, and purity was measured using an OSE-260 ultra-micro spectrophotometer (Tiangen Biotech, Beijing, China). Samples with clear electrophoretic bands, A260/A280 ratios of 1.8–2.0, and A260/A230 ratios ≥ 2.0 were selected and stored at −80 °C for subsequent use.
4.2. SSR Locus Identification and Primer Design
Based on the WGR data of 60 A. sinensis accessions, VCF files corresponding to the resequencing of these accessions were used to derive insertion/deletion (InDel) variants with lengths > 10 nt [31]. SSR loci were identified using MISA software (https://webblast.ipk-gatersleben.de/misa/) with the criterion that minimum repeat units of 10, 6, 5, 5, 5, and 5 were used for mono-, di-, tri-, tetra-, penta-, and hexanucleotide motifs, respectively. Compound SSR loci and mononucleotide repeats were excluded. Quality control was performed on the basis of variant quality, minor allele frequency (MAF), and missing data rates. Specifically, loci were retained if they met the following criteria: (1) variant quality score (QUAL) > 40 and genotype quality score (GQ) > 40 so that the reliability of variant calling is ensured; (2) sequencing depth (DP) between 5 and 100, so that low-coverage inaccuracies or high-coverage noises are avoided; and (3) MAF < 0.05 (to prioritize low-frequency variants) or the missing data rate (F_MISSING) ≤ 5%. Primer pairs were designed by extending the sequence by 150 bp upstream and downstream of each SSR locus in the reference genome. The primer parameters were set as follows: minimum, optimal, and maximum melting temperatures (Tm) of 57.0 °C, 60.0 °C, and 61.0 °C, respectively (maximum Tm difference between primers was set to 5 °C); primer lengths of 18–27 bp (optimal: 20 bp); GC content of 20–80%; and PCR product sizes of 100–300 bp.
4.3. SSR-Based Genotyping
Primers yielding stable amplification with ≥3 distinct bands were selected for genotyping. PCR reactions were performed in 10 μL volumes containing 5 μL 2× Taq PCR Master Mix (GeneTech, Shanghai, China), 0.5 μL each of forward and reverse primers (10 pmol/μL), 1 μL DNA template (about 20 ng), and 3 μL ddH_2_O. The amplification conditions included initial denaturation at 95 °C for 5 min; 10 cycles of 95 °C for 30 s, 62–52 °C (gradient) for 30 s, and 72 °C for 30 s; 25 cycles of 95 °C for 30 s, 52 °C for 30 s, and 72 °C for 30 s; a final extension at 72 °C for 20 min; and a hold at 4 °C. The reactions were conducted in a Veriti384 PCR Thermal Cycler (Applied Biosystems, Waltham, MA, USA).
To ensure the specificity of fluorescent PCR amplification and the concentration uniformity of the samples for capillary electrophoresis, after completing the fluorescent PCR amplification, 2 μL of the PCR products was subjected to agarose gel electrophoresis (1% concentration). The banding patterns of the PCR products were used to evaluate the amplification specificity of each SSR primer, while the band intensity was used to assess the amplification efficiency. According to the concentration requirements for sample detection, all of the fluorescent PCR products were diluted to obtain uniformly concentrated fluorescent PCR products, which were then prepared for sequencing instrument detection.
The diluted fluorescent PCR products with standardized concentrations were loaded onto the detection plate, and the following detection reagent system was added separately: 1.0 μL of fluorescent PCR product, 0.5 μL of GeneScan™ 500 LIZ (AppliedBiosystem, Waltham, MA, USA), and 8.5 μL Hi-Di™ Formamide (AppliedBiosystem, Waltham, MA, USA). The prepared detection plate containing the samples and reagents was centrifuged and then placed in a Veriti384 PCR Thermal Cycler (Applied Biosystems, Waltham, MA, USA) to run the denaturation program (95 °C, 3 min). After denaturation, the samples were immediately cooled. Following the ABI 3730xL (AppliedBiosystem, Waltham, MA, USA) operating procedure, the corresponding detection file for the plate name was selected, and the SSR sample analysis detection program was executed.
The amplified products were separated with the help of fluorescent capillary electrophoresis and were analyzed using GeneMarker v2.2.0 (SoftGenetics, State College, PA, USA) to determine allele numbers, peak patterns, and genotypes.
4.4. SSR Polymorphism and Genetic Diversity Analysis
GenAlex6.5 was used to calculate the genetic parameters for 20 primer pairs, which included the observed alleles (Na), effective alleles (Ne), Shannon’s information index (I), expected heterozygosity (He), observed heterozygosity (Ho), and fixation index (F) [32]. Polymorphism information content (PIC) was determined by using Cervus3.0 (http://www.fieldgenetics.com (accessed on 24 August 2024)) [33]. Population structure analysis was performed with the help of Structure2.3.4, with K-values (hypothetical subpopulations) ranging from 1 to 20. Each K was run 20 times with a burn-in period of 10,000 iterations and 100,000 Markov chain monte carlo (MCMC) replicates [34]. The optimal K was determined with the help of the ΔK method and using StructureSelector (https://lmme.ac.cn/StructureSelector/ (accessed on 9 August 2024)) [35]. Genetic structure visualization, molecular variance analysis (AMOVA), and UPGMA clustering, based on Nei’s genetic distance, were conducted using Excel, GenAlex6.5, and R4.4.1 (https://www.r-project.org/ (accessed on 5 August 2024)), respectively [32,36]. A binary matrix (0/1) was generated to represent SSR banding patterns for fingerprinting.
5. Conclusions
This study developed a large number of SSR loci using resequencing data from 60 A. sinensis accessions and designed primers to screen 20 highly efficient and reliable SSR primer pairs. These markers were successfully applied to analyze the genetic diversity of 149 A. sinensis accessions and to construct fingerprints, which achieved a discrimination rate of 95.97%. Our findings demonstrate that SSR marker development from resequencing data not only enables more efficient identification of SSR loci but also provides a robust tool for genetic diversity analysis in A. sinensis populations.
The reference list from the paper itself. Each links out to its DOI / PubMed record.
- 1Mohamed R. Jong P.L. Kamziah A.K. Fungal inoculation induces agarwood in young Aquilaria malaccensis trees in the nursery J. For. Res.20142520120410.1007/s 11676-013-0395-0 · doi ↗
- 2Zhang Y. Meng H. Lyu F. Fan X. Liu P. He X. Huang Y. Chen B. Yang Y. Wei J. Temporal characteristics of agarwood formation in Aquilaria sinensis after applying whole-tree agarwood-inducing technique Chin. Herb. Med.202315374410.1016/j.chmed.2022.07.00336875439 PMC 9975615 · doi ↗ · pubmed ↗
- 3Wang B. Ma G. Lin S. He X. Chen B. Li H. Huang L. Yang Y. Wei J. Floral Biology of Aquilaria sinensis (Lour.) Spreng Hortic.20241010910.3390/horticulturae 10010109 · doi ↗
- 4Chen G. Liu C. Sun W. Pollination and seed dispersal of Aquilaria sinensis (Lour.) Gilg (Thymelaeaceae): An economic plant species with extremely small populations in China Plant Divers.20163822723210.1016/j.pld.2016.09.00630159470 PMC 6112233 · doi ↗ · pubmed ↗
- 5Lopez-Sampson A. Page T. History of Use and Trade of Agarwood Econ. Bot.20187210712910.1007/s 12231-018-9408-4 · doi ↗
- 6Dahham S.S. Hassan L.E.A. Ahamed M.B.K. Majid A.S.A. Majid A.M.S.A. Zulkepli N.N. In vivo toxicity and antitumor activity of essential oils extract from agarwood (Aquilaria crassna)Bmc Complement. Altern. Med.20161623610.1186/s 12906-016-1210-127450078 PMC 4957886 · doi ↗ · pubmed ↗
- 7Chen H. Yang Y. Xue J. Wei J. Zhang Z. Chen H. Comparison of Compositions and Antimicrobial Activities of Essential Oils from Chemically Stimulated Agarwood, Wild Agarwood and Healthy Aquilaria sinensis (Lour.) Gilg Trees Molecules 2011164884489610.3390/molecules 1606488421677602 PMC 6264414 · doi ↗ · pubmed ↗
- 8Li W. Chen H.-Q. Wang H. Mei W.-L. Dai H.-F. Natural products in agarwood and Aquilaria plants: Chemistry, biological activities and biosynthesis Nat. Prod. Rep.20213852856510.1039/D 0NP 00042 F 32990292 · doi ↗ · pubmed ↗