Visualization of Moisture Distribution in Stacked Tea Leaves on Process Flow Line Using Hyperspectral Imaging
Yuying Zhang, Binhui Liao, Mostafa Gouda, Xuelun Luo, Xinbei Song, Yihang Guo, Yingjie Qi, Hui Zeng, Chuangchuang Zhou, Yujie Wang, Jingfei Zhang, Xiaoli Li

TL;DR
This paper uses hyperspectral imaging and machine learning to visualize and monitor moisture distribution in stacked tea leaves during processing, helping ensure consistent tea quality.
Contribution
A novel hyperspectral imaging method with high accuracy for real-time moisture monitoring in tea production is introduced.
Findings
A spectral model achieved high accuracy (Rp2 > 0.940) for predicting tea leaf moisture content.
Moisture distribution was non-uniform, with higher levels at leaf tips and petioles.
The method successfully visualized moisture in seven key processing steps for two tea types.
Abstract
The distribution of moisture content in stacked tea leaves during processing significantly influences tea quality. Visualizing this moisture distribution is crucial for optimizing processing parameters. In this study, we utilized hyperspectral imaging (HSI) technology combined with machine learning algorithms to evaluate the moisture content and its distribution in the stacked tea leaves in West Lake Longjing and Tencha green tea products during the processing flow line. A spectral quantitative determination model was developed, achieving high accuracy (Rp2 > 0.940) The model demonstrated strong generalization ability, allowing it to predict moisture content in both types of tea. Through hyperspectral imaging, we visualized moisture distribution in seven key processing steps and observed that moisture content was non-uniform, with the leaf tips and petioles having higher moisture levels…
Genes, proteins, chemicals, diseases, species, mutations and cell lines named across the full text — each resolved to its canonical identifier and authoritative record.
Click any figure to enlarge with its caption.
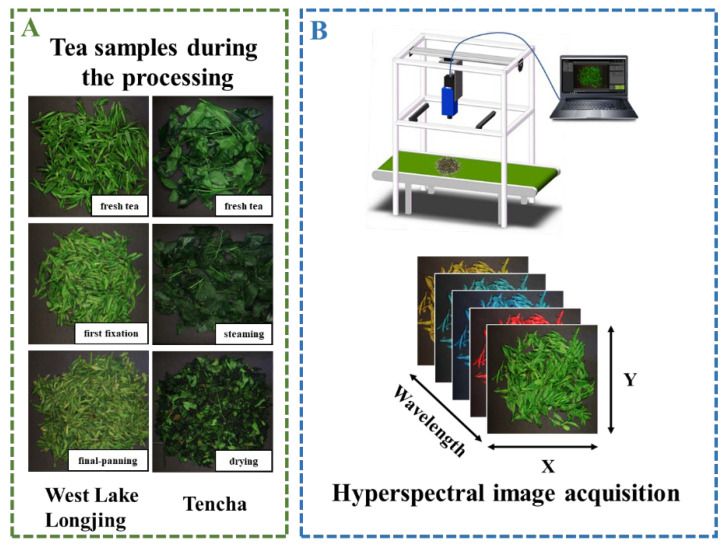 Figure 1
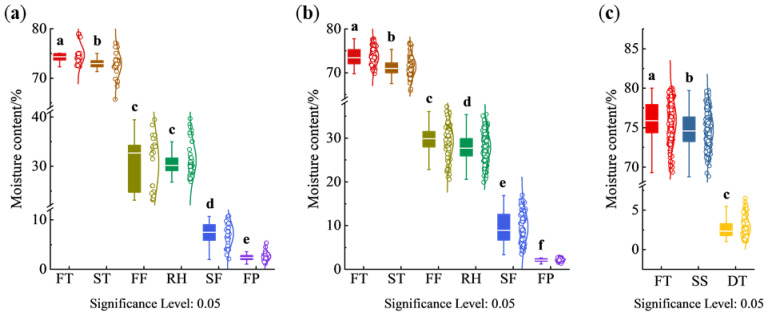 Figure 2
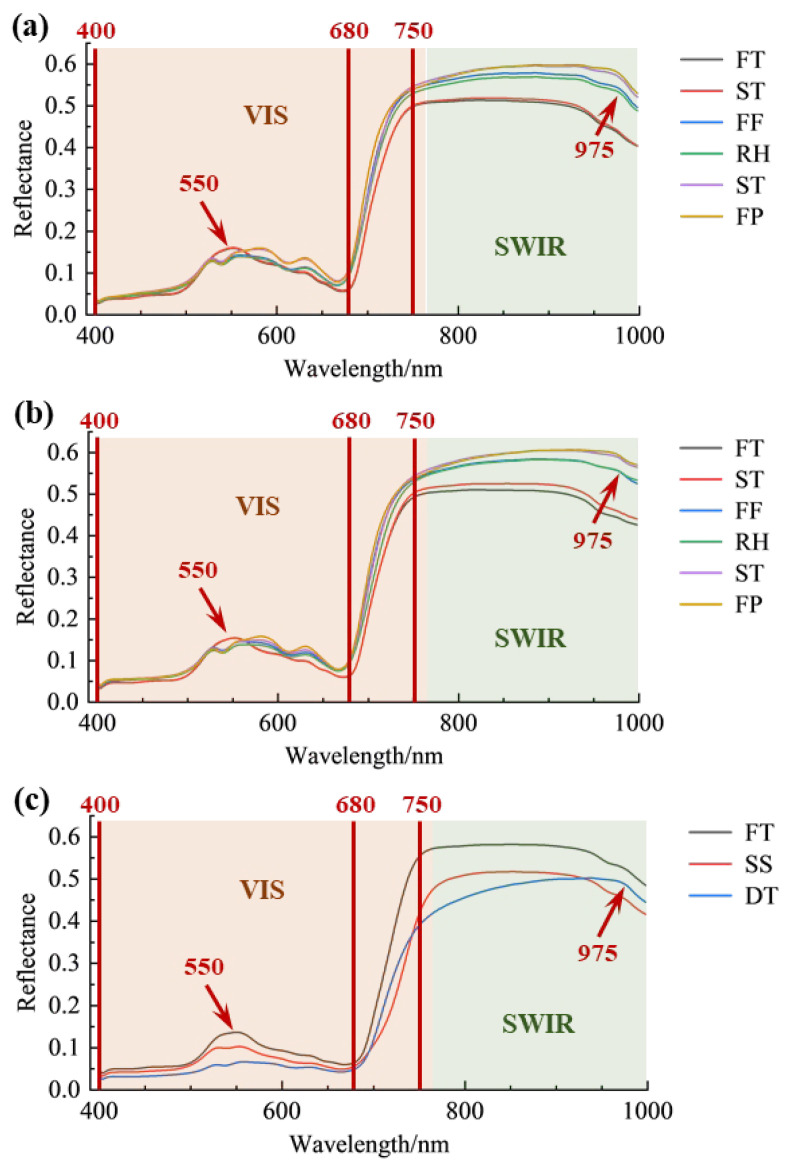 Figure 3
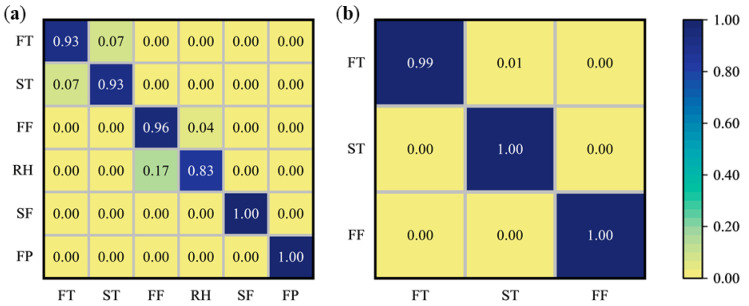 Figure 4
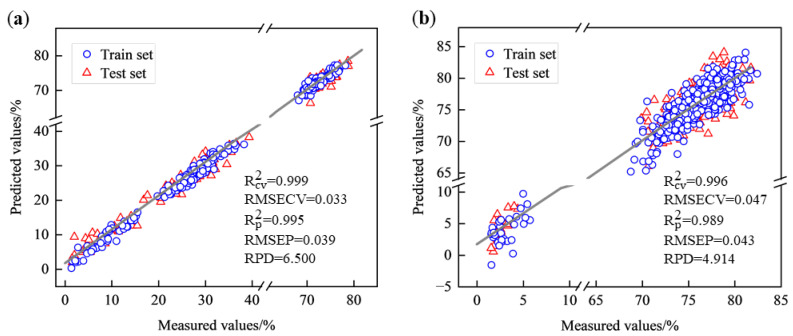 Figure 5
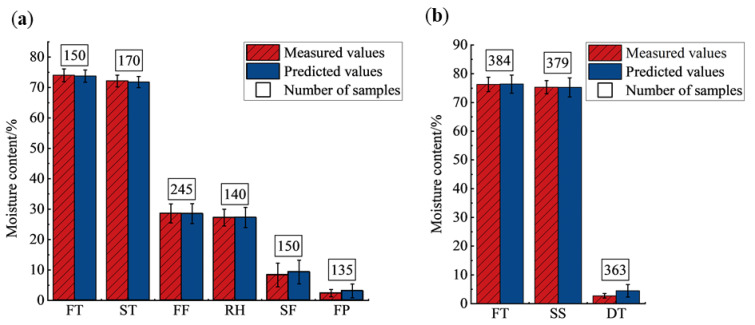 Figure 6
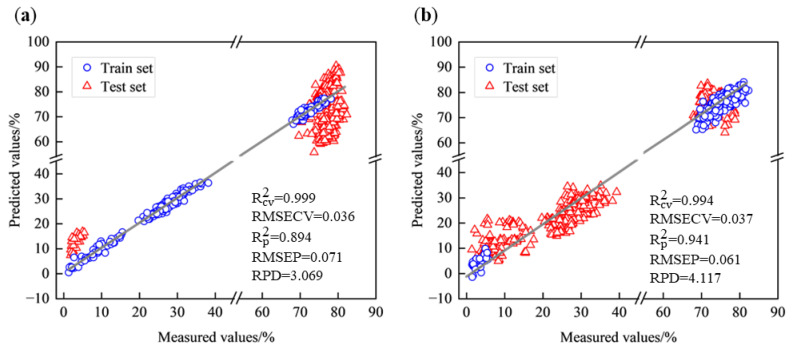 Figure 7
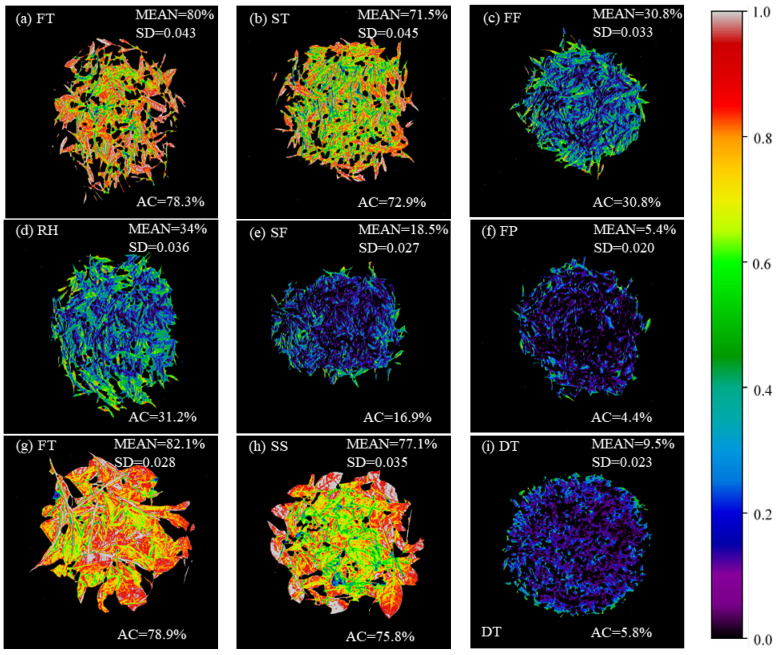 Figure 8
Peer Reviews
No public reviews on file for this paper yet. If you reviewed it on a platform where reviews are public (OpenReview, ICLR, NeurIPS, ICML), you can paste yours below so the community can read it here.
Videos
No videos yet. Explain this paper in a talk, walkthrough, or lecture? Add one.
Taxonomy
TopicsSpectroscopy and Chemometric Analyses · Water Quality Monitoring and Analysis · Remote Sensing in Agriculture