Genomic-based genotype and drug susceptibility profile of Mycobacterium kansasii in China
Yiting Wang, Xichao Ou, Bing Zhao, Hui Xia, Yang Zheng, Yang Zhou, Ruida Xing, Yuanyuan Song, Shengfen Wang, Yanlin Zhao, Huiwen Zheng

TL;DR
This study analyzed the genetic and drug susceptibility profiles of Mycobacterium kansasii in China, finding that rifabutin and clarithromycin are most effective, while new tuberculosis drugs show potential for treating M. kansasii infections.
Contribution
The study provides the first comprehensive genomic and drug susceptibility analysis of M. kansasii in China, highlighting novel insights into drug resistance patterns and potential treatment options.
Findings
M. kansasii type I is the predominant genotype in China, with 153 isolates classified into 3 clusters.
Rifabutin and clarithromycin showed 100% and 99.35% susceptibility, respectively, while new drugs like bedaquiline and delamanid had very low MIC values.
Cluster 3 showed higher resistance rates compared to clusters 1 and 2, suggesting a link between clustering and drug resistance.
Abstract
To analyze subtypes, microbiological characteristics and antimicrobial susceptibility of Mycobacterium kansasii in China, a total of 153 M. kansasii isolates, collected from national drug resistance surveillance, were genotyped with whole genome sequencing and explored the antimicrobial susceptibility with broth microdilution. All isolates were classified as M. kansasii type I based on Average Nucleotide Identity(ANI). The 153 M. kansasii representatives were differentiated into 3 clusters with 141 genotypes, including 17 isolates from a cluster and 136 isolates with unique patterns. The EXS-1, EXS-3 and EXS-5 regions were involved in all isolates. Rifabutin and clarithromycin were the most highly active against M. kansasii strains, with the susceptible rate of 100 and 99.35%, respectively. Followed by amikacin and linezolid, the resistance rate was 5.88 and 7.19%, respectively. The…
Genes, proteins, chemicals, diseases, species, mutations and cell lines named across the full text — each resolved to its canonical identifier and authoritative record.
Click any figure to enlarge with its caption.
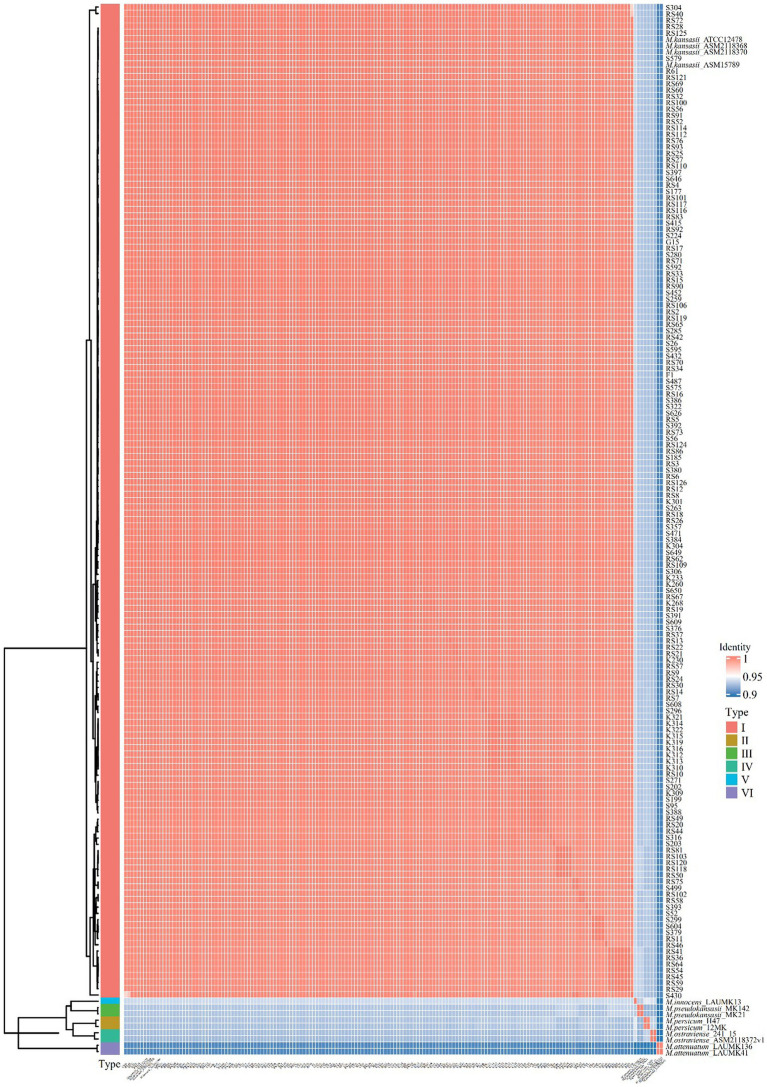 Figure 1
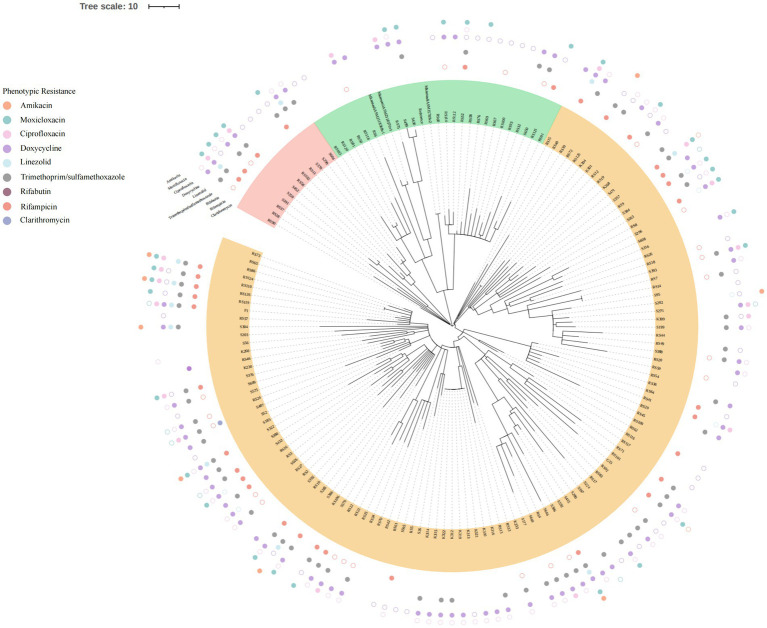 Figure 2
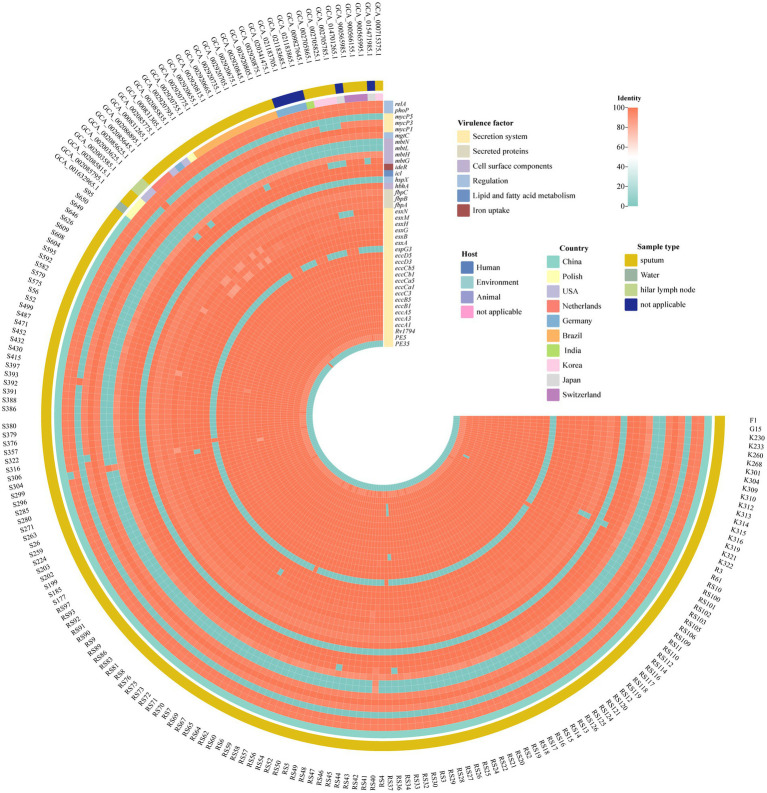 Figure 3
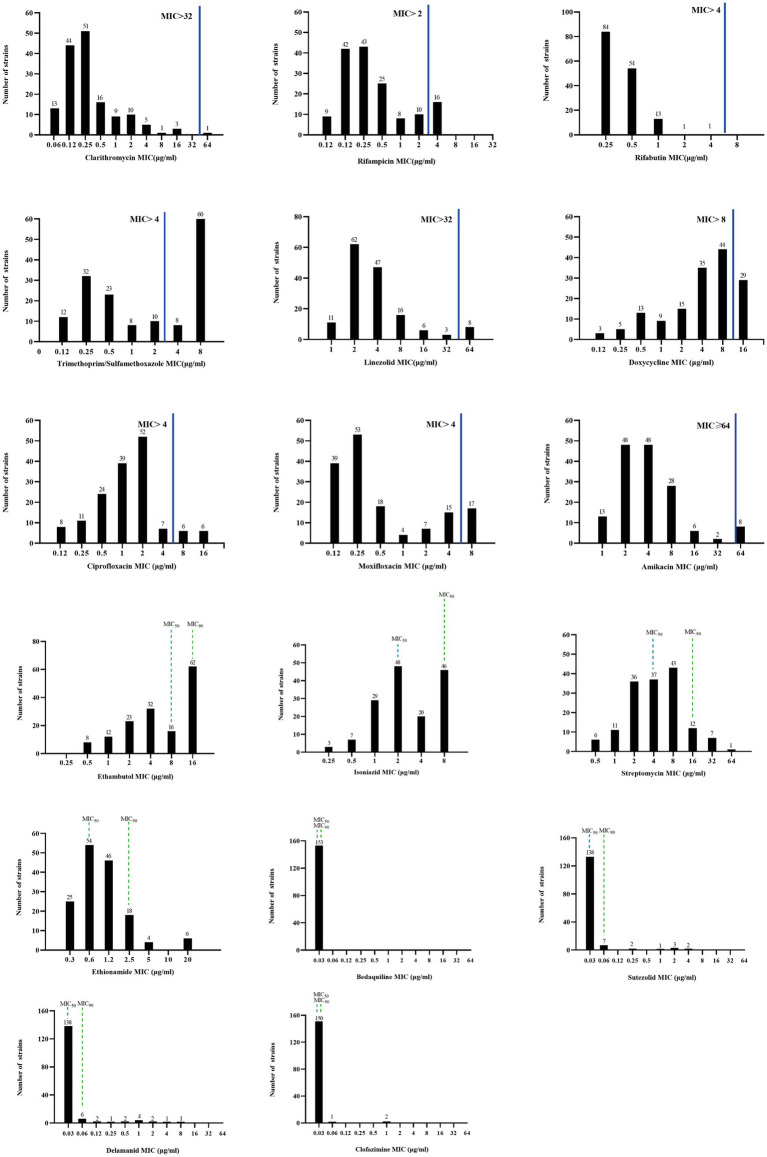 Figure 4
| Antibiotics | MIC (μg/mL) | Number of resistant isolates (%) | ||||
|---|---|---|---|---|---|---|
| Sensitive | Intermediate | Resistant | MIC50 | MIC90 | ||
| Rifabutin | ≤2 | – | ≥4 | 0.25 | 0.5 | 0(0.00) |
| Clarithromycin | ≤8 | 16 | ≥32 | 0.25 | 2 | 1(0.65) |
| Amikacin | ≤16 | 32 | ≥64 | 4 | 16 | 9(5.88) |
| Linezolid | ≤8 | 16 | ≥32 | 4 | 16 | 11(7.19) |
| Ciprofloxacin | ≤1 | 2 | ≥4 | 1 | 4 | 19(12.42) |
| Moxifloxacin | ≤1 | 2 | ≥4 | 0.25 | 8 | 32(20.92) |
| Rifampicin | ≤1 | – | ≥2 | 0.5 | 8 | 34(22.22) |
| Trimethoprim/sulfamethoxazole | ≤2/38 | – | ≥4/76 | 2 | 8 | 68(44.44) |
| Doxycycline | ≤1 | 2–4 | ≥8 | 4 | 16 | 73(47.71) |
| Ethambutol | – | – | – | 8 | 16 | – |
| Isoniazid | – | – | – | 2 | 8 | – |
| Streptomycin | – | – | – | 4 | 16 | – |
| Ethionamide | – | – | – | 0.6 | 2.5 | – |
| Bedaquiline | – | – | – | 0.03 | 0.03 | – |
| Sutezolid | – | – | – | 0.03 | 0.06 | – |
| Delamanid | – | – | – | 0.03 | 0.06 | – |
| Clofazimin | – | – | – | 0.03 | 0.03 | – |
| Drug | No. susceptible (%) | No. resistant (%) |
| ||
|---|---|---|---|---|---|
| Clarithromycin | Cluster1 | 40(100.00) | 0(0.00) | 0.80 | 0.67 |
| Cluster2 | 27(96.43) | 0(0.00) | |||
| Cluster3 | 84(98.82) | 1(1.18) | |||
| Rifampicin | Cluster1 | 32(80.00) | 8(20.00) | 0.73 | 0.70 |
| Cluster2 | 23(82.14) | 5(17.86) | |||
| Cluster3 | 64(75.29) | 21(24.71) | |||
| Rifabutin | Cluster1 | 40(100.00) | 0(0.00) | 0.81 | 0.67 |
| Cluster2 | 28(100.00) | 0(0.00) | |||
| Cluster3 | 84(98.82) | 1(1.18) | |||
| Trimethoprim/sulfamethoxazole | Cluster1 | 27(67.50) | 13(32.5) | 3.17 | 0.21 |
| Cluster2 | 16(57.14) | 12(42.86) | |||
| Cluster3 | 43(50.59) | 42(49.41) | |||
| Linezolid | Cluster1 | 37(92.50) | 3(7.50) | 2.24 | 0.33 |
| Cluster2 | 25(89.29) | 0(0.00) | |||
| Cluster3 | 75(88.24) | 7(8.24) | |||
| Doxycycline | Cluster1 | 4(10.00) | 18(45.00) | 1.49 | 0.48 |
| Cluster2 | 5(17.86) | 13(46.43) | |||
| Cluster3 | 20(23.53) | 43(50.59) | |||
| Ciprofloxacin | Cluster1 | 27(0.68) | 5(12.50) | 0.69 | 0.71 |
| Cluster2 | 12(42.86) | 4(14.29) | |||
| Cluster3 | 44(51.76) | 9(10.59) | |||
| Moxifloxacin | Cluster1 | 28(70.00) | 12(30.00) | 3.41 | 0.18 |
| Cluster2 | 19(67.86) | 7(25.00) | |||
| Cluster3 | 67(78.82) | 13(15.29) | |||
| Amikacin | Cluster1 | 39(97.50) | 1(2.50) | 2.00 | 0.37 |
| Cluster2 | 27(96.43) | 1(3.57) | |||
| Cluster3 | 77(90.59) | 7(8.24) |
Peer Reviews
No public reviews on file for this paper yet. If you reviewed it on a platform where reviews are public (OpenReview, ICLR, NeurIPS, ICML), you can paste yours below so the community can read it here.
Videos
No videos yet. Explain this paper in a talk, walkthrough, or lecture? Add one.
Taxonomy
TopicsMycobacterium research and diagnosis · Infectious Diseases and Mycology · Tuberculosis Research and Epidemiology
Introduction
Mycobacterium kansasii, a leading cause of pulmonary, extrapulmonary and disseminated diseases in immunocompromised individuals, stands out as one of the most frequently isolated non-tuberculous mycobacterial (NTM) species worldwide (Hoefsloot et al., 2013; Campo and Campo, 1997; Pintado et al., 1999). Initially, seven subtypes (I-VII) along with two intermediate (I/II) and atypical (IIb) types, were taxonomically reclassified as species-level members of the M. kansasii complex (MKC) (Taillard et al., 2003; Iwamoto and Saito, 2006; Tagini et al., 2019; Jagielski et al., 2020). Though multiple molecular techniques have been developed to genotype M. kansasii, the resolution was low when relying solely on certain gene sequences (Zhang et al., 2004). Therefore, we conducted whole genome sequence (WGS) to enable high-resolution subtyping analysis.
Due to the difference in the pathogenicity of M. kansasii subtypes, it is necessary to perform drug susceptibility testing (DRS) to predict the clinical outcome of patients infected with M. kansasii (Kim et al., 2021; Li et al., 2016). Daily therapy with isoniazid (INH), rifampin (RIF), and ethambutol (EMB) was recommended by the American Thoracic Society/Infectious Disease Society of America (ATS/IDSA) for M. kansasii (Griffith et al., 2007). Given that treatment failure is associated with RIF resistance, there is an urgent need to conduct DRS for other medications (Griffith et al., 2007). Besides, considering the natural resistance to most antibacterial drugs for NTM, novel and more effective antibiotics were urgently needed (Raju et al., 2016). Whereas data on DRS of M. kansasii was limited. Therefore, this study was designed to analyze subtypes, microbiological characteristics and antimicrobial susceptibility of M. kansasii isolates in China.
Materials and methods
M. kansasii isolates and genotyping
Sputum specimens were collected from suspected pulmonary tuberculosis patients with acid-fast bacilli-positive isolates, from 8 provinces and 3 municipalities included in the Chinese Drug Resistance Surveillance Program (DRS) running between 2016 and 2020. Patients were excluded if the samples were unqualified. Clinical samples treated with NALC-NaOH were subsequently cultured on differential medium containing paranitrobenzoic acid (PNB) and thiophen-2-carboxylic acid hydrazide (TCH) to distinguish NTM from Mycobacterium tuberculosis complex (MTBC). Isolates identified as NTM using biochemical method were further identified as MKC by sequencing the genes encoding 16S rRNA, hsp65, rpoB, and the 16S–23S rRNA internal transcribed spacer (ITS), and non-purified isolates were excluded from further analysis. The MKC strains were further re-identified by MALDI-TOF-MS, representing I-VII genotypes of Mycobacterium kansasii spectra reference database, followed by WGS, which resulted in the final identification of all isolates as M. kansasii.
Genome sequencing
All genomic DNA was extracted using the cetyl-trimethyl-ammonium bromide (CTAB) method, as previously described (Kigozi et al., 2018). Extracted genomic DNA was quantified using a Qubit 2.0 Fluorometer (Thermo Fisher, Singapore). Genomic DNA libraries were constructed using the Illumina Nextera kit according to the manufacturer’s protocol. Each library was sequenced using an Illumina NovaSeq 6,000 system (Illumina, Inc.) that generates 150-bp paired-reads from each end (read length of 2 × 150 bp) for each DNA fragment in a library. In order to secure exhaustive coverage of the target genome, each sample underwent sequencing to reach a depth of 150x and the genome coverage was requested to be above 90%. All whole-genome sequencing procedures were performed by Annoroad Gene Technology (Beijing, China).
The Raw Data were filtered to remove contaminants and low - quality reads before analysis. SPAdes (v3.15.5) and Unicycler (v0.5.0) were used for assembly in three steps: correction, assembly and mismatch correction. GapFiller (v1.11) optimized the assembly and filled gaps. Seqkit (v2.4.0) filtered out fragments < 200 bp for the final result. Prokka (v1.14.5) was used for annotation.
Identifying
Resulting genomic sequences were analyzed to identify distinct subspecies according to average nucleotide identity (ANI) values, which were calculated using pyani.1 The results were visualized as a heatmap using R package ComplexHeatmap (Gu et al., 2016). Isolates yielding genome sequences with ANI values of >95% were deemed members of the same species (Kim et al., 2014). The utilization of ANI values for species - level discrimination can significantly enhance the resolution of identification, enabling more precise differentiation at the subspecies level.
Phylogenetic tree construction
Core single nucleotide polymorphisms (SNPs) in genome sequences obtained for each isolate were detected by mapping reads to the M. kansasii reference strain (ATCC12478) sequence using Snippy v4.4.5, then core SNPs were concatenated and aligned using the snippy-multi script. A maximum likelihood tree was generated based on core-SNP alignment then the resulting tree was visualized using the Interactive Tree of Life (iTOL) online tool (Minh et al., 2020; Letunic and Bork, 2011).
Virulence identification
Contigs were screened to detect known virulence genes using ABRicate and the Virulence Factors Database (VFDB). Next, virulence factor analysis was performed on potential virulence gene sequences with sequence coverage rates of ≥85% and rates of sequence identity with known virulence genes of ≥85% (Guo et al., 2022). Heatmaps were generated using the heatmap function of the R package.
Antimycobacterial drug susceptibility testing
Antimicrobial susceptibility testing was performed on Sensititre SLOMYCO^®^ plates (Thermo Fisher Scientific, United States) according to Clinical and Laboratory Standards Institute (CLSI) guidelines (Parrish, 2023). Minimal inhibitory concentrations (MICs) determined within the concentration range of 0.0625–128 mg/mL were performed for a total of 17 antimicrobial agents (Table 1). The MIC is defined as the lowest concentration of antibiotic that inhibits visible mycobacterial growth. In this work, MIC test results were interpreted based on CLSI-recommended breakpoints (Parrish, 2023). The abovementioned M. kansasii reference strain was tested along with each batch of isolates as a quality control measure. Drug concentrations that inhibited the growth of tested isolates by 50 and 90% were expressed as MIC_50_ and MIC_90_ values, respectively.
Statistical analysis
All statistical analyses were performed using SPSS software, version 24 (IBM, United States). Intergroup difference was deemed statistically significant for results with p < 0.05. Drug MIC distributions for the 153 isolates were analyzed using GraphPad Prism software (version 7.00, La Jolla, CA, United States).
Sequence information
The WGS data has been submitted to the National Center for Biotechnology Information (NCBI) with the Bio project number of PRJNA925290 or submission ID: SUB12542119.
Results
Identification and genotyping
All 153 isolates were ultimately classified as M. kansasii based on ANI values, which indicated that the genome sequence of each isolate shared >95% identity with that of the M. kansasii reference strain ATCC 12478 (Figure 1). The 153 M. kansasii representatives were differentiated into 3 clusters with 141 genotypes, including 17 isolates from a cluster (2–9 isolates per cluster) and 136 isolates with unique patterns (Figure 2). The clustering rate of M. kansasii was 11.1% (17/153).
Pairwise comparisons of ANIs of M. kansasii subtypes I-VI. The heatmap displayed the Average Nucleotide Identity (ANI) values among 153 M. kansasii strains and the standard MKC strains. The color gradients in the heatmap represent different intensity levels of values. Red areas indicate higher ANI values, while blue areas signify lower ANI values. The bar chart on the left corresponds to different MKC species and conducts a clustering analysis of the samples.
Phylogenetic tree based on core SNP. All 153MKC strains were divided into three clusters, with each cluster represented by a unique color. The outlying circles depicted the outcomes of the drug sensitivity tests. Distinct colors were employed to signify various drugs. Solid circles denoted drug resistance, while hollow circles represented intermedia.
Virulence factor-encoding gene
Referring to the filter threshold of the reference virulence gene, homologous genes with a coverage of 80% and a similarity of 80% were listed in Figure 3. The EXS-1, EXS-3 and EXS-5 regions were involved in all isolates. And fbpA, fbpB, fbpC, hbhA, ideR, mbtH, mgtC, and phoP gene were present in all M. kansasii subtype I strains.
Virulence factors in M. kansasii from different sources. The heatmap displayed the identity of multiple virulence genes. The horizontal axis is labeled with samples while the vertical axis enumerates individual virulence genes. A color—coded gradient is employed to depict the degree of identity among the genes. A score of 100 is represented by red, signifying a high level of sequence similarity, conversely, a light blue color corresponds to an identity score of 0, indicating a lack of significant similarity.
Drug susceptibility testing
For the antimicrobial agents with the breakpoint values recommended by CLSI, rifabutin (RFB) and clarithromycin (CLA) were the most highly active against M. kansasii strains, with the susceptibility rate of 100% and 99.35%, respectively. Followed by amikacin (AMK) and linezolid (LZD), the resistance rate was 5.88% and 7.19%, respectively (Table 1). For the fluoroquinolones, the resistance rate to ciprofloxacin (CIP) and moxifloxacin (MXF) was 12.42% and 20.92%, respectively. Of the 22 isolates resistant to MXF, 10 isolates (45.45%) exhibited resistance to CIP (Supplementary Figure S1). The resistance rate to RIF was 22.22%. As for the antibiotics without breakpoint values, all isolates had very low MIC_50_ (0.03 μg/mL) and MIC_90_ (≤0.06 μg/mL) values against bedaquiline (BDQ), sutezolid (SZD), delamanid (DLM), and clofazimin (CFZ). Ethionamide (ETO) was also active against M. kansasii, with MIC_50_ and MIC_90_ values of 0.6 μg/mL and 2.5 μg/mL, respectively (Figure 4).
MIC distributions of M. kansasii clinical isolates. The solid blue line indicates the CLSI-recommended threshold for determining drug susceptibility, above which a resistant strain is considered. Drugs lacking critical values of MIC50 and MIC90 are denoted by dashed lines. MIC50: the minimum concentration of an antimicrobial agent required to inhibit the growth of 50% of the organisms. MIC90: the minimum concentration of an antimicrobial agent required to inhibit the growth of 90% of the organisms.
Association between drug resistance profiles and genotypes
Although no statistically significant associations between clusters and drug resistance profiles were observed, CLA, RIF, RFB, TMP/SMX, LZD, DOX, and AMK in cluster 3 were 1.18, 24.71, 1.18, 49.41, 8.24, 50.59, and 8.24% respectively, which exceeded corresponding rates observed for cluster 1 (0, 20, 0, 32.5, 7.5, 45, and 2.5%) and cluster 2 (0, 17.86, 0, 42.86, 0, 46.43, and 3.57%) isolates. Meanwhile, CIP and MXF resistance rates of cluster 3 (10.59 and 15.29%) isolates were lower than corresponding rates obtained for cluster 1 (12.50 and 30%) and cluster 2 (14.29 and 25%) isolates (Table 2).
Discussion
M. kansasii, the most pathogenic subspecies, is responsible for most NTM infections worldwide (Luo et al., 2021; Johnston et al., 2017). Previous studies in China have reported M. kansasii as predominant species, comprising 71.8% of MKC isolates, with 14.1% belonging to M. persicum (Li et al., 2016). In contrast, all MKC isolates analyzed in this study were classified as M. kansasii. The discrepancy may be attributed to the fact that M. persicum is an opportunistic pathogen, which primarily infects immunocompromised individuals, and thus was not detected in our cohort of immunocompetent patients (Taillard et al., 2003). Alternatively, M. kansasii isolates in this study may exhibit greater genetic homogeneity compared to those circulating in other regions of China (Mokrousov, 2017).
Intriguingly, the clustering rate observed in the current study (11%) was substantially lower than those reported in prior investigations (68–99.3%) (Taillard et al., 2003; Zhang et al., 2004; Bakula et al., 2018). This discrepancy may be attributed to methodological differences in typing methods used across studies. Earlier studies predominantly utilized variable number tandem repeat (VNTR)-based assays or pulsed-field gel electrophoresis (PFGE) for MKC typing (Taillard et al., 2003; Zhang et al., 2004; Bakula et al., 2018). However, compared to WGS, these conventional methods are more time-consuming, labor-intensive, resource-intensive, require a higher degree of expertise, and offer significantly lower discriminatory power, highlighting the superior of WGS as a high-throughput and high-resolution genotyping platform (Bakula et al., 2018).
The type-VII secretion system comprises five homologous secretion systems (ESX-1 to ESX-5), which are critical for the pathogenicity of both M. tuberculosis and M. kansasii (Guan et al., 2020). In this study, genes encoding the conserved components of the EXS-1, EXS-3, and EXS-5 system were detected in genomes of all 153 M. kansasii isolates. Additionally, esxG gene, which encodes an ESX-3 substrate known to enhance M. tuberculosis virulence by facilitating iron acquisition (Tufariello et al., 2016), was also universally present. Moreover, the fbpC gene, encoding an enzyme involved in transferring mycolic acid from trehalose monomycolate to the mycolyl-arabinogalactan complex (Favrot et al., 2013), was detected in 99.35% (152/153) of isolates. By contrast, results of another study conducted in China by Guo et al., revealed that the fbpC gene was absent in genomes of all M. kansasii isolates, while the esxG gene was detected in only 6.7% (4/60) of cases (Guo et al., 2022). We hypothesize that these discrepancies may reflect variations in the virulence profiles of M. kansasii strains circulating in different geographic areas.
Core treatment regimens for M. kansasii infections consist of RIF, INH, and EMB (Parrish, 2023). Nevertheless, the clinical utility of INH and EMB is limited, as their MIC values correlate poorly with treatment outcomes, rendering them unreliable prognostic indicators (Parrish, 2023). In this study, the RIF resistance rate was 22.22% (34/153), similar to that reported in Shanghai (20.0%) (Guo et al., 2022), but lower than that observed in Beijing, China (56.4%) (Li et al., 2016). Notably, our resistance rates were higher than those documented in Poland and Brazil, where all tested isolates remained fully susceptible to RIF (Bakuła et al., 2018; de Carvalho et al., 2019). These disparities suggest potential geographical variations in resistance patterns, possibly influenced by regional differences in antibiotic usage and susceptibility profiles (Bakuła et al., 2018). In cases of treatment failure associated with RIF resistance, DST for secondary antimicrobial agents should be conducted to identify effective alternatives and optimize therapeutic outcomes (Parrish, 2023). Consistent with previous findings, all isolates in this study remained susceptible to RFB, reinforcing its potential as an effective substitute for RIF in clinical practice (Guo et al., 2022).
The CLA susceptibility rate for our isolates was 99.35% (152/153), aligning with previous reports of <1% resistance (Guo et al., 2022; de Carvalho et al., 2019). However, another study reported a substantially higher CLA resistance rate (20.5%), possibly due to macrolide overuse driving resistance development (Li et al., 2016). Additionally, AMK and LZD exhibited excellent in vitro activities against M. kansasii, with sensitivity rates exceeding 90%, indicating them to be promising options for M. kansasii infections (Guo et al., 2022; de Carvalho et al., 2019). SZD, a newer oxazolidinone, also exhibited excellent in vitro activity against M. kansasii, consistent with previously reported (Yu et al., 2021; Zheng et al., 2023). Notably, BDQ, DLM, and CFZ, which are newer drugs used to treat multidrug-resistant tuberculosis cases, demonstrated consistent activity against M. kansasii in our study and previous research (Zheng et al., 2022), highlighting their potential as alternative therapies for M. kansasii infections.
This research has several limitations. First, as this retrospective study relied on tuberculosis DRS, the clinical information and treatment history were unavailable for patients diagnosed with M. kansasii pulmonary disease, who were discontinued from follow-up. Second, we did not collect MKC isolates from environmental sources to demonstrate the sources of clinical infections. Third, all M. kansasii isolates were obtained from patients in China and thus the conclusions drawn from an analysis of these isolates may not be generalizable to clinical isolates from other countries.
Conclusion
M. kansasii type I was the predominant genotype in China, and RFB and CLR presented strong activities against M. kansasii strains. Three clusters were separated based on core SNP throughout the genome. The new drugs BDQ, DLM, SZD and CFZ have the potential to be potent agents for the treatment of M. kansasii infection.
The reference list from the paper itself. Each links out to its DOI / PubMed record.
- 1Bakula Z.Brzostek A.Borowka P.Zaczek A.Szulc-Kielbik I.Podpora A.. (2018). Molecular typing of Mycobacterium kansasii using pulsed-field gel electrophoresis and a newly designed variable-number tandem repeat analysis. Sci. Rep. 8:4462. doi: 10.1038/s 41598-018-21562-z, PMID: 29535391 PMC 5849605 · doi ↗ · pubmed ↗
- 2Bakuła Z.Modrzejewska M.Pennings L.Proboszcz M.Safianowska A.Bielecki J.. (2018). Drug susceptibility profiling and genetic determinants of drug resistance in Mycobacterium kansasii. Antimicrob. Agents Chemother. 62:e 01788-17. doi: 10.1128/AAC.01788-17, PMID: 29437627 PMC 5913922 · doi ↗ · pubmed ↗
- 3Campo R. E.Campo C. E. (1997). Mycobacterium kansasii disease in patients infected with human immunodeficiency virus. Clin. Infect. Dis. 24, 1233–1238. doi: 10.1086/513666, PMID: 9195089 · doi ↗ · pubmed ↗
- 4de Carvalho L. D.de Queiroz Mello F. C.Redner P.Campos C. E. D.de Souza Caldas P. C.da Silva Lourenco M. C.. (2019). Drug susceptibility profile of Mycobacterium kansasii clinical isolates from Brazil. J. Glob. Antimicrob. Resist. 19, 228–230. doi: 10.1016/j.jgar.2019.05.003, PMID: 31100506 · doi ↗ · pubmed ↗
- 5Favrot L.Grzegorzewicz A. E.Lajiness D. H.Marvin R. K.Boucau J.Isailovic D.. (2013). Mechanism of inhibition of Mycobacterium tuberculosis antigen 85 by ebselen. Nat. Commun. 4:2748. doi: 10.1038/ncomms 3748, PMID: 24193546 PMC 4049535 · doi ↗ · pubmed ↗
- 6Griffith D. E.Aksamit T.Brown-Elliott B. A.Catanzaro A.Daley C.Gordin F.. (2007). An official ATS/IDSA statement: diagnosis, treatment, and prevention of nontuberculous mycobacterial diseases. Am. J. Respir. Crit. Care Med. 175, 367–416. doi: 10.1164/rccm.200604-571ST, PMID: 17277290 · doi ↗ · pubmed ↗
- 7Gu Z.Eils R.Schlesner M. (2016). Complex heatmaps reveal patterns and correlations in multidimensional genomic data. Bioinformatics 32, 2847–2849. doi: 10.1093/bioinformatics/btw 313, PMID: 27207943 · doi ↗ · pubmed ↗
- 8Guan Q.Ummels R.Ben-Rached F.Alzahid Y.Amini M. S.Adroub S. A.. (2020). Comparative genomic and transcriptomic analyses of Mycobacterium kansasii subtypes provide new insights into their pathogenicity and taxonomy. Front. Cell. Infect. Microbiol. 10:122. doi: 10.3389/fcimb.2020.00122, PMID: 32266172 PMC 7105574 · doi ↗ · pubmed ↗