Association between a laboratory-based frailty index and mortality of critically ill patients with acute pancreatitis: a retrospective study
Zhichao Zou, Zhe Li, Qihai Wan, Qianqian Wang, Yi Yu

TL;DR
A new lab-based frailty index is linked to higher mortality in critically ill patients with acute pancreatitis.
Contribution
This study introduces a novel laboratory-based frailty index and demonstrates its association with mortality in acute pancreatitis patients.
Findings
Each 0.1 increase in the frailty index (FI-Lab) raises 30-day and 90-day mortality risk by 30%.
The FI-Lab was associated with acute kidney injury and need for renal replacement therapy before matching.
Propensity score matching confirmed the mortality association but not the kidney-related outcomes.
Abstract
Acute pancreatitis (AP) is associated with significant global mortality and morbidity. Frailty, which can be assessed through clinical indicators and life history, is known to impact adverse outcomes across different medical conditions. The frailty index derived from laboratory tests (FI-Lab) is a novel approach to the quantification of frailty. This study sought to investigate the relationship between the FI-Lab and mortality among critically ill patients with AP. We utilized data on patients diagnosed with AP from the Medical Information Mart for Intensive Care-IV database. The FI-Lab was calculated using a specific set of laboratory parameters indicative of physiological disturbances. The primary outcomes examined were 30-day and 90-day mortality rates. Multivariate Cox regression was used for the statistical analysis, with adjustments for age, gender, Acute Physiology and Chronic…
Genes, proteins, chemicals, diseases, species, mutations and cell lines named across the full text — each resolved to its canonical identifier and authoritative record.
Click any figure to enlarge with its caption.
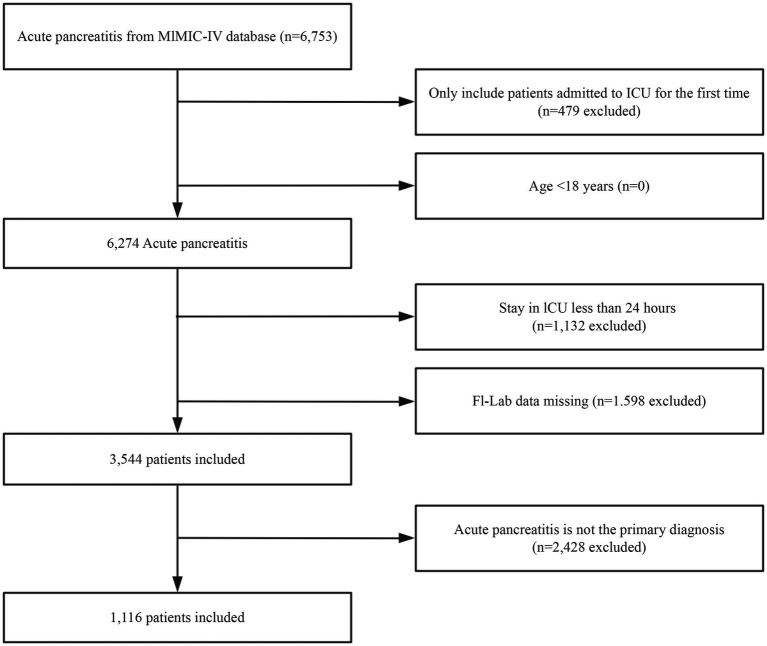 Figure 1
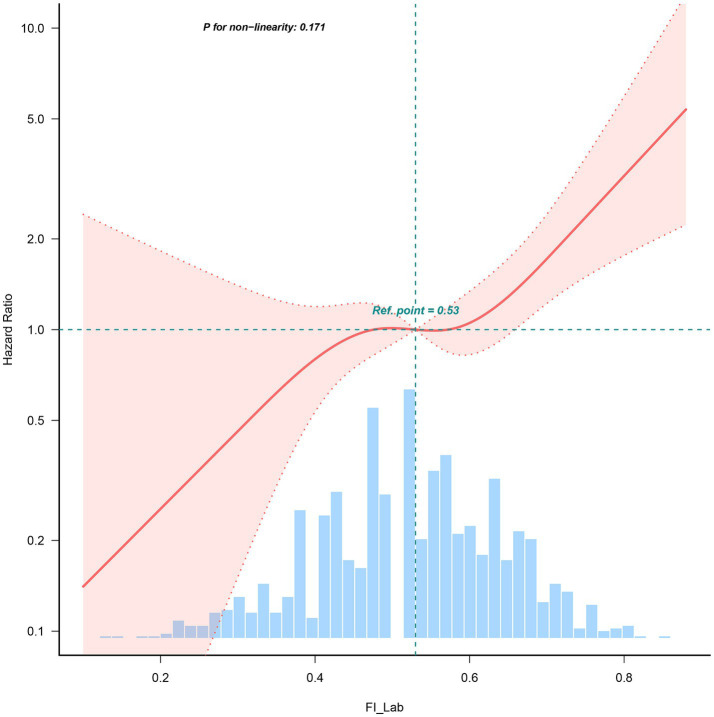 Figure 2
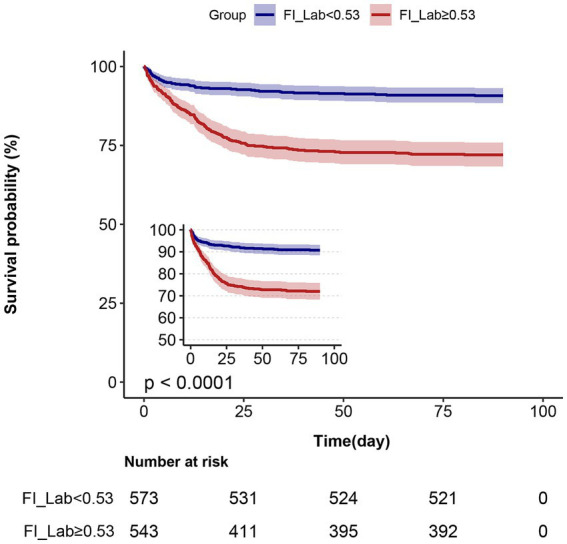 Figure 3
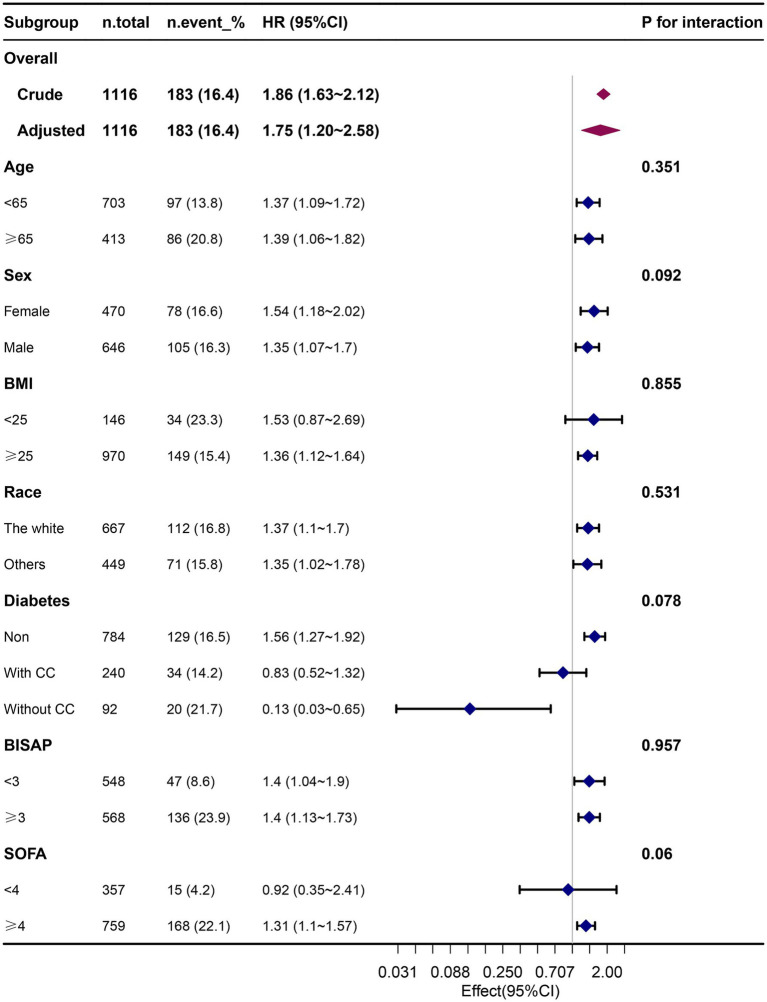 Figure 4
| Unmatched patients | Propensity-score–matched patients | ||||||
|---|---|---|---|---|---|---|---|
| Variables | Total ( | Low Fi-lab ( | High Fi-lab ( | SMD | Low Fi-lab ( | High Fi-lab ( | SMD |
| Age, y | 58.4 ± 17.2 | 57.09 ± 17.26 | 59.88 ± 17.07 | >0.1 | 59.24 ± 16.97 | 59.67 ± 17.39 | <0.1 |
| Sex, male, | 646 (57.9) | 345 (60.2) | 301 (55.4) | <0.1 | 204 (58.3) | 201 (57.4) | <0.1 |
| BMI, kg/m2 | 28.9 ± 5.4 | 28.89 ± 5.37 | 28.97 ± 5.48 | <0.1 | 28.85 ± 5.04 | 28.97 ± 4.95 | <0.1 |
| Race, | <0.1 | <0.1 | |||||
| White | 667 (59.8) | 333 (58.1) | 334 (61.5) | 216 (61.7) | 206 (58.9) | ||
| Others | 449 (40.2) | 240 (41.9) | 209 (38.5) | 134 (38.3) | 144 (41.1) | ||
| Marital status, | <0.1 | <0.1 | |||||
| Married | 480 (43.0) | 244 (42.6) | 236 (43.5) | 154 (44.0) | 148 (42.3) | ||
| Unmarried | 636 (57.0) | 329 (57.4) | 307 (56.5) | 196 (56.0) | 202 (57.7) | ||
| Insurance, | <0.1 | <0.1 | |||||
| Medicaid | 236 (21.1) | 129 (22.5) | 107 (19.7) | 78 (22.3) | 75 (21.4) | ||
| Medicare | 507 (45.4) | 257 (44.9) | 250 (46) | 160 (45.7) | 170 (48.6) | ||
| Private | 317 (28.4) | 157 (27.4) | 160 (29.5) | 96 (27.4) | 87 (24.9) | ||
| Others | 56 (5.0) | 30 (5.2) | 26 (4.8) | 16 (4.6) | 18 (5.1) | ||
| BISAP, | |||||||
| ≥3 | 568 (50.9) | 235 (41) | 333 (61.3) | >0.1 | 281 (49.4) | 273 (50.3) | <0.1 |
| Sepsis, | 763 (68.4) | 341 (59.5) | 422 (77.7) | >0.1 | 251 (71.7) | 247 (70.6) | <0.1 |
| Saps-ii | 36.2 ± 16.0 | 31.2 ± 12.9 | 41.4 ± 17.2 | >0.1 | 34.74 ± 13.18 | 35.99 ± 15.02 | <0.1 |
| SOFA score | 6.0 ± 4.1 | 4.6 ± 3.4 | 7.5 ± 4.3 | >0.1 | 5.61 ± 3.58 | 5.88 ± 3.50 | <0.1 |
| Charlson comorbidity index | 4.7 ± 2.9 | 4.4 ± 2.8 | 5.1 ± 2.8 | <0.1 | 4.67 (2.93) | 4.77 (2.94) | <0.1 |
| Hypertension, | 464 (41.6) | 252 (44) | 212 (39) | <0.1 | 137 (39.1) | 146 (41.7) | <0.1 |
| MI, | 106 (9.5) | 51 (8.9) | 55 (10.1) | <0.1 | 55.1 (9.7) | 53.5 (9.8) | <0.1 |
| CHF, | 199 (17.8) | 99 (17.3) | 100 (18.4) | <0.1 | 103.4 (18.1) | 105.2 (19.3) | <0.1 |
| CBVD, | 48 (4.3) | 21 (3.7) | 27 (5) | <0.1 | 23.9 (4.2) | 23.3 (4.3) | <0.1 |
| CPD, | 219 (19.6) | 127 (22.2) | 92 (16.9) | <0.1 | 107.4 (18.8) | 105.0 (19.3) | <0.1 |
| Diabetes, | <0.1 | <0.1 | |||||
| None | 784 (70.3) | 406 (70.9) | 378 (69.6) | 387.5 (67.9) | 380.8 (70.0) | ||
| Without complications | 240 (21.5) | 117 (20.4) | 123 (22.7) | 133.8 (23.5) | 115.5 (21.2) | ||
| With complications | 92 (8.2) | 50 (8.7) | 42 (7.7) | 49.2 (8.6) | 47.8 (8.8) | ||
| Renal disease, | 211 (18.9) | 96 (16.8) | 115 (21.2) | >0.1 | 74 (21.1) | 67 (19.1) | <0.1 |
| Malignant cancer, | 106 (9.5) | 39 (6.8) | 67 (12.3) | >0.1 | 30 (8.6) | 28 (8.0) | <0.1 |
| Severe liver disease, | 103 (9.2) | 30 (5.2) | 73 (13.4) | >0.1 | 28 (8.0) | 22 (6.3) | <0.1 |
| AKI, | 679 (60.8) | 280 (48.9) | 399 (73.5) | >0.1 | 216 (61.7) | 217 (62.0) | <0.1 |
| RRT, | 87 (7.8) | 9 (1.6) | 78 (14.4) | >0.1 | 9 (2.6) | 5 (1.4) | <0.1 |
| Vasoactive drug, | 348 (31.2) | 134 (23.4) | 214 (39.4) | >0.1 | 101 (28.9) | 105 (30.0) | <0.1 |
| Ventilation, | 428 (38.4) | 187 (32.6) | 241 (44.4) | >0.1 | 129 (36.9) | 133 (38.0) | <0.1 |
| Variable | Unadjusted Model | Model 1 | Model 2 | Model 3 | Model 4 | PSM |
|---|---|---|---|---|---|---|
| HR 95% CI | HR 95% CI | HR 95% CI | HR 95% CI | HR 95% CI | HR 95% CI | |
| 30-day mortality | ||||||
| FI-Lab (per 0.1 score) | 1.86 (1.63–2.12) | 1.86 (1.63–2.13) | 1.32 (1.13–1.53) | 1.27 (1.09–1.49) | 1.28 (1.09–1.52) | 1.39 (1.11–1.73) |
| FI-Lab (as a categorical variable) | ||||||
| <0.53 | 1 (Ref) | 1 (Ref) | 1 (Ref) | 1 (Ref) | 1 (Ref) | 1 (Ref) |
| ≥0.53 | 3.52 (2.51–4.92) | 3.39 (2.42–4.75) | 1.72 (1.19–2.48) | 1.58 (1.09–2.29) | 1.51 (1.03–2.2) | 1.69 (1.07–2.67) |
| 90-day mortality | ||||||
| FI-Lab (per 0.1 score) | 1.85 (1.64–2.10) | 1.86 (1.63–2.11) | 1.31 (1.14–1.51) | 1.26 (1.09–1.47) | 1.27 (1.09–1.48) | 1.39 (1.13–1.72) |
| FI-Lab (as a categorical variable) | ||||||
| <0.53 | 1 (Ref) | 1 (Ref) | 1 (Ref) | 1 (Ref) | 1 (Ref) | 1 (Ref) |
| ≥0.53 | 3.34 (2.44–4.57) | 3.23 (2.36–4.42) | 1.62 (1.15–2.29) | 1.49 (1.06–2.11) | 1.43 (1.01–2.04) | 1.67 (1.08–2.57) |
| Variable | Length of stay in the ICU (days) | Length of stay in the hospital (days) | ||||
|---|---|---|---|---|---|---|
| Model 1 | Model 2 | PSM | Model 1 | Model 2 | PSM | |
| FI-Lab (per 0.1 score) | 0.95 (0.64–1.26) | −0.01 (−0.31 to 0.29) | 0.18 (−0.16 to 0.52) | 2.02 (1.27–2.76) | 0.32 (−0.51 to 1.15) | 0.35 (−0.65 to 1.36) |
| FI-Lab (as a categorical variable) | ||||||
| <0.53 | 0 (Ref) | 0 (Ref) | 0 (Ref) | 0 (Ref) | 0 (Ref) | 0 (Ref) |
| ≥0.53 | 1.95 (1.18–2.72) | 0.21 (−0.51 to 0.92) | 0.24 (−0.5 to 0.97) | 3.72 (1.85–5.59) | 0.42 (−1.55 to 2.39) | 0.26 (−1.91 to 2.44) |
| Variable | AKI | CRRT | ||||
|---|---|---|---|---|---|---|
| Model 1 | Model 2 | PSM | Model 1 | Model 2 | PSM | |
| OR (95%CI) | OR (95%CI) | OR (95%CI) | OR (95%CI) | OR (95%CI) | OR (95%CI) | |
| FI-Lab (per 0.1 score) | 1.73 (1.55–1.93) | 1.33 (1.16–1.52) | 1.05 (0.9–1.23) | 2.79 (2.21–3.53) | 1.68 (1.22–2.3) | 0.98 (0.46–2.09) |
| FI-Lab (as a categorical variable) | ||||||
| <0.53 | 1 (Ref) | 1 (Ref) | 1 (Ref) | 1 (Ref) | 1 (Ref) | 1 (Ref) |
| ≥0.53 | 2.9 (2.26–3.73) | 1.83 (1.34–2.48) | 0.98 (0.69–1.39) | 10.51 (5.22–21.18) | 4.69 (1.98–11.12) | 0.71 (0.15–3.36) |
Peer Reviews
No public reviews on file for this paper yet. If you reviewed it on a platform where reviews are public (OpenReview, ICLR, NeurIPS, ICML), you can paste yours below so the community can read it here.
Videos
No videos yet. Explain this paper in a talk, walkthrough, or lecture? Add one.
Taxonomy
TopicsFrailty in Older Adults · Healthcare cost, quality, practices · Nutrition and Health in Aging
Introduction
Acute pancreatitis (AP) is one of the most prevalent gastrointestinal emergencies in clinical practice, and its global incidence is rising. Annually, it accounts for over 288,220 hospital admissions and contributes to costs exceeding $2.2 billion in the United States alone (1). The clinical presentations of AP range from mild, self-limiting conditions to severe cases characterized by multi-organ failure, systemic inflammatory response syndrome, and the need for admission to an intensive care unit (ICU) to provide close monitoring and aggressive treatment (2, 3). Assessing the prognosis of critically ill patients with AP remains a significant challenge in both clinical and scientific contexts. Traditional tools for assessment, such as the Acute Physiology and Chronic Health Evaluation, Ranson’s Criteria, Modified Glasgow Score, Systematic Inflammatory Response Syndrome Score, and the Bedside Index for Severity of AP (BISAP), have demonstrated limitations in their ability to predict short- and long-term mortality, particularly in contexts pertaining to the prognosis of the individual (4, 5). Therefore, there is an urgent need for a new and more accurate tool to predict the prognosis of patients with severe acute pancreatitis, in order to provide a scientific basis for clinical decision-making.
The concept of frailty was introduced to critical care medicine following in-depth studies on the pathophysiological mechanisms of critically ill patients (6). Frailty is associated with advanced age, chronic disease, malnutrition, and multisystem functional decline, reflecting a reduced physiological reserve capacity to cope with stressors (7). It is a biological syndrome resulting from decreased physiological reserves of multiple organs (8). Over the past decade, substantial research has demonstrated the utility of frailty status as a prognostic indicator for adverse events and complications related to various clinical treatments, including pancreatoduodenectomies, pancreatic resections, kidney transplants, percutaneous coronary interventions, and colectomies (9–14). Notably, frailty status remains under-explored as a predictor in patients with AP.
Timely recognition of frailty is challenging, requiring specialized tools and face-to-face assessments such as grip strength measurements. The frailty index based on laboratory tests (FI-Lab) proposed by Howlett et al. consists of several objective laboratory tests and vital signs that can be constructed easily through routine clinical practice (15). The FI-Lab has demonstrated good diagnostic accuracy and the ability to predict clinical outcomes in diverse patient populations (16–21). In such patient populations, the FI-Lab may be more appropriate for assessing frailty in ICU patients with AP.
The objective of this study was to calculate the FI-Lab and investigate its relationship with patients’ prognoses by analyzing clinical data from ICU patients with AP from the Medical Information Mart for Intensive Care-IV (MIMIC-IV 3.0) database (2008–2022). We hypothesized that there would be a strong correlation between the FI-Lab and the clinical outcomes of patients with severe AP. Furthermore, we also hypothesized that patients with severe AP and higher FI-Lab scores would have longer ICU stays and a higher risk of death. Hence, this study aimed to provide new perspectives and tools to assess the prognoses of AP in critically ill patients, thereby informing clinical decision-making.
Materials and methods
We selected patients with AP from the MIMIC-IV database (version 3.0), which contained 546,028 inpatient records and 94,458 ICU records of patients treated at the Beth Israel Deaconess Medical Center in Boston, United States, from 2008 to 2022 (22). One of the study’s co-authors, Yi Yu, had authorized access to the database (certificate ID: 6477678). The research process followed the Strengthening the Reporting of Observational Studies in Epidemiology (STROBE) guidelines (23).
Study population and data extraction
The subjects of this study were patients diagnosed with AP, based on the International Classification of Diseases (ICD)-9 and ICD-10 codes. We focused only on patients with AP who were admitted to the ICU for the first time. Patients were excluded from the study based on the following criteria: (i) age <18 years, (ii) ICU stay <24 h, (iii) primary diagnosis not AP with more than 3 diagnostic codes, or (iv) missing more than 12 data points required to analyze the FI-Lab. We collected information on patients’ demographics, vital signs, laboratory results, comorbidities, clinical severity scores, and other relevant characteristics.
Construction of the FI-lab
The FI-Lab was obtained using 33 items, including 30 laboratory test results (obtained from 24 h before to 48 h after the first ICU admission). These results included the findings of blood tests (white blood cell and platelet counts; hemoglobin, total bilirubin, alanine transaminase, albumin, alkaline phosphatase, lactate dehydrogenase, urea nitrogen, creatinine, glucose, potassium, sodium, calcium, phosphorus, fibrinogen, and troponin T levels; plasminogen time; international normalized ratio; and activated partial thromboplastin time), arterial blood gas analyses (pH, partial pressure of oxygen, partial pressure of carbon dioxide, and lactate levels), urinalysis (leukocyte and erythrocyte counts and the levels of protein, glucose, ketone bodies, and bilirubin), and the following three vital signs (averaged over the first day in the ICU): systolic blood pressure, diastolic blood pressure, and heart rate. Each item was dichotomized based on the normal reference ranges provided in the database: values within the reference interval were assigned a score of 0, and values outside the reference interval were assigned a score of 1. The reference values for each item are detailed in the Supplementary Table S1. FI-Lab values were calculated by summing the scores for all items and dividing the sum by the total number of items. Thus, the FI-Lab ranged from 0 to 1.
We used a generalized additive model to identify the nonlinear relationship. If a nonlinear correlation was observed, a two-piecewise linear regression model was conducted to calculate the threshold effect of the FI-lab on mortality in terms of the smoothing plot.
Covariates
In addition to the indicators used to calculate the FI-Lab, we collected demographic and admission data, including age, sex, race, body mass index (BMI), marital status, insurance type, BISAP, Simplified Acute Physiology Score II (SAPS II), and Sequential Organ Failure Assessment (SOFA) scores. Comorbidity information included myocardial infarction, congestive heart failure, cerebrovascular disease, diabetes, renal disease, malignancy, severe liver disease, and sepsis. We also recorded patient interventions during their ICU stays, such as their use of mechanical ventilation, vasopressors, and continuous renal replacement therapy (CRRT). Multicollinearity was assessed using variance inflation factor analysis, with a variance inflation factor >2 as indicative.
Outcomes
The primary outcomes of interest were the 30-day and 90-day mortality rates of patients with AP. Secondary outcomes included ICU and hospital-stay duration, acute kidney injury (AKI), and CRRT.
Statistical analysis
The baseline characteristics of the patients were analyzed by group (low FI-Lab and high FI-Lab). Categorical data are presented as numbers (percentages), while continuous data were presented as means ± standard deviation or medians (interquartile ranges), as appropriate. Statistical analyses, including analysis of variance (ANOVA) or rank-sum tests were used to assess group differences in the continuous variables. We used the chi-square test or Fisher’s exact test to evaluate group differences in categorical variables.
The proportion of missing covariate data was less than 1% in all of the analyses. We imputed missing values for covariates using the median. The relationship between the FI-Lab and mortality risk was described using restricted cubic spline (RCS) curves. We conducted multivariate Cox regression analyses to evaluate the independent association between the FI-Lab and mortality, using adjusted models to account for the various covariates; four models were used in the regression analyses. Furthermore, we conducted logistic regression analyses to assess the risk of AKI and CRRT, along with linear regression analyses to evaluate ICU and hospital lengths of stay. Further analyses were adjusted for relevant covariates, subgroup analyses, and interaction analyses, comparing differences in the FI-Lab (as a continuous variable) between the survival and non-survival groups. To enhance the reliability of the results, we performed propensity score matching (PSM) to balance the baseline characteristics between the two groups, using a 1:1 nearest neighbor matching algorithm with a caliper of 0.2.
We evaluated the hospitalization survival rates based on the FI-Lab groups using Kaplan–Meier survival curves and assessed them using the log-rank test. Stratified and interaction analyses were performed based on age (<65 years or ≥ 65 years), sex (male or female), race (White or other), BMI (<25 or ≥ 25), diabetes (none, without complications, with complications), SOFA score of <4 or ≥4 and the BISAP severity score of <3 or ≥3.
All statistical analyses were conducted using STATA software (version 17.0), R software packages (http://www.R-project.org, R Foundation), and Free Statistics software version 1.8 (24). Statistical significance was considered at p < 0.05 (two-tailed).
Results
Participants
A total of 6,753 patients met the diagnostic criteria for AP. After removing participants with repeated ICU admissions, patients under the age of 18, patients for which AP was not the primary diagnosis, and those with an ICU stay of less than 24 h, the final cohort consisted of 1,116 patients (The baseline information for the excluded populations due to missing data is illustrated in Supplementary Table S2). The selection process for the study participants is illustrated in Figure 1.
Flowchart outlining the process for enrollment of study participants.
Linear relationship between the FI-lab and mortality
Restricted Cube Spline analysis revealed a linear relationship between the FI-Lab during ICU admission and the risk of mortality during the hospitalization of patients with AP (P for non-linearity: 0.171). Specifically, when the FI-Lab was 0.53, its Hazard Ratio (HR) was 1. Overall, with an increase in the FI-Lab, the risk of mortality in AP patients increased accordingly, as illustrated in Figure 2.
Spline curves showing the association of the FI-Lab as a continuous variable with 30-day mortality. The spline curves were adjusted for all factors of model 4 in multivariable Cox regression.
Baseline characteristics
This study included 1,116 patients with a mean age of 58.4 ± 17.2 years, of whom 57.9% were men. Table 1 presents the baseline characteristics of the patient population. Comparatively, the low FI-Lab group tended to be younger, with lower SAPS-II and SOFA scores, vasoactive drug usage, sepsis, ventilation rates, and Rapid Response Team rates.
Relationship between the FI-lab and mortality
Significant associations of the FI-Lab with 30-day mortality (hazard ratio (HR) = 1.86, 95% CI: 1.63–2.12, p < 0.001) and 90-day mortality (HR = 1.85, 95% CI: 1.64–2.10, p < 0.001) were observed in the univariate analysis of mortality risk (Table 2).
Subsequently, in the extended multivariate Cox regression analysis (Table 2), the HRs of the FI-Labs remained consistently significant across all models for both the 30-day (HR range 1.30–1.86, p < 0.001 for all) and 90-day (HR range 1.28–1.86, p < 0.001 for all) mortality. After adjusting for all the covariates in Table 2, a 30% increase in the 30-day mortality risk (HR = 1.30, 95% CI: 1.10–1.53, p < 0.001, model 4) and a 30% increase in the 90-day mortality risk (HR = 1.45, 95% CI: 1.11–1.52, p < 0.001, model 4) were observed. The results from these models were robust.
We likewise did Area Under the Receiver Operating Characteristic curve (AUROC) analyses to clarify the ability of FI-Lab to distinguish survivors from non-survivors. This information will provide valuable insights into the value of FI-Lab in clinical practice (Supplementary Figure S1).
Kaplan–Meier survival curve analysis
The Kaplan–Meier survival curves are presented in Figure 3. After grouping patients into two FI-Lab categories, the cumulative survival time during hospitalization was significantly lower as the FI-Lab increased (log-rank test, p < 0.001).
Kaplan–Meier survival curves, categorized by the FI-Lab, for patients with acute pancreatitis at day 90.
Associations of the FI-lab with ICU and hospital stays
After incorporating all of the covariates listed in Table 3 into our models, no association was observed between patients’ ICU length of stay and FI-Lab levels when the FI-Lab increased (per 0.1) (β (95% CI) = −0.01 (−0.31 to 0.29)). Similarly, no association was found between length of stay and increasing FI-Lab (per 0.1) [β (95% CI) = 0.32 (−0.51 to 1.15)]. The same results were obtained when the FI-Lab was treated as a dichotomous variable, i.e., no significant differences found between the high and low FI-Lab groups [β (95% CI) = 0.21 (−0.51 to 0.92) and 0.42 (−1.55 to 2.39), respectively; Table 3].
As seen in Table 4, the risk for developing AKI on day 7 and CRRT requirements were 33 and 68% higher, respectively, with a 0.1 increase in FI-Lab [odds ratios (ORs; 95% CIs) = 1.33 (1.16–1.52) and 1.68 (1.22–2.3), respectively]. The same results were obtained when the FI-Lab was treated as a dichotomous variable, with a higher risk for AKI observed in the high FI-Lab group than in the low FI-Lab group [ORs; 95% CIs = 1.83 (1.34–2.48) and 4.69 (1.98–11.12), respectively].
Subgroup and sensitivity analyses
The results of our subgroup analysis indicated that the relationship between the FI-Lab and mortality remained robust and reliable, with no significant interaction observed in the subgroups (p-value for the interaction >0.05) (Figure 4).
Association between the FI-Lab and 90-day mortality in relation to the baseline characteristics.
After conducting the PSM, the two groups consisted of 350 well-matched pairs (n = 700), with no significant differences found in the key indicators between the matched groups (Table 1).
Our findings remained robust across the Cox regression models in Table 2, showing a 48% increase in the 30-day mortality risk (per 0.1) (HR = 1.48, 95% CI: 1.17–1.87, p < 0.001) and a 37% increase in the 90-day mortality risk (per 0.1) (HR = 1.37, 95% CI: 1.16–1.62, p < 0.001). When treating the FI-Lab as a categorical variable, the HR of the FI-Lab remained consistently significant across all models (HR range 1.72–3.52, p < 0.001 for all) for 30-day delirium. A similar trend was observed for 90-day delirium (Table 2). This analysis also showed no significant association between the ICU and hospital length of stay with FI-Lab (Table 3). Moreover, this analysis found that the risk for AKI on day 7 and CRRT requirements were not significantly associated with the FI-Lab, whether it was treated as a continuous or categorical variable (Table 4).
Discussion
Main findings
Our study presents one of the most comprehensive cohort-analyses of the association of the FI-Lab with the mortality of ICU patients with AP. We observed that an elevated FI-Lab level significantly increased the risk of 30-day and 90-day mortality, and these findings remained robust across various analyses, including those that adjusted for confounders using PSM. Subgroup analyses and Kaplan–Meier curves further corroborated these trends. The RCS curve analysis found a linear relationship between the FI-Lab and mortality risk, indicating that higher FI-Lab levels were associated with increased mortality. This finding suggests that the FI-Lab serves as valuable prognostic markers, which can clinicians in assessing outcomes of ICU patients with AP. Overall, an elevated FI-Lab among ICU patients with AP may indicate a poor prognosis, supporting clinical decision-making and risk stratification.
Effects of the FI-lab and mortality of critically ill AP patients
The novel frailty index, FI-Lab, has consistently demonstrated robust prognostic and predictive value across various disease states (16, 25, 26). Recent studies indicate that the FI-Lab can effectively predict in-hospital mortality among critically ill ICU patients, and its integration with other frailty measures may enhance the identification of patients with an elevated risk for in-hospital mortality (25). However, research on the application of FI-Lab specifically in ICU patients with AP remains limited. Our study addresses this gap, representing the first systematic investigation into the use of the FI-Lab with ICU patients who have AP.
The findings of our study are consistent with previous research, indicating that frailty is independently associated with increased mortality and readmission rates of patients with acute biliary pancreatitis, thereby reinforcing the prognostic significance of frailty indices in AP patients (27). One study highlights the utility of dynamic frailty assessments as a management tool in cases of necrotizing pancreatitis, suggesting that the FI-Lab may function similarly in AP scenarios (28). Our study corroborates findings that identify frailty as a factor associated with heightened mortality risk, complications, and increased healthcare costs among patients with AP (29). The frailty risk score serves as a valuable risk stratification tool for assessing the prognosis of AP patients, further emphasizing the relevance of the FI-Lab in the prognostic evaluation of this condition (30, 31).
To ensure robustness in our analysis, we employed PSM to adjust for confounding variables (32). An elevated FI-Lab was identified as a significant risk factor for increased mortality in patients with AP. More importantly, mortality increased with a higher FI-Lab, even after the adjustments for PSM and potential confounders.
It is critical to recognize that frailty is a reversible condition; it is potentially preventable and treatable. Therefore, identifying frailty in ICU patients is essential, along with implementing appropriate management strategies, such as encouraging physical activity and providing nutritional supplements. Such interventions could significantly enhance patient outcomes (33, 34).
Associations of ICU and hospital lengths of stay with FI-lab levels
No significant association was observed between FI-Lab levels and the length of ICU or hospital stays. Regardless of whether the FI-Lab was analyzed as a continuous or dichotomous variable (high vs. low FI-Lab), none of the increases in the FI-Lab was associated with prolonged ICU or hospital stays.
It is essential to consider other potential confounders. The frail state of a patient may indirectly influence their recovery and management of complications, thereby affecting their hospital length of stay. For instance, frail patients might experience a delayed recovery due to impaired immune functioning or poor nutritional status, leading to an extended hospitalization (35–37). However, this indirect effect was not observed in our simple regression analysis, indicating a need for more complex multivariate models in future research to explore these relationships further.
Associations between the incidence of AKI, CRRT requirements, and levels of FI-lab
In contrast to the findings related to the hospital and ICU stays, our results demonstrated a significant positive association of FI-Lab level, with AKI incidence and CRRT requirements. Specifically, an increase of 0.1 on the FI-Lab was associated with a 33% higher risk of AKI and a 68% higher risk of requiring CRRT. This finding aligns with previous research, suggesting that frailty is an important prognostic factor in critically ill patients, particularly those with renal dysfunction. For instance, studies have reported that frailty significantly elevates the risk of AKI among critically ill patients (38, 39). Another study found that frail patients are at a higher risk of experiencing AKI and require more CRRT following cardiac surgery (40). These findings corroborate our observations and underscore the predictive value of the FI-Lab for the necessary monitoring and treatment of AKI and CRRT. Thus, our study adds to the growing body of literature supporting frailty as an independent risk factor for AKI across various clinical contexts.
However, following the PSM analysis, we found no significant associations between the FI-Lab with AKI and CRRT requirements. This finding may suggest that selection bias or other confounding variables played a role in the results of the initial analyses. Nevertheless, this does not entirely rule out the potential impact of frailty on acute complications. Therefore, further studies should use larger sample sizes and additional covariates to validate these relationships.
Strengths of our study
Our study has several notable strengths. First, we utilized a comprehensive and publicly accessible database, which enhances the reliability and comprehensiveness of our data. Second, to the best of our knowledge, no previous study has examined the specific impact of the FI-Lab on mortality risk in ICU patients diagnosed with AP. Our findings provide robust and conclusive evidence that the elevated FI-Lab levels are strongly associated with the poor prognoses observed in this patient population. Third, we conducted multiple regression and PSM analyses to ensure the robustness and reliability of our results. This rigorous analytical approach further strengthens the credibility and internal validity of our findings. Fourth, the FI-Lab is based on readily available laboratory indicators and vital signs; hence, it is relatively simple to calculate and has the potential for widespread clinical application. Clinicians can use the FI-Lab to identify high-risk groups among patients with severe AP at an early stage, thereby facilitating timely intervention and optimization of treatment strategies. For instance, patients with high FI-Lab levels may benefit from more aggressive monitoring and treatments, including frequent laboratory tests and enhanced organ function support.
Limitations of our study
Although this study represents the most comprehensive investigation to date on the use of a FI-Lab for assessing and treating ICU patients with AP, it has several limitations. First, the FI-Labs of patients was measured only at the time of ICU admission; thus, their FI-Labs may have changed with the patient’s condition during hospitalization. Dynamic changes in the FI-Lab could be captured through continuous monitoring, and the prognostic significance of such changes in ICU patients with sepsis, remains unclear, warranting further exploration. Second, the generalizability of our findings may be limited as the study was conducted using data from a single ICU in the USA. Third, some factors known to influence AP mortality were not reported in the available studies, such as the timing of appropriate antibiotic administration, volume resuscitation, history of alcohol consumption, and phosphorus levels. Therefore, we could not analyze these potentially important confounders. Fourth, as this was not an experimental study, our research design prevented us from evaluating the causal effects of the FI-Lab. Fifth, FI-Lab is an objective, automated measure based on readily available laboratory values, making it feasible for large-scale implementation in ICU settings. That said, FI-Lab may not capture (functional, cognitive and other) aspects of frailty. Moreover, our study focused primarily on 30-day and 90-day mortality, without any long-term follow-ups to assess the utility of the FI-Lab in evaluating long-term prognoses. Randomized controlled trials would be better suited to address these questions. Nevertheless, some of these limitations are partially mitigated by the large sample size and use of the PSM to reduce confounding biases.
Conclusion
This study demonstrates a strong association between elevated FI-Lab levels and poor prognoses of ICU patients with AP. The implementation of FI-Lab as a prognostic tool has the potential to aid in early risk stratification of high-risk patients upon ICU admission, thereby improving clinical outcomes. However, further studies with experimental designs (i.e., randomized controlled trials) are essential to validate these findings and confirm proposed hypotheses.
The reference list from the paper itself. Each links out to its DOI / PubMed record.
- 1Peery AF Crockett SD Murphy CC Jensen ET Kim HP Egberg MD. Burden and cost of gastrointestinal, liver, and pancreatic diseases in the United States: update 2021. Gastroenterology. (2022) 162:621–44. doi: 10.1053/j.gastro.2021.10.017, PMID: 34678215 PMC 10756322 · doi ↗ · pubmed ↗
- 2Mederos MA Reber HA Girgis MD. Acute pancreatitis: a review. JAMA. (2021) 325:382–90. doi: 10.1001/jama.2020.20317, PMID: 33496779 · doi ↗ · pubmed ↗
- 3Dellinger EP Forsmark CE Layer P Levy P Maravi-Poma E Petrov MS. Determinant-based classification of acute pancreatitis severity: an international multidisciplinary consultation. Ann Surg. (2012) 256:875–80. doi: 10.1097/SLA.0b 013e 318256 f 778, PMID: 22735715 · doi ↗ · pubmed ↗
- 4Sinonquel P Laleman W Wilmer A. Advances in acute pancreatitis. Curr Opin Crit Care. (2021) 27:193–200. doi: 10.1097/MCC.000000000000080633464002 · doi ↗ · pubmed ↗
- 5Trikudanathan G Wolbrink DR Jvan Santvoort HC Mallery S Freeman M Besselink MG. Current concepts in severe acute and necrotizing pancreatitis: an evidence-based approach. Gastroenterology. (2019) 156:1994–2007.e 3. doi: 10.1053/j.gastro.2019.01.269, PMID: 30776347 · doi ↗ · pubmed ↗
- 6De Biasio JC Mittel AM Mueller AL Ferrante LE Kim DH Shaefi S. Frailty in critical care medicine: a review. Anesth Analg. (2020) 130:1462–73. doi: 10.1213/ANE.0000000000004665, PMID: 32384336 PMC 7426653 · doi ↗ · pubmed ↗
- 7Dent E Martin FC Bergman H Woo J Romero-Ortuno R Walston JD. Management of Frailty: opportunities, challenges, and future directions. Lancet. (2019) 394:1376–86. doi: 10.1016/S 0140-6736(19)31785-4, PMID: 31609229 · doi ↗ · pubmed ↗
- 8At J Bryce R Prina M Acosta D Ferri CP Guerra M. Frailty and the prediction of dependence and mortality in low- and middle-income countries: a 10/66 population-based cohort study. BMC Med. (2015) 13:138. doi: 10.1186/s 12916-015-0378-4, PMID: 26063168 PMC 4481121 · doi ↗ · pubmed ↗