Association between dietary index for gut microbiota and osteoarthritis in the US population: the mediating role of systemic immune-inflammation index
Jiulong Song, Jian Fu

TL;DR
A higher gut microbiota-friendly diet is linked to lower osteoarthritis risk in the US, partly due to reduced inflammation.
Contribution
This study introduces the mediating role of systemic immune-inflammation index in the DI-GM and OA relationship.
Findings
Higher DI-GM scores were associated with significantly reduced OA risk (OR: 0.83).
DI-GM showed a non-linear relationship with OA risk, as revealed by restricted cubic splines.
SII mediated 12.69% of the association between DI-GM and OA.
Abstract
Osteoarthritis (OA) is one of the most prevalent chronic conditions among the elderly. The dietary index for gut microbiota (DI-GM) is a novel proposed indicator reflecting gut microbiome diversity. However, the role of DI-GM in OA remains unclear. This study thus aims to explore the association between DI-GM and the risk of OA and analyze the mediating roles of systemic immune-inflammation index (SII). We utilized data from the National Health and Nutrition Examination Survey (NHANES) spanning 2007-2018. OA was assessed through self-reported questionnaires, and dietary recall data were used to calculate the DI-GM. Univariate and weighted multivariate logistic regression analyses were employed to evaluate the association between DI-GM and OA, the weighted linear regression analyses were employed to investigate the association of DI-GM with SII, while restricted cubic splines (RCS)…
Genes, proteins, chemicals, diseases, species, mutations and cell lines named across the full text — each resolved to its canonical identifier and authoritative record.
Click any figure to enlarge with its caption.
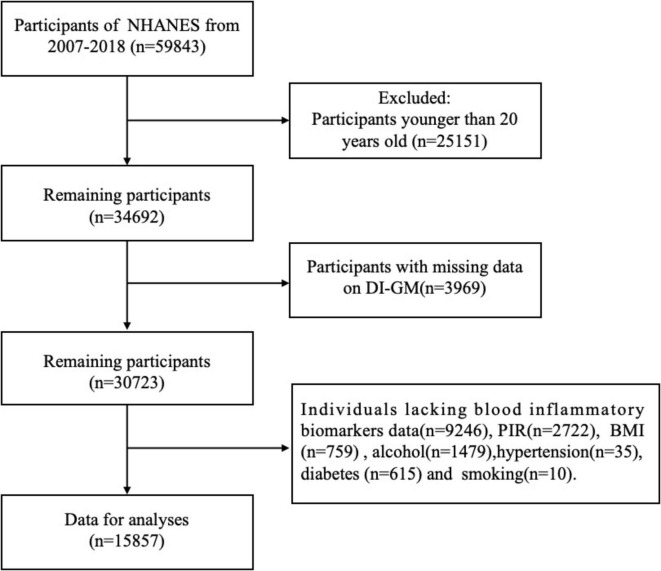 FIGURE 1
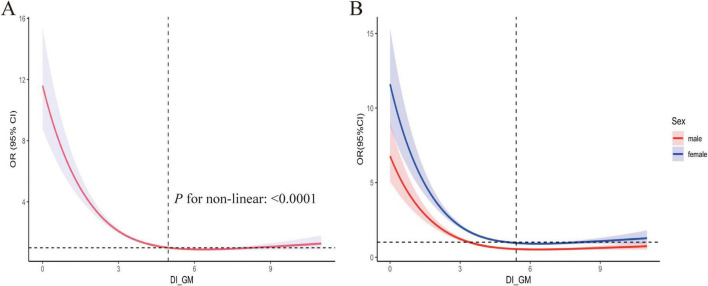 FIGURE 2
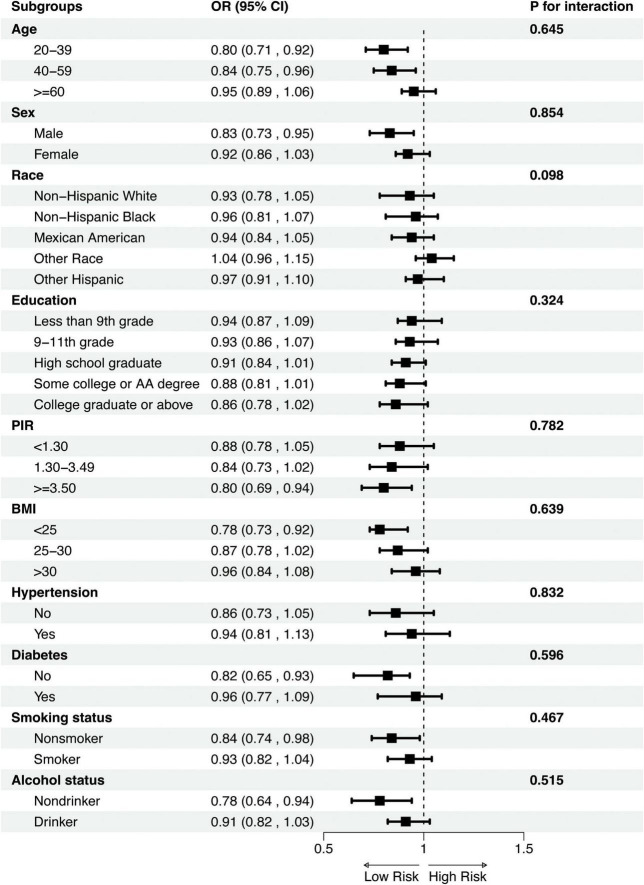 FIGURE 3
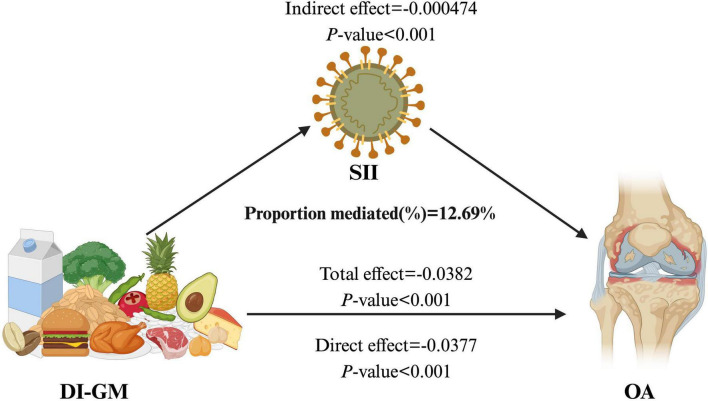 FIGURE 4
| Characteristic | Osteoarthritis | |||
|
|
|
|
| |
|
|
| |||
| 20-39 | 5,361 (36.7%) | 4,678 (45.9%) | 683 (14.5%) | |
| 40-59 | 5,131 (37.1%) | 3,614 (36.7%) | 1,517 (38.0%) | |
| ≥ 60 | 5,365 (26.2%) | 2,533 (17.4%) | 2,832 (47.5%) | |
|
|
| |||
| Male | 7,869 (49%) | 5,676 (52%) | 2,193 (42%) | |
| Female | 7,988 (51%) | 5,149 (48%) | 2,839 (58%) | |
|
|
| |||
| Non-Hispanic White | 7,019 (69%) | 4,392 (67%) | 2,627 (76%) | |
| Non-Hispanic Black | 3,331 (10.0%) | 2,228 (10%) | 1,103 (9.7%) | |
| Mexican American | 2,090 (7.9%) | 1,559 (9.2%) | 531 (5.0%) | |
| Other Race | 1,918 (7.3%) | 1,591 (8.2%) | 327 (5.2%) | |
| Other Hispanic | 1,499 (5.5%) | 1,055 (6.0%) | 444 (4.1%) | |
|
|
| |||
| <9th grade | 1,307 (4.2%) | 750 (3.5%) | 557 (5.7%) | |
| 9-11th grade | 2,158 (10.0%) | 1,397 (9.4%) | 761 (11%) | |
| High school graduate | 3,661 (23%) | 2,410 (23%) | 1,251 (25%) | |
| Some college or AA degree | 4,846 (32%) | 3,319 (31%) | 1,527 (33%) | |
| College graduate or above | 3,885 (31%) | 2,949 (33%) | 936 (25%) | |
|
|
| |||
| < 1.30 | 4,910 (21.15%) | 3,230 (20.72%) | 1,680 (22.18%) | |
| 1.30-3.49 | 5,876 (34.70%) | 3,940 (34.04%) | 1,936 (36.28%) | |
| ≥ 3.50 | 5,071 (44.16%) | 3,655 (45.24%) | 1,416 (41.54%) | |
|
|
| |||
| <25 | 4,612 (29%) | 3,502 (33%) | 1,110 (22%) | |
| 25-30 | 5,956 (37%) | 3,652 (33%) | 2,304 (46%) | |
| > 30 | 5,289 (34%) | 3,671 (34%) | 1,618 (32%) | |
|
|
| |||
| Yes | 5,689 (32%) | 2,950 (24%) | 2,739 (50%) | |
| No | 10,168 (68%) | 7,875 (76%) | 2,293 (50%) | |
|
|
| |||
| Yes | 2,118 (9.9%) | 1,043 (7.2%) | 1,075 (17%) | |
| No | 13,739 (90%) | 9,782 (93%) | 3,957 (83%) | |
|
|
| |||
| Nonsmoker | 8,750 (56%) | 6,418 (59%) | 2,332 (47%) | |
| Smoker | 7,107 (44%) | 4,407 (41%) | 2,700 (53%) | |
|
|
| |||
| Nondrinker | 3,598 (18%) | 2,351 (17%) | 1,247 (20%) | |
| Drinker | 12,259 (82%) | 8,474 (83%) | 3,785 (80%) | |
| 538 ± (3.13) | 525 ± (2.96) | 570 ± (3.49) |
| |
| 5.06 ± (0.02) | 5.18 ± (0.06) | 4.80 ± (0.04) |
| |
|
|
| |||
| 0-3 | 3,060 (18%) | 1,557 (14%) | 1,503 (27%) | |
| 4 | 3,429 (21%) | 2,457 (21%) | 972 (19%) | |
| 5 | 3,685 (23%) | 2,704 (24%) | 981 (19%) | |
| ≥ 6 | 5,683 (39%) | 4,107 (40%) | 1,576 (35%) | |
| Characteristic | Estimate | SE | OR | 95% CI | ||
|
| ||||||
| 20-39 | 1.0 (ref) | 1.0 (ref) | 1.0 (ref) | 1.0 (ref) | 1.0 (ref) | 1.0 (ref) |
| 40-59 | 0.911 | 0.06 | 14.78 | 2.49 | 2.20, 2.81 |
|
| ≥ 60 | 1.03 | 0.06 | 15.35 | 2.81 | 2.46, 3.21 |
|
|
| ||||||
| Male | 1.0 (ref) | 1.0 (ref) | 1.0 (ref) | 1.0 (ref) | 1.0 (ref) | 1.0 (ref) |
| Female | 0.49 | 0.05 | 9.85 | 1.65 | 1.49, 1.82 |
|
|
| ||||||
| Non-Hispanic White | 1.0 (ref) | 1.0 (ref) | 1.0 (ref) | 1.0 (ref) | 1.0 (ref) | 1.0 (ref) |
| Non-Hispanic Black | 0.21 | 0.10 | 1.99 | 1.26 | 0.98, 1.63 | 0.049 |
| Mexican American | 0.63 | 0.07 | 8.71 | 1.89 | 1.63, 2.18 |
|
| Other Race | 0.58 | 0.07 | 7.41 | 1.80 | 1.54, 2.11 |
|
| Other Hispanic | 0.24 | 0.12 | 2.03 | 1.28 | 1.01, 1.63 | 0.045 |
|
| ||||||
| <9th grade | 1.0 (ref) | 1.0 (ref) | 1.0 (ref) | 1.0 (ref) | 1.0 (ref) | 1.0 (ref) |
| 9-11th grade | –0.13 | 0.09 | –1.43 | 0.74 | 0.61, 0.91 | 0.006 |
| High school graduate | –0.19 | 0.08 | –2.17 | 0.68 | 0.55, 0.84 |
|
| Some college or AA degree | –0.20 | 0.08 | –2.30 | 0.66 | 0.52, 0.84 | 0.001 |
| College graduate or above | –0.62 | 0.09 | –6.63 | 0.64 | 0.54, 0.75 |
|
|
| ||||||
| <1.30 | 1.0 (ref) | 1.0 (ref) | 1.0 (ref) | 1.0 (ref) | 1.0 (ref) | 1.0 (ref) |
| 1.30–3.49 | –0.16 | 0.05 | –3.06 | 0.85 | 0.77, 0.95 | 0.003 |
| ≥3.50 | –0.46 | 0.06 | –7.24 | 0.63 | 0.55, 0.71 |
|
|
| ||||||
| <25 | 1.0 (ref) | 1.0 (ref) | 1.0 (ref) | 1.0 (ref) | 1.0 (ref) | 1.0 (ref) |
| 25–30 | 0.15 | 0.06 | 2.43 | 1.16 | 1.03, 1.31 | 0.017 |
| >30 | 0.54 | 0.05 | 9.63 | 1.72 | 1.54, 1.93 |
|
|
| ||||||
| No | 1.0 (ref) | 1.0 (ref) | 1.0 (ref) | 1.0 (ref) | 1.0 (ref) | 1.0 (ref) |
| Yes | 0.79 | 0.04 | 18.23 | 2.22 | 2.03, 2.42 |
|
|
| ||||||
| No | 1.0 (ref) | 1.0 (ref) | 1.0 (ref) | 1.0 (ref) | 1.0 (ref) | 1.0 (ref) |
| Yes | 0.51 | 0.06 | 8.14 | 1.68 | 1.48, 1.91 |
|
|
| ||||||
| Nonsmoker | 1.0 (ref) | 1.0 (ref) | 1.0 (ref) | 1.0 (ref) | 1.0 (ref) | 1.0 (ref) |
| Smoker | 0.31 | 0.04 | 6.75 | 1.37 | 1.25, 1.51 |
|
|
| ||||||
| Nondrinker | 1.0 (ref) | 1.0 (ref) | 1.0 (ref) | 1.0 (ref) | 1.0 (ref) | 1.0 (ref) |
| Drinker | 0.71 | 0.05 | 9.31 | 1.84 | 1.75, 1.94 | 0.002 |
|
| 0.72 | 0.04 | 12.88 | 1.63 | 1.54, 1.87 | 0.003 |
| Model I | Model II | Model III | ||||
| OR (95% CI) | OR (95% CI) | OR (95% CI) | ||||
|
| 0.88 (0.85, 0.91) |
| 0.82 (0.78, 0.85) |
| 0.83 (0.79, 0.86) |
|
|
| ||||||
| 0–3 | Ref | – | Ref | – | Ref | – |
| 4 | 0.70 (0.62, 0.79) |
| 0.63 (0.55, 0.73) |
| 0.67 (0.54, 0.74) |
|
| 5 | 0.68 (0.59, 0.79) |
| 0.58 (0.49, 0.69) |
| 0.60 (0.50, 0.72) |
|
| ≥6 | 0.68 (0.60, 0.78) |
| 0.52 (0.44, 0.61) |
| 0.55 (0.46,0.65) |
|
|
|
|
|
| |||
| Model I | Model II | Model III | ||||
| β (95% CI) | β (95% CI) | β (95% CI) | ||||
| DI-GM | –6.4 (–10.0, –2.4) |
| –8.5 (–13.0, –4.3) |
| –7.3 (–12.0, –3.0) |
|
|
| ||||||
| 0–3 | Ref | – | Ref | – | Ref | – |
| 4 | –4.5 (–7.8, 2.3) | 0.60 | –5.3 (–9.7.0, 2.0) | 0.9 | –4.2 (–16.0, 2.1) |
|
| 5 | –6.3 (–11.0, 4.7) | 0.15 | –6.7 (–10.6, 3.62) | 0.058 | –6.4. (–12.0, 4.4) |
|
| ≥6 | –8.8 (–12.0, –1.5) |
| –9.7 (–12.8, –1.7) |
| –9.2 (–13.0, –2.0) |
|
|
|
|
|
| |||
Peer Reviews
No public reviews on file for this paper yet. If you reviewed it on a platform where reviews are public (OpenReview, ICLR, NeurIPS, ICML), you can paste yours below so the community can read it here.
Videos
No videos yet. Explain this paper in a talk, walkthrough, or lecture? Add one.
Taxonomy
TopicsGut microbiota and health · Osteoarthritis Treatment and Mechanisms · Inflammatory Biomarkers in Disease Prognosis
1 Introduction
Osteoarthritis (OA) is a common chronic degenerative joint disease characterized by the deterioration of articular cartilage and structural changes in the joint (1). It most frequently affects large joints such as the knees, hips, and hands, leading to symptoms including pain, stiffness, and impaired function (2). Epidemiological data indicate that approximately 18% of women and 10% of men worldwide develop OA after the age of 60 (3). In the United States, more than 32 million adults are affected by OA, and projections suggest that this number will rise to 67 million by 2030 (4). With the ongoing global trend of aging, the prevalence and disability rates associated with OA continue to increase, placing a growing burden on public health systems and socioeconomic development (5, 6).
The gut microbiota is a diverse and complex community of microorganisms inhabiting the gastrointestinal tract, consisting of approximately 35,000 bacterial species that form the gut microbiome (7). It plays a critical role in nutrient absorption, maintaining metabolic balance, regulating the immune system, and reducing systemic inflammation (8). Recently, Kase et al. developed the Dietary Gut Microbiome Index (DI-GM) (9), a dietary measure designed to support a healthy gut microbiota. This index was created by analyzing the relationship between various foods or food groups and the composition of the adult gut microbiota. Based on its correlation with indirect biomarkers of gut microbiota diversity, the DI-GM effectively identifies dietary patterns that promote or hinder gut microbiota health, providing a standardized tool that can measure diet quality associated with maintain healthy gut microbiota.
The systemic immune-inflammation index (SII) is a composite biomarker derived from peripheral blood cell counts, providing a comprehensive reflection of the body’s inflammatory and immune status (10). Recent studies have indicated that SII is abnormal elevated in various chronic inflammatory conditions and is strongly linked to disease severity and prognosis (11). OA as a prevalent chronic degenerative disorder, involves both local and systemic inflammatory responses in its pathogenesis. Emerging evidence suggests that an elevated SII is positively correlated with pain severity and joint dysfunction in patients with OA (12). Additionally, higher SII level have been significantly associated with the radiographic severity of OA (13), indicating that SII could serve as a potential biomarker for assessing disease activity and progression.
There is growing interest in modulating the gut microbiota through dietary approaches. An increasing body of research suggests that the gut microbiota may influence the function of host tissue and organs, including inflammatory status (14), the gut microenvironment (15), and joint integrity (16). Recent study indicate that gut microbiota and probiotics can reduce cartilage degeneration during OA flare-ups (17). Meanwhile, increasing attention has been directed toward the role of dietary components in modulating immune responses and inflammatory processes within the body. Previous study has shown that gut microbiota dysbiosis might exacerbate intra-articular inflammatory responses in OA patients by impairing intestinal barrier integrity and promoting the release of pro-inflammatory cytokines (18). Therefore, exploring the association between DI-GM and OA, as well as the mediating role of SII, holds significant scientific value.
Although previous studies have focused on the direct modulation of gut microbiota, few studies have indirectly assessed how gut microbiota modulate SII to reduce the risk of OA. We conducted a cross-sectional study using data from the National Health and Nutrition Examination Survey (NHANES) to explore the potential association between DI-GM and OA. Additionally, we assessed the mediating role of the SII in this relationship. Our study provides deeper insights into the complex interplay among dietary intake, gut microbiota, and SII, offering novel scientific evidence to inform the prevention and intervention strategies for OA.
2 Materials and methods
2.1 Study design and population
This study is based on data from the National Health and Nutrition Examination Survey (NHANES), a comprehensive, nationally representative cross-sectional survey conducted by the National Center for Health Statistics (NCHS). The survey employs a multi-stage probability sampling design, with data released every 2 years. We included 6 distinct NHANES data cycles from 2007 to 2018, focusing on adult participants aged 20-80 years. Participants provided information on OA diagnoses, DI-GM, and related variables. The NCHS Ethics Review Board reviewed and approved this study, participants provided written informed consent, and the research utilized anonymized publicly available NHANES data.
A total of 59,843 individuals participated in this study. Exclusions were made for individuals under the age of 20 years (25,151), and individuals lacking DI-GM data (n = 3,969). Additional exclusions included participants with missing information on blood inflammatory biomarkers (n = 9,246), poverty income ratio (PIR) (n = 2,722), body mass index (BMI) (n = 759), alcohol consumption (n = 1,479), hypertension (n = 35), diabetes (n = 615), and smoking status (n = 10). Ultimately, 15,857 participants were included in the final analysis (Figure 1).
Flowchart of participant inclusion and exclusion criteria.
2.2 Definitions of dietary index for gut microbiota
Participants’ consumption of the Diversity Index of Gut Microbiota (DI-GM) was assessed through dietary recall interviews using data from the NHANES 2007-2018. Dietary data were collected via two interviewer-administered 24-h dietary recall components, employing the automated multiple-pass method developed by the United States Department of Agriculture (USDA). The DI-GM index used in this study was developed and validated by Kase et al. (9) based on the NHANES database. Given that our study data were also derived from NHANES, the validity and applicability of this index are more strongly support in the present study. The DI-GM score is based on 14 foods and nutrients. Beneficial components include fermented dairy products, chickpeas, soybeans, whole grains, dietary fiber, cranberries, avocados, broccoli, coffee, and green tea. Adverse components include refined grains, red meat, processed meat, and high-fat diets (≥ 40% of energy from fat). For each beneficial component, a score of 1 is assigned when consumption exceeds the sex-specific median, and a score of 0 is assigned when intake falls below this threshold. The scores for each component are summed to yield a total DI-GM score ranging from 0 to 14, with beneficial food contributing 0-10 points and unfavorable foods 0-4 points. Participants were divided into four groups based on quartiles of total scores: 0-3, 4, 5, and ≥ 6 (19). The components and scoring criteria of DI-GM are detailed in Supplementary Table 1.
2.3 Diagnosis of OA
OA diagnosis data were assessed using the Medical Conditions questionnaire from the NHANES database. This questionnaire includes the question, “Has a doctor or other health professional ever told you that you have arthritis?” with response options of “yes” or “no.” Participants who answered, “yes” proceeded to the subsequent set of questions, which asked, “What type of arthritis was it?” Individuals who selected the OA option were included in the study (20).
2.4 Assessment of SII
The Systemic Immune-Inflammation Index (SII) was measured to assess immune-related inflammation in participants, providing an objective reflection of changes in the body’s inflammatory levels (21). This index incorporates platelet count, lymphocyte count, and neutrophil count. Blood samples from all participants were collected at the mobile examination center following NHANES protocols, and quantitative assessments of blood components were performed using the Beckman Coulter method. The SII was calculated by multiplying the platelet count by the neutrophil count and then dividing by the lymphocyte count, as reported in previous research (22).
2.5 Covariates
Drawing from prior research (23, 24), we compiled a comprehensive set of covariates known to influence OA as potential confounders. These included demographic factors such as age (20-39, 40-59, ≥ 60), gender (male or female), and race (Non-Hispanic White, Non-Hispanic Black, Mexican American, Other Race and Other Hispanic); education level (<9th grade, 9-11th grade, High school graduate, Some college or AA degree and College graduated or above) and poverty-to-income ratio (PIR) (<1.30, 1.30-3.49, ≥ 3.50); body mass index (BMI) (<25, 25-30, > 30 kg/m^2^). We also included self-reported chronic conditions, including diabetes and hypertension. Smoking status was categorized based on whether participants had smoked at least 100 cigarettes in their lifetime and whether they currently smoke. Alcohol consumption was categorized as consuming at least 12 alcoholic beverages per year, enabling us to assess their potential influence on the study outcomes.
2.6 Statistical analysis
In our statistical analysis, we applied weights to the corresponding samples across different cycles of the NHANES data. Continuous variables are expressed as means and standard errors (SE), while categorical variables are represented by frequencies (n) and percentages (%). The chi-square test was used to assess differences in categorical variables, while differences in continuous variables were evaluated using the t-test (for variables with a normal distribution) or the Mann–Whitney test (for variables with a skewed distribution). Univariable and weighted multivariable logistic regression analyses were performed, with results presented as odds ratios (OR) and 95% confidence intervals (CI). Univariable analysis was conducted to examine the association between each variable and OA. To explore the relationship between DI-GM and OA, we applied weighted multivariable logistic regression models. Additionally, multivariable weighted linear regression was conducted to evaluate associations between the DI-GM and the SII. Model I was unadjusted for covariates; Model II adjusted for demographic factors including age, sex, race, educational level, and poverty–income ratio, and Model III further adjusted for variables such as BMI, smoking status, alcohol consumption, hypertension, diabetes, and SII.
We utilized restricted cubic spline (RCS) regression to evaluate potential non-linear relationships between DI-GM and OA. Furthermore, we conducted an in-depth investigation into the potential mediating role of the SII in the association between DI-GM and OA. Mediation analysis was performed using the Sobel test and the bootstrap method, with 1,000 resampling iterations to compute the 95% CI for the mediation effect. The mediation effect was quantified as the proportion mediated. Sensitivity analyses included subgroup analysis and propensity score matching (PSM). We performed subgroup analyses based on age, sex, race, educational level, PIR, BMI, smoking status, alcohol use, diabetes, hypertension, and the SII to explore potential interactions between these covariates and the DI-GM and OA association. Based on previous evidence indicating that these factors may influence dietary habits, gut microbiota composition, inflammation levels, and OA risk (25, 26). Interaction tests were also conducted to evaluate heterogeneity across subgroups. The PSM was performed with the OA population serving as the reference group, using a 1:1 matching ratio to further eliminate bias and control for potential confounding baseline variables between groups. Subsequently, logistic regression analyses were conducted on the matched samples. Detailed information regarding the PSM methodology is provided in the Supplementary material. All data extraction and analyses were performed using R software (version 4.4.1),^1^ with statistical significance defined as p < 0.05.
3 Results
3.1 Baseline characteristics of the study participants
In this study, a total of 15,875 participants were stratified according to OA status using NHANES data from 2007 to 2018. Of these, 5,032 individuals had OA, while 10,825 were without OA. OA participants were significantly older than non-OA participants, with 47.5% being ≥ 60 years of age. The proportion of females was higher in the OA group (58%) compared to the non-OA group. Among racial groups, non-Hispanic White participants had the highest OA prevalence (76%), followed by non-Hispanic Black participants (9.7%, p < 0.001). Educational attainments also differed significantly between groups, with a smaller proportion of OA patients being college graduates (25%) compared to the non-OA (33%), and a larger proportion of OA participants having a poverty-income ratio (PIR) below 1.30 (p < 0.001). Additionally, OA patients had higher SII values (p < 0.001) and lower DI-GM scores, along with a higher prevalence of comorbidities such as hypertension and diabetes (p < 0.001), OA participants also reported higher alcohol consumption (p = 0.006) and slightly lower smoking rates (p < 0.001). Detailed baseline characteristics of all participants grouped by OA status are presented in Table 1.
3.2 Univariate analysis
Table 2 presents the result of univariate analyses for each variable about OA. Our findings show that, compared to individuals aged 20–39 years, those aged 40–59 had 2.49 times higher odds of developing OA, while individuals aged ≥ 60 exhibited a 2.81-fold increase in odds. Females were 1.65 times more likely to develop OA than males. Mexican American participants (OR: 1.89; p < 0.001) and individuals of other racial backgrounds (OR: 1.80; p < 0.001) had higher OA prevalence compared to non-Hispanic White participants. Higher educational attainment was negatively associated with OA risk (OR: 0.64; p < 0.001). Similarly, individuals with a PIR ≥ 3.50 (OR: 0.63; p < 0.001) had a lower risk of OA compared to those with a PIR < 1.30. Participants with a BMI > 30 (OR: 1.72; p < 0.001) had significantly higher odds of OA compared to those with a BMI < 25. OA risk was also higher in individuals with hypertension or diabetes than in those without these conditions. Additionally, smokers and alcohol consumers were more likely to develop OA compared to non-smokers and non-drinkers. Finally, a positive correlation was observed between SII values and OA prevalence.
3.3 Association between DI-GM and OA
Table 3 presents the results of weighted multivariate logistic regression analyses examining the relationship between DI-GM and OA risk. Three models were constructed, each adjusted for potential confounders, revealing an inverse association between DI-GM and OA risk. The OR with 95% CI for each model were as follows: Model I 0.88 (0.85, 0.91), Model II 0.82 (0.78, 0.85), and Model III 0.83 (0.79–0.86). To assess the robustness of these findings, DI-GM was stratified into quartiles. In all three models, a persistent inverse relationship between DI-GM and OA was observed. In the fully adjusted Model III, the DI-GM ≥ 6 group was 0.55 (0.46-0.65), indicating that higher DI-GM values were associated with a significant decrease in OA prevalence. Additionally, RCS curves were used to explore the potential non-linear relationship between DI-GM and OA. As shown in Figure 2A, the RCS curve indicates a non-linear association between DI-GM and OA. Further analysis revealed gender-based differences in the effect of OA. Both males and females showed similar non-linear relationships between DI-GM and OA risk (Figure 2B).
Restricted cubic spline fitting for the association between DI_GM and OA. (A) Adjustments were made for Age, Sex, Race, Educational, poverty-income ratio (PIR), body mass index (BMI), Diabetes, Hypertension, Smoking and Alcohol status, as well as the systemic inflammation index (SII). (B) Stratified analysis was conducted by sex, with the red curve representing males and the blue curve representing females. DI-GM, dietary index for gut microbiota, OA, osteoarthritis.
3.4 Association between DI-GM and SII
The association between DI-GM and SII was examined using weighted linear regression models. As shown in Table 4, a negative correlation between higher DI-GM and SII was observed across all three models (Model I, Model II, and Model III). Specifically, Model I yielded a β (95% CI) of –8.8 (–12.0, –1.5), p = 0.004; Model II, β (95% CI): –9.7 (–12.8, –1.7), p < 0.001; and Model III, β (95% CI): –9.2 (–13.0, –2.0), p = 0.002. These results indicated that a one-point increase in the DI-GM score is associated with a 9.2% reduction in the SII index.
3.5 Subgroup analysis and sensitivity analysis
To evaluate whether the association between DI-GM and OA varies across different subgroups, we performed subgroup analyses and interaction tests (Supplementary Table 2). As shown in Figure 3, no significant interactions were found across subgroups categorized by age (20–39, 40–59, and ≥60 years), sex (male and female), race/ethnicity (non-Hispanic White, non-Hispanic Black, Mexican American, other races, and other Hispanic), educational level (less than grade 9, grades 9–11, high school graduate, some college and college graduate), poverty-income ratio (PIR) (<1.30, 1.30–3.49, and ≥ 3.50), body mass index (BMI) (<25, 25–30, and > 30), hypertension (present and absent), diabetes (present and absent), smoking status (smoker and non-smoker), and alcohol use (drinker and non-drinker). These results suggest that none of these factors significantly influenced the association between DI-GM and OA (all p for interaction > 0.05).
Subgroup analysis of the association between DI_GM and OA. Subgroup analyses were stratified by Age, Sex, Race, Educational, PIR, BMI, Diabetes, Hypertension, Smoking and alcohol status. PIR, poverty-income ratio; BMI, body mass index; OR, Odds Ratio; CI, Confidence Interval.
PSM analysis results were in agreement with main analysis, further confirmed the stability of the association between DI-GM and OA risk (for details, see Supplementary Tables 3–5).
3.6 Mediation analysis
The mediation analysis results indicate that the SII partially mediates the relationship between DI-GM and the prevalence of OA. As illustrated in Figure 4, the total effect of DI-GM on OA is statistically significant (β = –0.0382, p < 0.001). The direct effect of DI-GM is β = –0.000474, p < 0.001, while the indirect effect through SII is β = –0.000474, p < 0.001. Notably, the proportion of the DI-GM-related effect on OA mediated by SII is 12.69% (Supplementary Table 6).
The mediating effect of SII on the relationship between DI-GM and OA. DI-GM, dietary index for gut microbiota; OA, osteoarthritis; SII, systemic inflammation index.
4 Discussion
This study explores the relationship between DI-GM and OA risk, and analyzed the mediating effect of SII on this association. Our study results revealed a negative correlation between DI-GM and OA risk, suggesting that higher DI-GM consumption may be associated with a reduced risk of OA. The RCS model showed that the DI-GM and OA were nonlinear relationship. Subgroup analyses indicated that stratification by demographic and clinical characteristics did not significantly affect the association between DI-GM and OA. These findings suggest that the inverse relationship between DI-GM and OA risk remains stable across various populations. Furthermore, the SII was found to partially mediated the relationship between DI-GM and OA, accounting for 12.69% of the total effect.
In recent years, accumulating evidence has indicated a close association between the gut microbiota and OA. Our findings revealed a negative correlation between the DI-GM and the risk of OA, this observation is consistent with previous research, highlighting the protective role of gut microbiota diversity in chronic inflammatory diseases such as OA (27). A diverse gut microbiota, supported by dietary patterns reflected by the DI-GM, is considered essential for maintaining intestinal barrier integrity and regulating systemic inflammation, thereby playing a critical role in mitigating OA pathogenesis (28). Conversely, diminished microbial diversity and dysbiosis have consistently been linked to increased susceptibility to OA (29). Animal studies have demonstrated that a decline in gut microbial diversity in mice compromises intestinal mucosal barrier function and promotes the expansion of pro-inflammatory bacteria, which in turn exacerbating systemic inflammatory, accelerates cartilage degradation, and promotes OA progression (30).
Diet is a critical determinant of gut microbiota composition, with different dietary patterns leading to distinct changes in microbial diversity (31). Our findings support these observations, suggesting that dietary optimization to promote a healthy gut microbiome could reduce the risk of OA. Studies have demonstrated that dietary patterns rich in dietary fiber, probiotics, and anti-inflammatory nutrients positively influence gut microbiota diversity, thus enhancing intestinal barrier integrity and reducing systemic inflammation (32). Similarly, excessive consumption of diets high in saturated fats, refined carbohydrates, and low in dietary fiber promotes the proliferation of pathogenic bacteria, thereby inducing inflammatory responses and metabolic dysregulation (33). A clinical study has indicated that the traditional Mediterranean diet, characterized by abundant intake of fruits, vegetables, whole grains, and fermented foods, could significantly improves microbial diversity and decreases inflammation occurrence (34).
Previous research has demonstrated that gut microbiota plays a crucial role in regulating systemic inflammation and maintaining immune homeostasis (35). In this study, we observed that participants with higher DI-GM scores (≥6) exhibited significantly lower SII. This indicated that diets promoting higher gut microbial diversity may enhance anti-inflammatory capacity, thus potentially reducing OA risk. This finding aligns with prior study indicating that a high level of microbial diversity is typically correlated with enhanced anti-inflammatory capabilities (36). However, at lower DI-GM levels, this association was weaker, suggesting that alternative mechanisms, such as immune modulation, oxidative stress, and antioxidant defenses, may play a role in OA pathogenesis. This effect is potentially attributed to the ability of a diverse gut microbiota to enhance the production of beneficial metabolites, such as the short-chain fatty acids (SCFAs) (37). These metabolites can suppress systemic low-grade inflammation by modulating the T-cells activation (38). Additionally, probiotics and other forms of live microbial foods are well-recognized for promoting beneficial gut flora, which can reduce systemic inflammation and improve metabolic health (39).
In this study, the SII was incorporated into mediation analysis from an exploratory perspective to identify potential mediating pathways linking the DI-GM with OA. This approach aims to provide theoretical support and direction for future longitudinal studies or intervention trials. Specifically, the selection of SII as a mediator was based on the significant differences in gut microbiota composition and diversity observed among OA patients, differences that are potentially associated with aberrant expression of inflammatory markers (13). Consequently, SII serves as an essential mediator, potentially playing a critical role within the “diet–gut microbiota” pathway and its association with OA (40). Our mediation analysis demonstrated that SII significantly mediated the relationship between DI-GM and OA, suggesting that higher DI-GM scores might reduce OA risk by modulating SII levels. A healthy and diverse gut microbiota contributes to maintaining intestinal mucosal barrier integrity, thereby limiting bacterial translocation and systemic exposure to bacterial endotoxins such as lipopolysaccharide (LPS) (41). This, in turn, attenuates systemic inflammatory responses and mitigates chronic inflammation implicated in the pathogenesis of OA.
The strengths of this study are primarily investigating the relationship between the DI-GM, a newly proposed index reflecting gut microbiome diversity, and OA using data from the NHANES database. Additionally, we explored the mediating role of the SII in the association between the DI-GM and OA. Finally, the robustness and reliability of the findings were confirmed through sensitivity analyses, including PSM and subgroup analyses. Despite these strengths of our study, there are notable limitations in our study. Firstly, the cross-sectional design restricts causal inference, making it difficult to determine whether DI-GM directly correlates with a reduced risk of OA. Future studies should be further examined in prospective studies and randomized controlled trials to validate causality. Furthermore, DI-GM was assessed based on 24-h dietary recall data, which may introduce recall bias and affect the accuracy of our findings. Finally, as with many studies, the possibility of residual confounding due to measurement errors in unknown confounders cannot be entirely ruled out.
5 Conclusion
In conclusion, our research suggests a negative correlation between the DI-GM and OA in the United States. population. Mediation analyses further explored the mediating role of SII. As a tool for assessing the dietary impact on gut microbiota, the DI-GM may provide valuable insights into new strategies for OA prevention. This underscores the potential of dietary interventions that focus on DI-GM as a strategy for OA management. Dietary guidelines for OA patients should prioritize increasing dietary microbial diversity. In the future research should aim to explore the mechanisms by which DI-GM influences joint health.
The reference list from the paper itself. Each links out to its DOI / PubMed record.
- 1Glyn-Jones S Palmer A Agricola R Price A Vincent T Weinans H Osteoarthritis. Lancet. (2015) 386:376–87. 10.1016/S 0140-6736(14)60802-3 25748615 · doi ↗ · pubmed ↗
- 2Katz J Arant K Loeser R. Diagnosis and treatment of hip and knee osteoarthritis: A review. JAMA. (2021) 325:568–78. 10.1001/jama.2020.22171 33560326 PMC 8225295 · doi ↗ · pubmed ↗
- 3Johnson V Hunter D. The epidemiology of osteoarthritis. Best Pract Res Clin Rheumatol. (2014) 28:5–15. 10.1016/j.berh.2014.01.004 24792942 · doi ↗ · pubmed ↗
- 4Murphy L Helmick C. The impact of osteoarthritis in the united states: A population-health perspective. Am J Nurs. (2012) 112:S 13–9. 10.1097/01.NAJ.0000412646.80054.21 22373741 · doi ↗ · pubmed ↗
- 5Cui A Li H Wang D Zhong J Chen Y Lu H. Global, regional prevalence, incidence and risk factors of knee osteoarthritis in population-based studies. Eclinicalmedicine. (2020) 29:100587. 10.1016/j.eclinm.2020.100587 34505846 PMC 7704420 · doi ↗ · pubmed ↗
- 6Palazzo C Nguyen C Lefèvre-Colau M Rannou F Poiraudeau S. Risk factors and burden of osteoarthritis. Ann Phys Rehabil Med. (2016) 59:134–8. 10.1016/j.rehab.2016.01.006 26904959 · doi ↗ · pubmed ↗
- 7Flint H Duncan S Scott K Louis P. Links between diet, gut microbiota composition and gut metabolism. Proc Nutr Soc. (2015) 74:13–22. 10.1017/S 0029665114001463 25268552 · doi ↗ · pubmed ↗
- 8Valdes A Walter J Segal E Spector T. Role of the gut microbiota in nutrition and health. BMJ. (2018) 361:k 2179. 10.1136/bmj.k 2179 29899036 PMC 6000740 · doi ↗ · pubmed ↗