A deficiency screen of the X chromosome for Rap1 GTPase dominant interacting genes in Drosophila border cell migration
C Luke Messer, Emily Burghardt, Jocelyn A McDonald

TL;DR
This study identifies new genes that interact with Rap1 during collective cell migration in fruit fly egg development, offering insights into developmental and cancer processes.
Contribution
The study presents a novel deficiency screen identifying new Rap1-interacting genes involved in Drosophila border cell migration.
Findings
Seven genomic regions on the X chromosome interact with Rap1V12 in border cell migration.
Three genes—frizzled 4, Ubiquitin-specific protease 16/45, and strawberry notch—were mapped as Rap1-interacting candidates.
The findings suggest new regulators of Rap1 activity in collective cell migration.
Abstract
Collective cell migration is critical to embryonic development, wound healing, and the immune response, but also drives tumor dissemination. Understanding how cell collectives coordinate migration in vivo has been a challenge, with potential therapeutic benefits that range from addressing developmental defects to designing targeted cancer treatments. The small GTPase Rap1 has emerged as a regulator of both embryogenesis and cancer cell migration. How active Rap1 coordinates downstream signaling functions required for coordinated collective migration is poorly understood. Drosophila border cells undergo a stereotyped and genetically tractable in vivo migration within the developing egg chamber of the ovary. This group of 6–8 cells migrates through a densely packed tissue microenvironment and serves as an excellent model for collective cell migration during development and disease. Rap1,…
Genes, proteins, chemicals, diseases, species, mutations and cell lines named across the full text — each resolved to its canonical identifier and authoritative record.
Click any figure to enlarge with its caption.
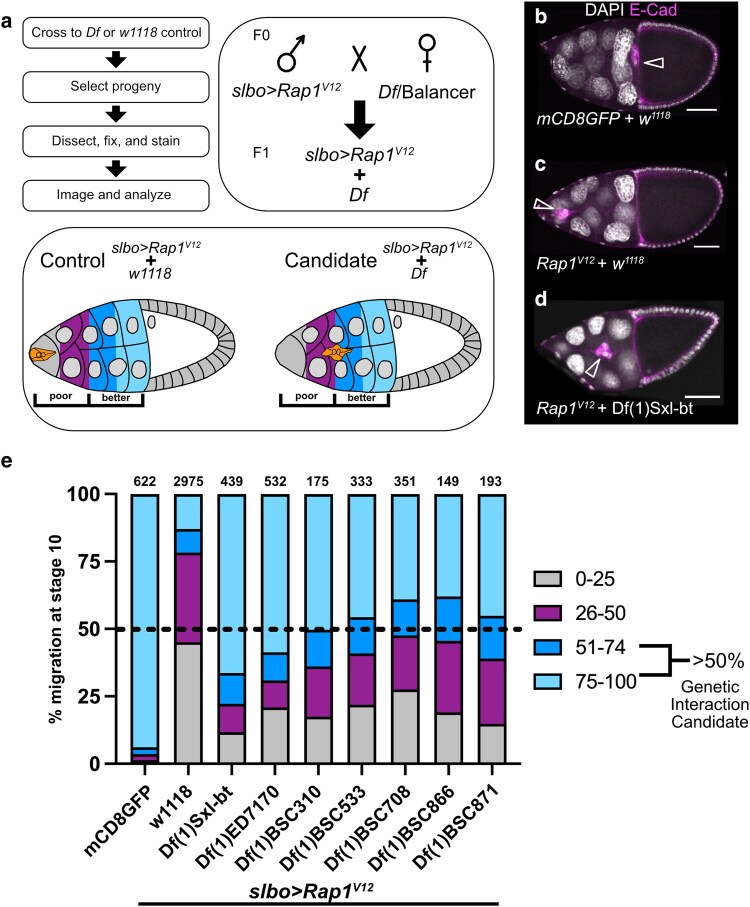 Fig. 1
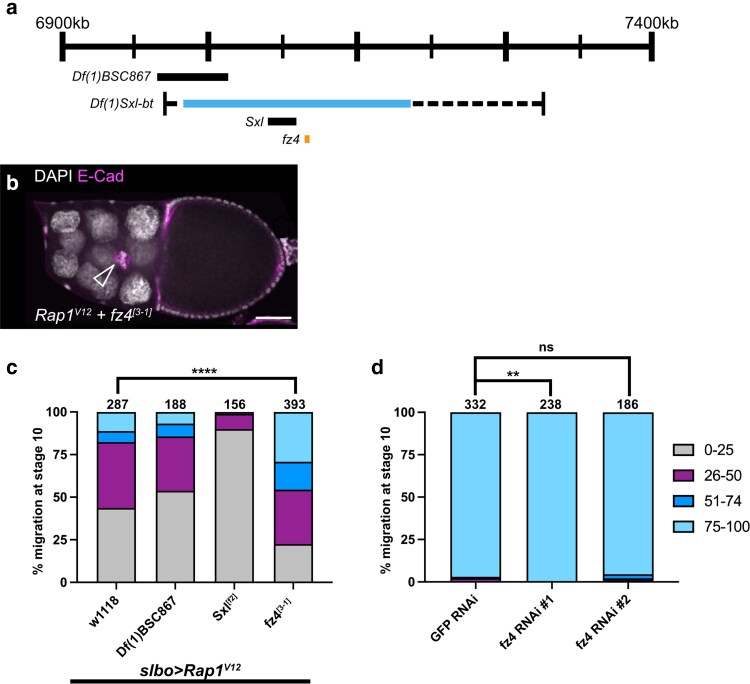 Fig. 2
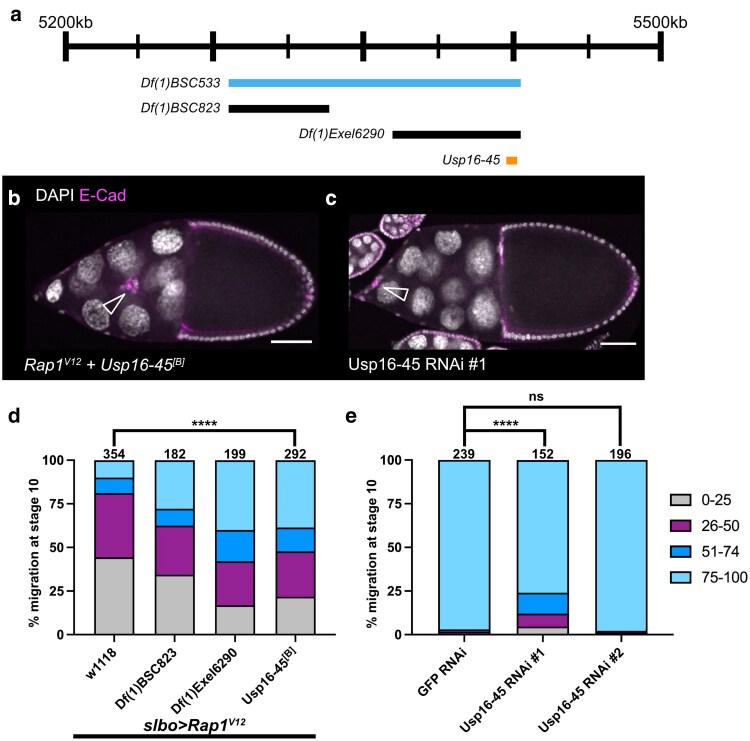 Fig. 3
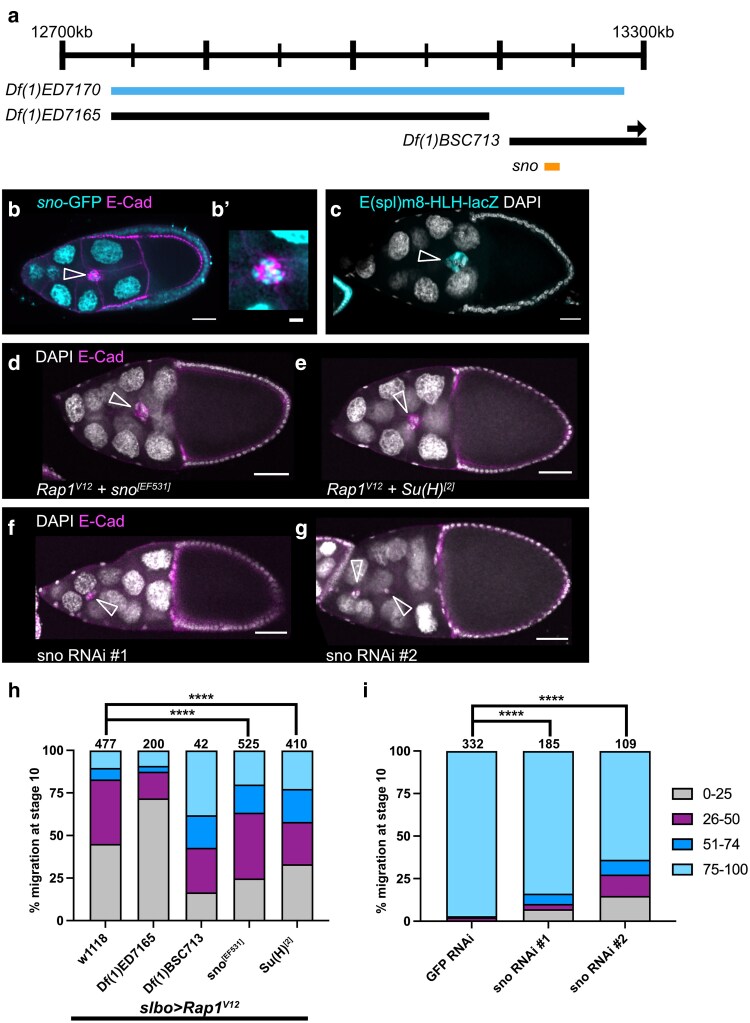 Fig. 4
| Symbol | BDSC | Breakpoints | Estimated Cytology | Hit | Fraction migrating ≤50% | Fraction migrating >50% | # Repeats | # EC |
|---|---|---|---|---|---|---|---|---|
| Df(1)BSC843 | 27,887 | X:254,968–255,277;X:334,685 (Df) | 1A1;1A3 (Df) | N | 70.49% | 29.51% | 1 | 122 |
| Df(1)BSC530 | 25,058 | X:364,350;X:623,478–623,577 (Df) | 1A5;1B12 (Df) | N | 73.21% | 26.79% | 1 | 56 |
| Df(1)G1 | 34,050 | X:644,873;X:654,238 (Df) | 1B13;1B13 (Df) | N | 66.95% | 33.05% | 2 | 214 |
| Df(1)ED6443 | 9053 | X:656,023;X:1,026,707 (Df) | 1B14;1E1 (Df) | NΨ | 98.55% | 1.45% | 3 | 268 |
| Df(1)BSC534 | 25,062 | X:841,105;X:1,453,730 (Df) | 1D1;2A3 (Df) | N | 82.69% | 17.31% | 1 | 52 |
| Df(1)BSC719 | 26,571 | X:1,453,730;X:1,865,709 (Df) | 2A3;2B13 (Df) | NΨ | 90.01% | 9.99% | 2 | 122 |
| Df(1)BSC717 | 26,569 | X:2,251,580;X:2,545,663 (Df) | 2F2;3A4 (Df) | NΨ | 98.55% | 1.45% | 3 | 99 |
| Df(1)ED411 | 8031 | X:2,469,859;X:2,642,686 (Df) | 3A3;3A8 (Df) | N | 70.63% | 29.38% | 1 | 160 |
| Df(1)ED6584 | 9348 | X:2,636,213;X:2,685,435 (Df) | 3A8;3B1 (Df) | NΨ | 97.26% | 2.74% | 3 | 199 |
| Df(1)ED6630 | 8948 | X:2,685,540;X:3,036,910 (Df) | 3B1;3C5 (Df) | NΨ | 99.60% | 0.40% | 3 | 200 |
| Df(1)BSC531 | 25,059 | X:2,913,683–2,913,782;X:3,672,682 (Df) | 3C3;3E2 (Df) | N | 52.83% | 47.17% | 1 | 53 |
| Df(1)BSC834 | 27,886 | X:3,288,956;X:3,845,727 (Df) | 3C11;3F3 (Df) | NΨ | 96.53% | 3.47% | 3 | 227 |
| Df(1)ED6712 | 9169 | X:3,432,535;X:3,789,615 (Df) | 3D3;3F1 (Df) | NΨ | 94.74% | 5.26% | 2 | 96 |
| Df(1)ED6716 | 24,145 | X:3,799,196;X:4,204,584 (Df) | 3F2;4B3 (Df) | NΨ | 94.54% | 5.46% | 3 | 242 |
| Df(1)BSC580 | 25,414 | X:4,101,232–4,101,613;X:4,688,080 (Df) | 4A5;4C13 (Df) | N | 69.83% | 30.17% | 2 | 102 |
| Df(1)ED6727 | 8956 | X:4,325,174;X:4,911,061 (Df) | 4B6;4D5 (Df) | N | 85.71% | 14.29% | 1 | 49 |
| Df(1)JC70 | 944 | X:4,679,537–4,919,558;X:5,309,242–5,412,386 (Df) | 4C12-4D6;4F4-4F9 (Df) | NΨ | 95.98% | 4.02% | 2 | 177 |
| Df(1)BSC533 | 25,061 | X:5,282,581–5,282,584;X:5,428,543 (Df) | 4F4;4F10 (Df) | Y | 40.92% | 59.08% | 4 | 333 |
| Df(1)Exel6235 | 7709 | X:5,516,611;X:5,593,966 (Df) | 5A2;5A6 (Df) | N | 58.10% | 41.90% | 2 | 185 |
| Df(1)BSC571 | 25,114 | X:5,545,559;X:5,662,787 (Df) | 5A4;5A10 (Df) | N | 66.07% | 33.93% | 1 | 56 |
| Df(1)ED6802 | 8949 | X:5,679,980;X:5,965,880 (Df) | 5A12;5D1 (Df) | N | 56.07% | 43.93% | 2 | 172 |
| Df(1)ED6829 | 8947 | X:5,901,976;X:6,353,095 (Df) | 5C7;5F3 (Df) | N | 77.50% | 22.50% | 1 | 80 |
| Df(1)Exel6239 | 7713 | X:6,344,333;X:6,516,952–6,538,013 (Df) | 5F2;6B1-6B2 (Df) | N | 51.06% | 48.94% | 2 | 127 |
| Df(1)Exel6240 | 7714 | X:6,543,963;X:6,669,857–6,669,858 (Df) | 6B2;6C4 (Df) | N | 60.13% | 39.87% | 1 | 153 |
| Df(1)BSC535 | 25,063 | X:6,625,450;X:6,707,019 (Df) | 6C2;6C8 (Df) | N | 69.12% | 30.88% | 1 | 136 |
| Df(1)BSC351 | 24,375 | X:6,748,387–6,748,403;X:6,860,753 (Df) | 6C11;6D7 (Df) | NΨ | 97.36% | 2.64% | 3 | 189 |
| Df(1)BSC882 | 30,587 | X:6,824,174;X:7,015,408 (Df) | 6D3;6E4 (Df) | N | 77.67% | 22.33% | 1 | 103 |
| Df(1)BSC867 | 29,990 | X:6,981,859;X:7,041,515 (Df) | 6E4;6F1 (Df) | N | 85.68% | 14.32% | 2 | 188 |
| Df(1)Sxl-bt | 3196 | X:6,987,188–7,004,151;X:7,195,487–7,307,939 (Df) | 6E4;7A3-7B1 (Df) | Y | 22.20% | 77.80% | 5 | 439 |
| Df(1)ED6906 | 8955 | X:7,195,084;X:7,405,806 (Df) | 7A3;7B2 (Df) | N | 73.82% | 26.18% | 2 | 96 |
| Df(1)BSC536 | 25,064 | X:7,338,653;X:7,891,613 (Df) | 7B2;7C1 (Df) | N | 83.11% | 16.89% | 2 | 88 |
| Df(1)C128 | 949 | X:7,901,331–7,956,278;X:8,061,645–8,115,848 (Df) | 7C2-7D1;7D5-7D6 (Df) | N | 82.03% | 17.97% | 2 | 184 |
| Df(1)BSC866 | 29,989 | X:8,086,993;X:8,157,322 (Df) | 7D5;7D16 (Df) | Y | 45.61% | 54.39% | 3 | 149 |
| Df(1)BSC662 | 26,514 | X:8,116,248;X:8,489,613 (Df) | 7D6;7F1 (Df) | N | 50.63% | 49.37% | 3 | 270 |
| Df(1)M38-C5 | 5706 | X:8,877,627–8,933,650;X:9,554,623–9,594,143 (Df) | 8B5-8C1;8E7-8E12 (Df) | N | 69.70% | 30.30% | 1 | 33 |
| Df(1)ED6957 | 8033 | X:8,891,795;X:9,135,037 (Df) | 8B6;8C13 (Df) | N | 75.63% | 24.37% | 1 | 119 |
| Df(1)BSC712 | 26,564 | X:9,606,595;X:1,008,6569 (Df) | 8F1;9B1 (Df) | N | 76.02% | 23.98% | 3 | 186 |
| Df(1)ED7005 | 9153 | X:10,071,922;X:10,585,431 (Df) | 9B1;9D3 (Df) | NΨ | 96.94% | 3.06% | 3 | 212 |
| Df(1)BSC755 | 26,853 | X:10,454,979;X:10,848,473 (Df) | 9C4;9F5 (Df) | N | 70.80% | 29.20% | 1 | 113 |
| Df(1)BSC540 | 25,068 | X:10,772,545;X:11,065,010 (Df) | 9E8;10A3 (Df) | N | 61.97% | 38.03% | 1 | 71 |
| Df(1)v-L1 | 6219 | X:10,854,869–10,925,631;X:11,108,482–11,136,887 (Df) | 9F5-9F11;10A4-10A6 (Df) | N | 74.60% | 25.40% | 1 | 63 |
| Df(1)BSC572 | 25,391 | X:10,890.940;X:11,092,253 (Df) | 9F8;10A4 (Df) | N | 78.03% | 21.97% | 1 | 132 |
| Df(1)BSC287 | 23,672 | X:11,182,121;X:11,426,241 (Df) | 10A10;10B11 (Df) | NΨ | 99.62% | 0.38% | 3 | 299 |
| Df(1)BSC722 | 26,574 | X:11,350,466;X:11,754,251 (Df) | 10B3;10E1 (Df) | NΨ | 93.00% | 7.00% | 2 | 89 |
| Df(1)ED7147 | 9171 | X:11714383;X:12004800 (Df) | 10D6;11A1 (Df) | NΨ | 91.24% | 8.76% | 3 | 252 |
| Df(1)ED7161 | 9217 | X:12,007,087;X:12,750,866 (Df) | 11A1;11B14 (Df) | NΨ | 93.11% | 6.89% | 3 | 247 |
| Df(1)ED7170 | 8898 | X:12,752,602;X:13,277,326 (Df) | 11B15;11E8 (Df) | Y | 30.90% | 69.10% | 7 | 532 |
| Df(1)ED7225 | 24,146 | X:13,784,406;X:14,322,206 (Df) | 12C4;12E8 (Df) | NΨ | 100.00% | 0.00% | 1 | 61 |
| Df(1)ED7229 | 9352 | X:14,222,234;X:14,653,944 (Df) | 12E5;12F2 (Df) | N | 57.26% | 42.74% | 2 | 126 |
| Df(1)ED7261 | 9218 | X:14,653,809;X:14,839,412 (Df) | 12F2;12F5 (Df) | N | 87.67% | 12.33% | 5 | 424 |
| Df(1)BSC310 | 24,336 | X:14,842,413;X:15,089,556 (Df) | 12F5;13A10 (Df) | Y | 36.07% | 63.93% | 4 | 175 |
| Df(1)ED7289 | 29732 | X:15,024,777;X:15,125,750 (Df) | 13A5;13A12 (Df) | NΨ | 96.48% | 3.52% | 5 | 543 |
| Df(1)ED7294 | 8035 | X:15,175,415;X:15,450,298 (Df) | 13B1;13C3 (Df) | N | 69.33% | 30.67% | 1 | 150 |
| Df(1)ED7331 | 9219 | X:15,450,255;X:15,813,523 (Df) | 13C3;13F1 (Df) | N | 87.50% | 12.50% | 3 | 239 |
| Df(1)BSC714 | 26,566 | X:15,758,351;X:16,086,028 (Df) | 13E14;14A8 (Df) | N | 81.08% | 18.92% | 1 | 37 |
| Df(1)BSC758 | 26,855 | X:16,005,260;X:16,367,112 (Df) | 14A6;14C1 (Df) | N | 53.67% | 46.33% | 2 | 191 |
| Df(1)BSC772 | 26,869 | X:16,302,976;X:16,423,105 (Df) | 14B9;14C4 (Df) | N | 75.21% | 24.79% | 1 | 117 |
| Df(1)FDD-0024486 | 23,295 | X:16,423,105;X:16,463,156 (Df) | 14C4;14D1 (Df) | N | 77.42% | 22.58% | 1 | 31 |
| Df(1)BSC760 | 26,857 | X:16,526,332;X:16,632,102 (Df) | 14E1;14F2 (Df) | N | 50.14% | 49.86% | 2 | 154 |
| Df(1)BSC582 | 25,416 | X:16,680,721;X:17,091,833 (Df) | 15A1;15E2 (Df) | N | 79.94% | 20.06% | 4 | 501 |
| Df(1)ED7374 | 8954 | X:16,695,187;X:17,107,632 (Df) | 15A1;15E3 (Df) | NΨ | 91.33% | 8.67% | 3 | 253 |
| Df(1)BSC405 | 24,429 | X:17,830,759–17,830,846;X:18,092,832 (Df) | 16D5;16F6 (Df) | N | 83.33% | 16.67% | 1 | 30 |
| Df(1)ED13478 | 29,733 | X:18,085,406;X:18,102,011 (Df) | 16F6;16F7 (Df) | N | 88.55% | 11.45% | 2 | 218 |
| Df(1)BSC352 | 24,376 | X:18,117,467;X:18,374,885 (Df) | 16F7;17A8 (Df) | NΨ | 94.62% | 5.38% | 3 | 274 |
| Df(1)BSC716 | 26,568 | X:18,243,732;X:18,800,267 (Df) | 17A3;17D6 (Df) | N | 84.64% | 15.36% | 2 | 148 |
| Df(1)ED7424 | 9350 | X:18,657,253;X:19,298,773 (Df) | 17D1;18C1 (Df) | N | 86.87% | 13.13% | 2 | 147 |
| Df(1)Exel7468 | 7768 | X:19,264,512;X:19,509,637 (Df) | 18B7;18C8 (Df) | N | 75.00% | 25.00% | 1 | 52 |
| Df(1)BSC275 | 23,171 | X:19,496,689;X:19,580,079 (Df) | 18C8;18D3 (Df) | NΨ | 100.00% | 0.00% | 1 | 22 |
| Df(1)BSC871 | 29,994 | X:19,617,601;X:19,788,713 (Df) | 18D7;18F2 (Df) | Y | 38.96% | 61.04% | 4 | 193 |
| Df(1)BSC586 | 25,420 | X:19,788,713;X:20,429,928 (Df) | 18F2;19D1 (Df) | NΨ | 90.91% | 9.09% | 1 | 44 |
| Df(1)BSC644 | 25,734 | X:20,243,402;X:21,061,001 (Df) | 19C1;19E7 (Df) | N | 80.49% | 19.51% | 1 | 41 |
| Df(1)DCB1-35b | 977 | X:20,939,503–21,345,088;X:22,980,722–23,542,271 (Df) | 19E5-19F5;20F3-h32 (Df) | N | 61.76% | 38.24% | 1 | 34 |
| Df(1)BSC708 | 26,560 | X:21,028,296;X:21,623,866 (Df) | 19E7;20A4 (Df) | Y | 47.56% | 52.44% | 5 | 351 |
| Df(1)Exel6255 | 7723 | X:21,519,203;X:22,517,665 (Df) | 20A1;20C1 (Df) | N | 50.22% | 49.78% | 4 | 390 |
| Allele | Total egg chambers ( | Number of egg chambers with border cells migrating >50% ( | Statistical test | Significance |
|---|---|---|---|---|
|
| 393 | 180 | Chi-square test |
|
| Matched control | 287 | 49 | ||
|
| 292 | 159 | Chi-square test |
|
| Matched control | 354 | 64 | ||
|
| 525 | 198 | Chi-square test |
|
| Matched control | 411 | 67 | ||
|
| 410 | 173 | Chi-square test |
|
| Matched control | 287 | 49 |
| RNAi Line (stock)/Gene | Total egg chambers ( | Number of egg chambers with border cells migrating <75% ( | Statistical test | Significance |
|---|---|---|---|---|
| 64,990 | 238 | 0 | Chi-square test |
|
| 60,102 matched control | 202 | 9 | ||
| 102,339 | 186 | 9 | Chi-square test | ns |
| 60,102 matched control | 239 | 9 | ||
| 41,976 | 152 | 35 | Chi-square test |
|
| 60,102 matched control | 239 | 9 | ||
| 110,286 | 196 | 4 | Chi-square test | ns |
| 60,102 matched control | 239 | 9 | ||
| 28,341 | 185 | 28 | Chi-square test |
|
| 60,102 matched control | 239 | 9 | ||
| 10,1404 | 109 | 39 | Chi-square test |
|
| 60,102 matched control | 259 | 9 |
- —National Science Foundation10.13039/501100008982
- —KSU Johnson Cancer Research Center10.13039/100015421
Peer Reviews
No public reviews on file for this paper yet. If you reviewed it on a platform where reviews are public (OpenReview, ICLR, NeurIPS, ICML), you can paste yours below so the community can read it here.
Videos
No videos yet. Explain this paper in a talk, walkthrough, or lecture? Add one.
Taxonomy
TopicsInvertebrate Immune Response Mechanisms · Protease and Inhibitor Mechanisms · Developmental Biology and Gene Regulation
Introduction
The small GTPase Rap1 has important roles in tissue morphogenesis and integrity, single-cell and collective cell migration, wound healing, and tumor invasion in cancer (Zhang et al. 2017; Chang et al. 2018; Jaśkiewicz et al. 2018; Sawant et al. 2018; Volovetz et al. 2020; Kim et al. 2022; Messer and McDonald 2023; Perez-Vale et al. 2023; Rothenberg et al. 2023; Ueda et al. 2023). Rap1, like other small GTPases, acts as a molecular switch with discrete “on” and “off” states. GTPase activity is regulated by a combination of GTPase activating proteins (GAPs) that speed up GTP hydrolysis and result in inactive GDP-bound GTPases, and guanine nucleotide exchange factors (GEFs) that promote dissociation of GDP allowing GTP to bind (Raaijmakers and Bos 2009; Cherfils and Zeghouf 2013; Zegers and Friedl 2014). Several key regulators have been identified for Rap1, including the GAP Rapgap1 and the GEF PDZ-GEF/Dizzy (Boettner and Van Aelst 2009; Wang et al. 2013; Jaśkiewicz et al. 2018; Sawant et al. 2018). Other signaling partners downstream of Rap1, including Afadin/Canoe and Rap1-interacting adaptor molecule (RIAM), promote Rap1-dependent cellular processes such as cell polarity and adhesion (Su et al. 2015; Bonello et al. 2018; Walther et al. 2018; Bromberger et al. 2021; Hiremath et al. 2023; Rothenberg et al. 2023). Despite progress in identifying some Rap1-effectors, our understanding of how Rap1 coordinates a diverse set of functions in a wide range of tissues remains limited, with many Rap1 roles unaccounted for by these known effectors.
To address this gap, we performed an unbiased dominant genetic interaction screen to identify downstream targets of Rap1 and other Rap1-interacting genes in a migrating cell collective, the Drosophila border cells. Similar approaches in Drosophila models of collective migration and morphogenesis have underscored the power of this technique to quickly identify candidate interacting genes that may otherwise be difficult to uncover (McDonald et al. 2003; Ward et al. 2003; Patch et al. 2009; Geisbrecht et al. 2013; Hurd et al. 2013; Chang et al. 2018). Specifically, we took advantage of the established role of Rap1 in regulating border cell migration, a genetically tractable in vivo model of collective cell migration (Chang et al. 2018; Sawant et al. 2018). Border cells are a group of 6–8 epithelial cells that are specified and recruited as a migratory cohort (cluster) during stages 8–9 of oogenesis. Subsequently, the border cell cluster delaminates from the epithelium, then migrates between germline-derived nurse cells to reach the oocyte boundary by stage 10. The migration of border cells requires integration of guidance cues with Rac1 GTPase activation, which leads to the production of large migratory protrusions at the cluster leading edge (Wang et al. 2010; Montell et al. 2012; Fernández-Espartero et al. 2013; Ramel et al. 2013; Saadin and Starz-Gaiano 2016; Scarpa and Mayor 2016; Roberto and Emery 2022). During the process of border cell collective migration, Rap1 promotes actomyosin polarity, helps restrict protrusions to the leading edge, and contributes to proper E-Cadherin enrichment within the cluster (Chang et al. 2018; Sawant et al. 2018). We know very little, however, about the Rap1-interacting genes that coordinate these critical Rap1-dependent functions.
Notably, similar to the loss of Rap1 function, expression of constitutively active Rap1 (Rap1^V12^) causes severe border cell migration defects (Chang et al. 2018; Sawant et al. 2018). Thus, the levels of Rap1 are critical for normal collective cell migration. Here, we leveraged this phenotype to conduct an unbiased screen for genes whose heterozygous loss modifies the constitutively active Rap1 phenotype. Using a publicly available collection of Drosophila deficiencies that in total remove ∼98% of genes on the X chromosome, we identified 7 genomic regions that dominantly suppressed the Rap1^V12^ migration defects. Through further genetic tests, we mapped three of the interacting regions to individual genes. Specifically, we identified frizzled 4 (fz4), Ubiquitin-specific protease 16/45 (Usp16-45), and strawberry notch (sno) as genes whose heterozygous loss strongly modified the Rap1^V12^-induced border cell migration defects. Furthermore, we found that loss of Usp16-45 and sno on their own also impaired border cell movement. Thus, this screen identified three genes and four additional genetic interacting regions that represent previously uncharacterized Rap1-interacting genes in collective cell migration.
Materials and methods
Drosophila deficiency screen and genetics
The X chromosome deficiency kit (DK1) was obtained from the Bloomington Drosophila Stock Center (BDSC). Females from balanced X chromosome deficiency lines were crossed to slbo-GAL4/CyO; UAS-Rap1^V12^/TM6B, tubGal80 (“slbo > Rap1^V12^”) males (Fig. 1a). In the case of w^1118^ controls, flies from the slbo > Rap1^V12^ stock were crossed to w^1118^. F1 progeny of the correct genotype (lacking balancer chromosomes) were selected and fattened overnight (∼12–24 h) on supplemental yeast at 27°C prior to dissection. Each deficiency in the primary screen was tested at least once; potential interacting deficiency “hits” were then further evaluated. Hits in the primary screen were defined as having at least 50% of border cell clusters migrating more than half of the egg chamber length (the region between the anterior tip and the oocyte anterior border; Fig. 1a). This value is greater than 2 standard deviations above the mean of control egg chambers scored in the primary screen and allowed us to identify high confidence hits. All reported hit lines were subsequently tested a minimum of three times. Potential enhancers were defined as those deficiency regions that resulted in at least 90% of border cell clusters failing to migrate more than half of the egg chamber length. This value is greater than one standard deviation above the mean of control egg chambers. These enhancing deficiencies are flagged in Table 1 but were not pursued further in this study.
Screen to identify Rap1V12 interacting regions. a) Screen design flow, crossing scheme, and egg chamber schematic showing border cell migration scoring criteria. Poor migration includes border cells found from the anterior tip of the egg chamber to the midway point to the oocyte (gray, 0–25% migration distance to the oocyte; magenta, 26–50% migration distance to oocyte). Better migration includes border cells found from the midway point to the oocyte (dark blue, 51–74% migration distance to the oocyte; light blue, 75–100% migration distance to the oocyte). b–d) Stage 10 egg chambers stained for E-cadherin (magenta) to label cell membranes and border cells (arrowheads) and DAPI to label cell nuclei (white). Scale bars, 50 μm. b) A representative slbo > mCD8GFP + w1118 control egg chamber showing border cells (arrowhead) that completed their migration at the oocyte. c) A representative slbo > Rap1V12 + w1118 egg chamber that failed to migrate and stopped at ∼15% of the distance along the migration pathway. d) An example of a candidate dominant modifier of Rap1V12. Here, slbo > Rap1V12 + Df(1)Sxl-bt (3196) border cells exhibit better migration but stopped at the egg chamber midpoint. e) Stacked bar chart displaying percent border cell migration at stage 10 for each of 7 candidate deficiency regions in a slbo > Rap1V12 background with slbo > Rap1V12 + w1118 and slbo > mCD8GFP + w1118 serving as controls. Numbers above each bar indicate the total egg chambers scored per genotype. Colors represent the border cell migration distance to the oocyte as depicted in a. The dashed line at 50% marks the screen hit threshold to be considered a genetic interaction candidate.
To identify relevant genes from the interacting deficiencies, UAS-RNAi lines, and mutant alleles were obtained from the BDSC and the Vienna Drosophila Resource Center (VDRC). For RNAi knockdown of candidate genes, each UAS-RNAi line was crossed to *c306-*GAL4, an early follicle cell driver that has been used for strong RNAi knockdown in border cells (Aranjuez et al. 2016; Plutoni et al. 2019; Miao et al. 2022). To ensure efficient RNAi knockdown, females of the correct genotype were temperature shifted to 29°C for 2 d before being fattened overnight (∼12–24 h) on supplemental yeast at 29°C prior to dissection. Similarly, to test interaction with mutant alleles, *slbo-*GAL4/CyO; UAS-Rap1^V12^/TM6b, tubGal80 males were crossed to mutant females, followed by incubation and fattening at 27°C prior to dissection and imaging of migration.
Immunostaining and imaging
Ovaries were dissected in Schneider's Drosophila Medium (Thermo Fisher Scientific, Waltham, MA, USA) supplemented with 10% fetal bovine serum (Seradigm FBS; VWR, Radnor, PA, USA). Ovaries were then fixed for 10 mins using 16% methanol-free formaldehyde (Polysciences, Inc., Warrington, PA, USA) diluted to a final concentration of 4% in 1× phosphate-buffered saline (PBS). Following fixation, tissues were washed ≥4x with “NP40 block” [50 mM Tris-HCL, pH 7.4, 150 mM NaCl, 0.5% NP40, 5 mg/ml bovine serum albumin (BSA)] and rocked in the solution for ≥30 mins prior to antibody incubation. Primary antibodies, obtained from the Developmental Studies Hybridoma Bank (DSHB, University of Iowa, Iowa City, IA, USA), were used at the following dilutions: rat anti-E-Cadherin 1:10 (DCAD2) and mouse anti-Singed 1:10–1:25 (Sn7C). For GFP detection, rabbit anti-GFP (A11122, Thermo Fisher Scientific) was used at 1:1,000 dilution. Anti-rat, anti-mouse, or anti-rabbit secondary antibodies conjugated to Alexa Flour-488 or −568 (Thermo Fisher Scientific) were used at 1:400 dilution. 4′, 6′-Diamidino-2-phenylindole (DAPI, Millipore Sigma) was used at 2.5 µg/ml to label nuclei. Primary and secondary antibody incubation as well as all other subsequent wash steps were also performed in NP40 block. Dissected and stained ovarioles and egg chambers were mounted on slides with Aqua-Poly/Mount (Polysciences, Inc.). Images of fixed egg chambers were either acquired on an upright Zeiss AxioImager Z1 microscope with Apotome.2 optical sectioning or on a Zeiss LSM 880 confocal laser scanning microscope (KSU College of Veterinary Medicine Confocal Core) using either a 20× 0.75 numerical aperture (NA) or 40× 1.3 NA oil-immersion objective controlled by Zeiss Zen 14 software. Images were processed in FIJI (Schindelin et al. 2012) and figures were assembled using Affinity Photo version 1.10.8 (Serif, Nottingham, United Kingdom). Illustrations were designed in Affinity Photo.
Graphs and statistics
Deficiency regions that were considered “hits” were analyzed for migration a minimum of three times, with a minimum of 20 egg chambers scored per trial. The average of all trials for each “hit” had migration greater than 50% of the migration distance toward the oocyte. This value was determined as >2σ above the mean “migration” for slbo-GAL4, UAS-Rap1^V12^/w^1118^ controls under the same conditions. To identify the relevant genes within the deficiency required for border cell migration in the RNAi tests, we defined a migration defect as the fraction of border cell clusters that failed to reach ≥75% of the migration distance to the oocyte. Chi-squared tests were performed to assess the significance level for each experiment using GraphPad Prism 9 (GraphPad Software, San Diego, CA, USA). See Tables 2 and 3 for raw numbers (N's) and statistics. Graphs were assembled in GraphPad Prism 9. Relevant data from the screening approach were included in graphs where appropriate, but statistical testing was limited to experiments with matched controls.
Results and discussion
A screen of the X chromosome for dominant modifiers of activated Rap1
Previous work demonstrated that regulated Rap1 activity is critical for its function in border cell migration and protrusion dynamics (Chang et al. 2018; Sawant et al. 2018). Expression of constitutively active Rap1 (Rap1^V12^) specifically blocks border cell migration, causes ectopic protrusions, and alters the enrichment of E-Cadherin and F-actin within the cluster. These previous results demonstrate a requirement for Rap1 in generating productive directed protrusions and promoting the distribution of cell–cell adhesions during border cell migration. Rap1 interacts with the Hippo/Warts pathway in directed protrusions (Chang et al. 2018). While other Rap1 effectors likely mediate additional Rap1-dependent functions in border cells, their identities are unknown. Thus, here we performed a dominant modifier screen to identify additional Rap1-interacting genes in border cell migration. The X chromosome was chosen on the basis that chromosomes 2 and 3 had been screened previously for modifiers of constitutively activated Rap1^V12^ (Chang et al. 2018).
For the primary screen, we used the Bloomington Drosophila Stock Center (BDSC) X chromosome deficiency kit (DK1), which on aggregate deletes ∼98% of the euchromatic X chromosome (Cook et al. 2012). Of the 93 lines within this kit, 19 lines were unable to be tested due to complicated genetics and/or health issues of the stocks. We crossed the remaining 74 female strains bearing the X chromosome deficiencies to males expressing UAS*-Rap1*^V12^ driven by the border cell-specific driver slbo-GAL4 (“slbo > Rap1^V12^”; Fig. 1a). Progeny expressing Rap1^V12^ driven by slbo-GAL4 outcrossed to w^1118^ “wild type” background (“slbo > Rap1^V12^ + w^1118^”) exhibited very strong border cell migration defects (Fig. 1a, c, and e). By contrast, slbo-GAL4 driven expression of UAS-mCD8-GFP in a w^1118^ background (slbo > mCD8GFP + w1118) resulted in normal migration (Fig. 1b and e). To quantify the Rap1^V12^ migration defect severity, we divided each egg chamber into four quadrants, 0–25, 26–50, 51–74, and 75–100% of the normal migration distance from the anterior egg chamber tip (0%) to the oocyte (100%; Fig. 1a and e). Relatively few slbo > Rap1^V12^ + w^1118^ border cell clusters traveled past the midpoint of migration (22% of egg chambers; Fig. 1a, c, and e). Therefore, we further simplified our scoring criteria by dividing the egg chamber into a region of “poor migration,” defined as 0–50% of the migration distance before the midpoint of migration, and a region of “better migration,” defined as 51–100% of the migration distance after the midpoint of migration (Fig. 1a). Using these criteria, we then performed the screen for deficiencies on the X chromosome that modified the slbo > Rap1^V12^ migration defects. While we identified enhancers of Rap1^V12^ migration defects (Table 1), these genes may represent more indirect regulators of Rap1 function. Therefore, we focused primarily on suppressors of Rap1^V12^, which we reasoned were more likely to represent genes that function downstream of Rap1. We considered a screen hit as heterozygous loss of a deficiency that resulted in better migration in at least 50% of egg chambers assayed (Fig. 1a and e).
Using this screening approach, we identified 7 deficiency regions that dominantly suppressed the slbo > Rap1^V12^-dependent migration defects (Fig. 1a, d, and e; Table 1). Each of these molecularly defined deficiencies completely or partially deletes an average of 9 genes, though some delete more genes (Cook et al. 2012). Using overlapping smaller deficiencies and publicly available mutant alleles and RNAi lines, we were able to map three of these regions to single interacting genes, which are described below.
Mapping the Df(1)Sxl-bt region reveals an interaction between Rap1 and fz4
The strongest hit in this screen, Df(1)Sxl-bt (BDSC 3196), resulted in better migration in 78% of egg chambers analyzed (Fig. 1d and e; Table 1). This deficiency removes an estimated 191–321 kilobases (kb) of DNA (X:6,987,188–7,004,151 to X:7,195,487–7,307,939) along the X chromosome with a predicted deletion of 31 genes (FlyBase Öztürk-Çolak et al. 2024; Fig. 2a). We next used a smaller deficiency Df(1)BSC867 (X:6,981,859 to X:7,041,515) to further refine the gene region (FlyBase; Fig. 2a). Border cell clusters expressing slbo > Rap1^V12^ and heterozygous for Df(1)BSC867 migrated past the midpoint only 14% of the time, similar to slbo > Rap1^V12^ + w^1118^ alone (Fig. 2c). We therefore considered it unlikely that Rap1-interacting genes resided within this segment of Df(1)Sxl-bt. We next focused on the region extending from the end of Df(1)BSC867 to the end of Df(1)Sxl-bt (X:7,041,515-X:7,307,939). As there were no available deficiencies that overlapped with this region, we next tested for interaction with mutant alleles of characterized genes within the breakpoint region. Only 2 genes within this region, Sex lethal (Sxl) and frizzled 4 (fz4) had characterized loss of function mutant alleles. Therefore, we tested the interaction of Sxl^f2^ and fz4^3–1^ with Rap1^V12^. Border cells migrated past the midpoint in only 1% of slbo > Rap1^V12^ + Sxl^f2^ egg chambers (Fig. 2c). In contrast, border cells in slbo > Rap1^V12^ + fz4^3–1^ egg chambers migrated significantly better, with 46% of clusters migrating past the midpoint compared with 18% in matched slbo > Rap1^V12^ + w^1118^ controls (Fig. 2b and c; Table 2; P < 0.0001, Chi-squared test).
Fz4 lies within Df(1)Sxl-bt and interacts with Rap1V12. a) Schematic genomic region illustrating the location of fz4 within Df(1)Sxl-bt along with overlapping deficiencies and genes tested. The numbers refer to the genomic location of the deficiency. b) A stage 10 Rap1V12 + fz4[3–1] egg chamber with border cells (arrowhead) that have moved past 50% of the egg chamber length. E-cadherin (magenta) labels all cell membranes including the border cells and DAPI labels cell nuclei (white). Scale bar, 50 μm. c) Stacked bar chart displaying border cell migration for slbo > Rap1V12 + w1118, slbo > Rap1V12 + Df(1)BSC867 (BDSC 29990), slbo > Rap1V12 + Sxl[f2] (BDSC 4593), and slbo > Rap1V12 + fz4[3–1] (BDSC 38412). Numbers above each bar indicate the total egg chambers scored per genotype. **** P < 0.0001, 2-sided Chi-square test. Data for slbo > Rap1V12 + Df(1)BSC867 (BDSC 29990) and slbo > Rap1V12 + Sxl[f2] (BDSC 4593) are from the original mapping results and are shown here for simplicity. The statistical test was performed only between slbo > Rap1V12 + fz4[3–1] (BDSC 38412) and the matched slbo > Rap1V12 + w1118 control (Table 2). d) Stacked bar chart displaying border cell migration for c306-GAL4 > GFP RNAi (VDRC 60102), c306-GAL4 > fz4 RNAi#1 (BDSC 64990), and c306-GAL4 > fz4 RNAi#2 (VDRC 102339). Numbers above each bar indicate the total egg chambers scored per genotype. ** P < 0.001, 2-sided Chi-square test; ns, not significant, 2-sided Chi-square test. Cumulative c306-GAL4 > GFP RNAi (VDRC 60102) data for this experiment is shown for simplicity, but statistical tests were performed between the matched experimental and control data (Table 3).
Single-cell RNA sequencing data from the Fly Cell Atlas project revealed the expression of fz4 in both somatic and germline cells of the ovary, indicating that fz4 is expressed in the relevant tissue (Li et al. 2022). Additionally, fz4 transcript is differentially expressed during border cell migration (Burghardt et al. 2023). To determine whether fz4 is required for border cell migration, we targeted fz4 with RNAi using 2 independent, nonoverlapping RNAi lines (fz4 RNAi #1 BDSC 64990 and fz4 RNAi #2 VDRC 102339), each of which was expressed under the control of a strong early follicle cell and border cell driver, c306-GAL4 (Manseau et al. 1997). c306-GAL4 driven expression of a nonessential RNAi targeting GFP (“GFP RNAi”) resulted in normal migration, or ≥75% of the distance to the oocyte (Fig. 2d). Therefore, we considered any border cell clusters that failed to reach the oocyte (≤74% of the migration distance), as having a migration defect. fz4 RNAi #1 resulted in normal migration, with all border cells migrating ≥75% of the distance to the oocyte (Fig. 2d). Similarly, fz4 RNAi #2 resulted in a minimal 5% migration defect that resembled the 3% defect observed in GFP RNAi controls (Fig. 2d; Table 3). These data suggest that fz4 on its own may be dispensable for the ability of border cells to complete their migration to the oocyte.
Fz4 is a member of the Frizzled family of proteins that act as receptors for secreted Wnt proteins (Huang and Klein 2004). Wnt inhibitor of Dorsal (WntD/Wnt8) and Wnt4 both bind Fz4 (Wu and Nusse 2002; Gordon et al. 2005; McElwain et al. 2011). WntD functions in the Toll-Dorsal pathway to pattern the gastrulating embryo but has limited expression in ovarian follicle cells (Ganguly et al. 2005; Rahimi et al. 2016; Li et al. 2022). Wnt4, however, contributes to cell movement in the pupal ovary and is required for border cell migration (Cohen et al. 2002; Kotian et al. 2022). The role for Wnt4 in border cell migration thus may be independent of Fz4. RNAi for Fz4 did not impair migration, with the caveat that the knockdown efficiency may be incomplete. Alternatively, Wnt4 could bind multiple Frizzled proteins to coordinate its function in border cell migration. Indeed, in Drosophila S2 cells, Wnt4 binds to both Fz and Fz2 in addition to Fz4 (Wu and Nusse 2002). Both Fz2 and Fz4 are differentially expressed in border cells (Burghardt et al. 2023). Thus, Fz2 and Fz4 could function redundantly or together in border cells, though this remains to be formally tested.
Currently, it is unclear how fz4 heterozygosity modifies the Rap1^V12^ border cell migration defect. Notably, Rap1^V12^ border cell clusters accumulate excessive E-Cadherin at the cluster periphery (Sawant et al. 2018). Low levels of E-cadherin at the cluster periphery provide optimal traction of border cells upon the nurse cell substrate for forward movement (Niewiadomska et al. 1999; Cai et al. 2014). Wnt4 regulates focal adhesion kinase (FAK) in the pupal ovary, a component of integrin-based focal adhesions (Cohen et al. 2002; Chastney et al. 2025). While Rap1 can regulate integrins in various cell types, FAK is not required for border cell migration and integrins appear to play minor roles in cluster organization (Grabbe et al. 2004; Llense and Martín-Blanco 2008; Sun et al. 2022). It is possible that Wnt4, through Fz4 and possibly other Frizzled receptors, regulates multiple types of adhesions in migratory border cells (Kotian et al. 2022). Loss of fz4, therefore, could be sufficient to modify the adhesion defects caused by Rap1^V12^, but insufficient to cause border cell migration defects on its own.
Mapping the Df(1)BSC533 region reveals an interaction between Rap1 and Usp16-45
Border cell clusters expressing slbo > Rap1^V12^ and heterozygous for Df(1)BSC533 (BDSC 25061) migrated past the migration midpoint 59% of the time (Fig. 1e; Table 1). Df(1)BSC533 deletes approximately 146 kb of DNA (X:5,282,581–5,282,584 to X:5,428,543) along the X chromosome and results in the predicted deletion of 21 genes (FlyBase; Fig. 3a). Two overlapping deficiencies, Df(1)BSC823 (BDSC 27584; X:5,282,581 to X:5,332,808) and Df(1)Exel6290 (BDSC 7753; X:5,364,532 to 5,428,543), each interacted with slbo > Rap1^V12^ (FlyBase; Fig. 3a and d). While these 2 smaller deficiencies do not themselves overlap, the interaction with Df(1)Exel6290 was stronger. Therefore, we focused on the Df(1)Exel6290 region, which deletes 6 genes including Ubiquitin-specific protease 16/45 (Usp16-45;Fig. 3a). A point mutation allele for this gene, Usp16-45^[B]^, was able to partially replicate the interaction observed for this deficiency with Rap1^V12^. Border cells migrated past the midpoint in 52% of slbo > Rap1^V12^ + Usp16-45^[B]^ egg chambers, compared with 19% in matched slbo > Rap1^V12^ + w^1118^ controls (Fig. 3b and d; Table 2; P < 0.0001, Chi-squared test).
Usp16-45 lies within Df(1)BSC533, interacts with Rap1V12, and is required for border cell migration. a) Schematic genomic region illustrating where Usp16-45 lies within Df(1)BSC533 along with overlapping deficiencies tested. b,c) Stage 10 egg chambers stained for E-cadherin (magenta), which labels all cell membranes including the border cells and DAPI to label cell nuclei (white). Arrowheads indicate border cell clusters. Scale bars, 50 μm. b) A Rap1V12 + Usp16-45[B] egg chamber showing with border cells (arrowhead) moving past 50% of the egg chamber length. c) A c306-GAL4 > Usp16-45 RNAi #1 (VDRC 41976) egg chamber with a strong border cell migration defect. d) Stacked bar chart displaying border cell migration for slbo > Rap1V12 + w1118, slbo > Rap1V12 + Df(1)BSC823 (BDSC 27584), slbo > Rap1V12 + Df(1)Exel6290 (BDSC 7753), and slbo > Rap1V12 + Usp16-45[B] (BDSC 57080). Numbers above each bar indicate the total egg chambers scored per genotype. **** P < 0.0001, 2-sided Chi-square test. Data for slbo > Rap1V12 + Df(1)BSC823 (BDSC 27584) and slbo > Rap1V12 + Df(1)Exel6290 (BDSC 7753) are from the original mapping approach and shown here for simplicity. The statistical test was performed only between slbo > Rap1V12 + Usp16-45[B] (BDSC 57080) and slbo > Rap1V12 + w1118 matched control (Table 2). e) Stacked bar chart displaying border cell migration for c306-GAL4 > GFP RNAi (VDRC 60102), c306-GAL4 > Usp16-45 RNAi #1 (VDRC 41976), and c306-GAL4 > Usp16-45 RNAi #2 (VDRC 110286). Numbers above each bar indicate the total egg chambers scored per genotype. **** P < 0.0001, 2-sided Chi-square test; ns, not significant, 2-sided Chi-square test (Table 3).
Usp16-45 is a member of the ubiquitin-specific proteases (USP) subfamily of deubiquitinases (Clague et al. 2019). While Usp16-45 has no known roles in cell migration, the family member nonstop (not), a USP22 ortholog, is required for border cell migration (Badmos et al. 2021). Single-cell RNA sequencing data from the Fly Cell Atlas project revealed the expression of Usp16-45 in both somatic and germline cells of the ovary, indicating that Usp16-45 is expressed in the relevant tissue (Li et al. 2022). Usp16-45 is also differentially expressed in migrating border cells (Burghardt et al. 2023). To determine whether Usp16-45 is required for border cell migration, we expressed RNAi lines targeting the gene under the control of c306-GAL4. Two independent, nonoverlapping RNAi constructs (Usp16-45 RNAi #1 VDRC 41976 and Usp16-45 RNAi #2 VDRC 110286) provided mixed results. Usp16-45 RNAi #1 resulted in moderately strong migration defects, with 24% of border cell clusters failing to reach the oocyte by stage 10 (Fig. 3c and e; Table 3). This value is significantly different than the 3% defect observed in controls (Fig. 3e; Table 3; P < 0.0001, Chi-squared test). Usp16-45 RNAi #2, however, resulted in minimal (2%) migration defects (Fig. 3e; Table 3). Although Usp16-45 RNAi #2 failed to impact migration, it is possible that Usp16-45 RNAi #1 results in more efficient knockdown of Usp16-45. Furthermore, no off-targets are predicted for Usp16-45 RNAi #1, suggesting that the phenotypes observed are produced by specific knockdown of Usp16-45 (Hu et al. 2013). Given the dominant genetic interaction of a Usp16-45 mutant allele with Rap1^V12^ and the phenotypes caused by Usp16-45 RNAi#1, we conclude that Usp16-45 genetically interacts with Rap1 and is required for border cell migration.
Usp16-45 has predicted cysteine-type deubiquitinase activity (FlyBase; Komander et al. 2009). Small GTPases like Rap1 are often regulated by posttranslational modifications (Konstantinopoulos et al. 2007). Posttranslational modification at the CAAX domain, for example, can facilitate membrane targeting of GTPases (Konstantinopoulos et al. 2007). Ubiquitination is a mode of posttranslational modification that can regulate small GTPase stability, activity, and localization (Lei et al. 2021). However, it is currently unclear whether Usp16-45 directly targets Rap1. RAPGEF2, an activating GEF for Rap1, is known to be targeted for ubiquitination (Kim et al. 2015). The RAPGEF2 ortholog PDZ-GEF (also known as Dizzy) is required for border cell migration, though a role for ubiquitination has not been tested (Sawant et al. 2018). These data suggest that the addition or removal of ubiquitin could be critical in regulating Rap1 signaling in border cells. Further work will be required to determine if Usp16-45 targets Rap1 directly, or indirectly via regulation of a signaling partner such as PDZ-GEF or another Rap1-interacting protein.
Mapping the Df(1)ED7170 region reveals an interaction between Rap1 and sno
Border cell clusters expressing slbo > Rap1^V12^ and heterozygous for Df(1)ED7170 (BDSC 8898) migrated past the midpoint in 69% of egg chambers (Fig. 1e; Table 1). Df(1)ED7170 deletes approximately 525 kb of DNA (X:12,752,602 to X:13,277,326) along the X chromosome (FlyBase; Fig. 4a) and interacted strongly with slbo > Rap1^V12^. Df(1)ED7170 is predicted to delete or disrupt 60 genes. Using deficiencies Df(1)ED7165 (BDSC 9058; X:12,752,602 to X:13,138,948) and Df(1)BSC713 (BDSC 26565; X:13,159,870 to X:13,373,704) led us to focus on the region extending from X:13,159,870 to X:13,277,326, which covers the beginning of Df(1)BSC713 to the end of Df(1)ED7170 (FlyBase; Fig. 4a and h). Using available alleles of genes within this region led us to investigate the gene strawberry notch (sno). Sno is a nuclear protein that functions in Notch signaling (Majumdar et al. 1997). Single-cell RNA sequencing data from the Fly Cell Atlas project indicates sno expression in both the germline and somatic cells of the ovary (Li et al. 2022). Using a GFP protein trap in sno, sno^CC01032^, we found that Sno is found in the nuclei of all cells including the nurse cells, follicle cells, and border cells (Fig. 4b and bʹ).
Sno lies within Df(1)ED7170, interacts with Rap1V12, and is required for border cell migration. a) Schematic genomic region illustrating where sno lies within Df(1)ED7170 along with overlapping deficiencies tested. Arrow indicates that Df(1)BSC713 extends beyond the genomic region depicted here. b) Egg chamber with GFP protein trap in sno, snoCC01032, shows Sno nuclear expression (cyan). E-cadherin (magenta) labels cell membranes including the border cells. (B’) Close-up view of the same border cell cluster in b. c) Egg chamber with Notch activity reporter, E(spl)m8-HLH-lacZ (also known as Su(H)-lacZ), which shows nuclear expression in border cells (cyan). DAPI (white) labels cell nuclei. d–g) Stage 10 egg chambers stained for E-cadherin (magenta), which labels all cell membranes including the border cells and DAPI to label cell nuclei (white). d) A Rap1V12 + sno[EF531] egg chamber with the border cells moving past 50% of the egg chamber length. e) A Rap1V12 + Su(H)[2] egg chamber with the border cells moving past 50% of the egg chamber length. f) A c306-GAL4 > Sno RNAi #1 (VDRC 28341) egg chamber with a strong border cell migration defect. g) A c306-GAL4 > Sno RNAi #2 (VDRC 101404) egg chamber with a strong border cell migration defect. b–g) Arrowheads indicate border cell clusters. Scale bars, 20 µm (b and c), 5 µm (b’), and 50 μm (d–g). h) Stacked bar chart displaying border cell migration for slbo > Rap1V12 + w1118, slbo > Rap1V12 + Df(1)ED7165 (BDSC 9058), slbo > Rap1V12 + Df(1)BSC713 (BDSC 26565), slbo > Rap1V12 + sno[EF531] (BDSC 33833), and slbo > Rap1V12 + Su(H)[2] (BDSC 30477). Numbers above each bar indicate the total egg chambers scored per genotype. **** P < 0.0001, 2-sided Chi-square test. Data for slbo > Rap1V12 + Df(1)ED7165 (BDSC 9058) and slbo > Rap1V12 + Df(1)BSC713 (BDSC 26565) are from the original mapping approach and shown here for simplicity. Statistical tests were performed only between slbo > Rap1V12 + sno[EF531] (BDSC 33833) and slbo > Rap1V12 + w1118 matched control or slbo > Rap1V12 + Su(H)[2] (BDSC 30477) and slbo > Rap1V12 + w1118 matched control (Table 2). i) Stacked bar chart displaying border cell migration for c306-GAL4 > GFP RNAi (VDRC 60102), c306-GAL4 > sno RNAi #1 (VDRC 28341), and c306-GAL4 > sno RNAi #2 (VDRC 101404). Numbers above each bar indicate the total egg chambers scored per genotype. **** P < 0.0001, 2-sided Chi-square test. Cumulative c306-GAL4 > GFP RNAi (VDRC 60102) data for this experiment was reported for simplicity, but statistical tests were performed between matched experimental and control data (Table 3).
We were able to partially replicate the interaction observed for Df(1)ED7170 with a loss of function allele for sno, sno^EF531^. Border cells migrated past the midpoint in 37% of egg chambers scored for slbo > Rap1^V12^ + sno^EF531^ compared with 17% in controls (Fig. 4d and h; Table 2; P < 0.0001, Chi-squared test). Genetic interaction experiments in the wing and eye place sno in the Notch pathway (Coyle-Thompson and Banerjee 1993). Rough eye and wing notching phenotypes found in sno mutants are rescued by an extra copy of Notch (Coyle-Thompson and Banerjee 1993). Similarly, combining the hypomorphic nd^1^ allele of Notch with the temperature-sensitive sno^71e3^ allele synergistically enhances the mild wing phenotypes present in nd^1^ alone (Coyle-Thompson and Banerjee 1993). Sno also binds to Suppressor of Hairless [Su(H)] downstream of Epidermal Growth Factor Receptor (EGFR) signaling in Drosophila eye development (Tsuda et al. 2002). Notch activity, as visualized by a lacZ reporter containing both Su(H) and Grainyhead (Grh) binding sites, E(spl)m8-HLH-lacZ, is high in migrating border cells (Fig. 4c; Furriols and Bray 2001; Schober et al. 2005; Wang et al. 2007). Therefore, to determine if the interaction between sno and Rap1^V12^ is related to Sno-dependent regulation of Su(H), we next tested a Su(H) loss of function allele, Su(H)^[2]^. Border cells migrated past the midpoint in 42% of slbo > Rap1^V12^ + Su(H)^[2]^ egg chambers compared with 17% in slbo > Rap1^V12^ + w^1118^ controls (Fig. 4e and h; Table 2). These results indicate that sno and Su(H) both interact with Rap1 in border cell migration, possibly through their roles in the Notch pathway.
We next asked whether sno was essential for border cell migration on its own. Prior work indicates a role for Sno in successful oogenesis. Females homozygous for the sno allele sno^71e1^ had severe defects in oogenesis including a reduced number of ovarioles, dying egg chambers, and disrupted egg chamber polarity (Coyle-Thompson and Banerjee 1993). To determine whether sno is required specifically for border cell migration, we targeted sno with RNAi lines expressed under the control of the follicle cell driver c306-GAL4. Using 2 independent, nonoverlapping constructs (sno RNAi #1 VDRC 28341 and sno RNAi #2 VDRC 101404), we found that sno is required for migration (Fig. 4f, g, and i). sno RNAi #1 resulted in a significant migration defect of 16% (Fig. 4f and i; Table 3). Similarly, we observed 36% migration defects for sno RNAi #2 (Fig. 4g and i; Table 3). The difference in migration defects between RNAi lines is likely due to differences in knockdown efficiency.
How sno and Su(H) contribute to border cell migration via the Rap1 pathway is unclear. Notch and its ligand Delta are required for normal border cell migration (Schober et al. 2005; Wang et al. 2007). Both active Notch and Su(H) are expressed during migration (Fig. 4c; Wang et al. 2007). One downstream target of Notch-Su(H) is Anterior open (Aop, also known as Yan; Schober et al. 2005). Aop regulates the turnover of E-Cadherin required for efficient border cell migration (Schober et al. 2005). One possibility is that Sno could regulate Aop, which in turn impacts migration efficiency via E-Cadherin turnover. The interaction between sno and Rap1^V12^ could thus be explained by a common target, E-Cadherin. Further work will be required to determine if this hypothesis is supported, or if another mechanism is at play.
Conclusions
The goal of this screen was to identify molecular partners and potential effectors of Rap1 GTPase activity that are relevant for collective cell migration. Here, we report 7 deficiency regions that genetically interacted with slbo > Rap1^V12^. Of these 7 regions, three were mapped to single genes. Fz4, Usp16-45, and Sno may function as effectors of Rap1 GTPase or act as parallel factors that similarly regulate border cell migration. Sno and Usp16-45 were each required for border cell migration on their own, while fz4 was not. It is important to note that heterozygous loss of these genes did not completely recapitulate the interaction of the relevant deficiency with Rap1^V12^. This could be due to the heterozygous loss of additional genes in these genomic regions that interact with Rap1 or because of the nature of the mutant alleles used. Additional work will be needed to determine which of these 2 possibilities is most likely. Rap1 functions autonomously in border cells to promote collective cell migration (Chang et al. 2018; Sawant et al. 2018). However, we cannot rule out nonautonomous suppression of Rap1^V12^ border cell migration defects by heterozygous loss of one or more of the deficiency regions from the germline-derived nurse cells. Therefore, future identification of the relevant genes from the four other interacting deficiencies, in border cells and/or in nurse cells, is expected to yield additional Rap1 effectors and interacting genes. In sum, this unbiased genetic modifier screen identified multiple genes that interact with Rap1 during border cell migration. Follow-up studies will be needed to fully characterize how each gene cooperates with Rap1 to facilitate border cell migration and determine if these genes function in other types of collectively migrating cells during development and in cancer.
The reference list from the paper itself. Each links out to its DOI / PubMed record.
- 1Aranjuez G, Burtscher A, Sawant K, Majumder P, Mc Donald JA. 2016. Dynamic myosin activation promotes collective morphology and migration by locally balancing oppositional forces from surrounding tissue. Mol Biol Cell. 27(12):1898–1910. doi:10.1091/mbc.e 15-10-0744.27122602 PMC 4907723 · doi ↗ · pubmed ↗
- 2Badmos H, Cobbe N, Campbell A, Jackson R, Bennett D. 2021. Drosophila USP 22/nonstop polarizes the actin cytoskeleton during collective border cell migration. J Cell Biol. 220(7):e 202007005. doi:10.1083/jcb.202007005.33988679 PMC 8129793 · doi ↗ · pubmed ↗
- 3Boettner B, Van Aelst L. 2009. Control of cell adhesion dynamics by Rap 1 signaling. Curr Opin Cell Biol. 21(5):684–693. doi:10.1016/j.ceb.2009.06.004.19615876 PMC 2841981 · doi ↗ · pubmed ↗
- 4Bonello TT, Perez-Vale KZ, Sumigray KD, Peifer M. 2018. Rap 1 acts via multiple mechanisms to position Canoe and adherens junctions and mediate apical-basal polarity establishment. Development. 145(2):dev 157941. doi:10.1242/dev.157941.29361565 PMC 5825837 · doi ↗ · pubmed ↗
- 5Bromberger T, Klapproth S, Rohwedder I, Weber J, Pick R, Mittmann L, Min-Weißenhorn SJ, Reichel CA, Scheiermann C, Sperandio M, et al 2021. Binding of Rap 1 and Riam to Talin 1 Fine-Tune β2 integrin activity during leukocyte trafficking. Front Immunol. 12:702345. doi:10.3389/fimmu.2021.702345.34489950 PMC 8417109 · doi ↗ · pubmed ↗
- 6Burghardt E, Rakijas J, Tyagi A, Majumder P, Olson BJSC, Mc Donald JA. 2023. Transcriptome analysis reveals temporally regulated genetic networks during Drosophila border cell collective migration. BMC Genomics. 24(1):728. doi:10.1186/s 12864-023-09839-8.38041052 PMC 10693066 · doi ↗ · pubmed ↗
- 7Cai D, Chen SC, Prasad M, He L, Wang X, Choesmel-Cadamuro V, Sawyer JK, Danuser G, Montell DJ. 2014. Mechanical feedback through E-cadherin promotes direction sensing during collective cell migration. Cell. 157(5):1146–1159. doi:10.1016/j.cell.2014.03.045.24855950 PMC 4118667 · doi ↗ · pubmed ↗
- 8Chang Y-C, Wu J-W, Hsieh Y-C, Huang T-H, Liao Z-M, Huang Y-S, Mondo JA, Montell D, Jang AC-C. 2018. Rap 1 negatively regulates the hippo pathway to polarize directional protrusions in collective cell migration. Cell Rep. 22(8):2160–2175. doi:10.1016/j.celrep.2018.01.080.29466741 PMC 6791367 · doi ↗ · pubmed ↗