Physical Activity Measurement Reactivity Among Midlife Adults With Elevated Risk for Cardiovascular Disease: Protocol for Coordinated Analyses Across Six Studies
Kiri Baga, Gabrielle M Salvatore, Iris Bercovitz, Amanda L Folk, Ria Singh, Laura M König, Meghan L Butryn, Jacqueline A Mogle, Danielle Arigo

TL;DR
This study aims to understand how physical activity measurements change when being monitored, among adults at risk for heart disease.
Contribution
The study is the first large-scale coordinated analysis of physical activity measurement reactivity in midlife adults with cardiovascular disease risk factors.
Findings
Results will estimate the extent of physical activity measurement reactivity in at-risk populations.
Findings will identify behaviors most affected by reactivity, such as steps versus exercise minutes.
The study will explore how participant characteristics moderate reactivity patterns.
Abstract
Cardiovascular disease (CVD) remains the leading cause of death in the United States, and adults aged 40-60 years with specific health conditions are at particularly elevated risk for developing CVD. Physical activity (PA) is a key cardioprotective behavior and many interventions exist to promote PA in this group. Effective promotion requires accurate assessment of PA behavior; as PA is often estimated by averaging across multiple days, a threat to accurate assessment is measurement reactivity, or an atypical increase in PA behavior at the start of measurement periods that may bias conclusions. Evidence for PA measurement reactivity is equivocal, though concern has resulted in recommendations to add or drop PA measurement days from inclusion, which may introduce undue burden on participants. At present, the extent of PA measurement reactivity and the behaviors most likely to be affected…
Genes, proteins, chemicals, diseases, species, mutations and cell lines named across the full text — each resolved to its canonical identifier and authoritative record.
Click any figure to enlarge with its caption.
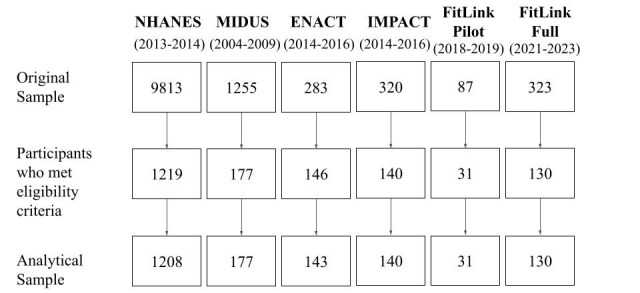 Figure 1
| Study | Device | Duration | Outcomes | |
|
| ||||
|
| NHANESa (n=1208) | ActiGraph GT3X (wrist-worn) | 7 days | Monitor-independent movement summary units |
|
| MIDUSb (n=177) | Actiwatch-64 (wrist-worn) | 6 days | Total activity count units |
|
| ||||
|
| ENACT (n=143) | ActiGraph GT3X+ (hip-worn) | 7 days | Steps per day |
|
| IMPACT (n=140) | ActiGraph GT3X+ (hip-worn) | 7 days | Steps per day |
|
| FitLink Pilot (n=31) | Fitbit and ActiGraph GT3X (hip-worn; week 13) | 7 days | Steps per day |
|
| FitLink Full (n=130) | Fitbit | 7 days | Steps per day |
|
| NHANESa (n=1208) | MIDUSb (n=177) | ENACT (n=143) | IMPACT (n=140) | FitLink Pilot (n=31) | FitLink Full (n=130) | ||||
| Age (years), mean (SD) | 49.9 (6.0) | 50.9 (5.8) | 52.3 (5.6) | 52.9 (5.0) | 50.9 (6.1) | 51.5 (5.7) | ||||
|
| ||||||||||
|
| Women | 628 (52.0) | 105 (59.3) | 117 (81.8) | 116 (82.9) | 28 (90.3) | 109 (83.8) | |||
|
| Men | 580 (48.0) | 72 (40.7) | 26 (18.2) | 24 (17.1) | 3 (9.7) | 21 (16.2) | |||
| BMI (kg/m2), mean (SD) | 31.2 (7.4) | 32.0 (7.2) | 36.3 (4.5) | 35.5 (4.4) | 36.3 (4.5) | 36.5 (4.8) | ||||
|
| ||||||||||
|
| <18.5 kg/m2 | 9 (0.8) | 1 (0.6) | 0 (0.0) | 0 (0.0) | 0 (0.0) | 0 (0.0) | |||
|
| 18.5-25 kg/m2 | 224 (18.6) | 26 (14.7) | 0 (0.0) | 0 (0.0) | 0 (0.0) | 0 (0.0) | |||
|
| 25-30 kg/m2 | 321 (26.6) | 43 (24.3) | 7 (4.9) | 6 (4.4) | 0 (0.0) | 4 (3.1) | |||
|
| >30 kg/m2 | 653 (54.1) | 107 (60.4) | 136 (95.1) | 131 (95.6) | 31 (100.0) | 126 (96.9) | |||
|
| ||||||||||
|
| American Indian or Native Alaskan | —d | 0 (0.0) | 1 (0.7) | 0 (0.0) | 1 (3.2) | 0 (0.0) | |||
|
| Asian | 115 (9.8) | 2 (1.1) | 1 (0.7) | 1 (0.7) | 0 (0.0) | 3 (2.3) | |||
|
| Native Hawaiian or Other Pacific Islander | — | 0 (0.0) | 1 (0.7) | 0 (0.0) | 0 (0.0) | 0 (0.0) | |||
|
| Black or African American | 273 (23.4) | 50 (28.4) | 51 (35.7) | 35 (25.0) | 12 (38.7) | 17 (13.1) | |||
|
| White | 486 (41.6) | 103 (58.5) | 84 (58.7) | 98 (70.0) | 14 (45.2) | 107 (82.3) | |||
|
| Other or mixed race | 32 (2.7) | 21 (11.9) | 5 (3.5) | 6 (4.3) | 4 (12.9) | 3 (2.3) | |||
|
| ||||||||||
|
| Hispanic or Latino | 262 (22.4) | 0 (0.0) | 8 (5.6) | 5 (3.6) | 2 (6.4) | 10 (7.7) | |||
|
| Not Hispanic or Latino/a | 906 (77.6) | 177 (100.0) | 134 (94.4) | 135 (96.4) | 29 (93.6) | 120 (92.3) | |||
|
| ||||||||||
|
| Married | 685 (58.6) | 100 (56.5) | 84 (59.2) | 91 (65.0) | 15 (48.4) | 90 (69.2) | |||
|
| Widowed | 28 (2.4) | 4 (2.3) | 2 (1.4) | 2 (1.4) | 1 (3.2) | 1 (0.8) | |||
|
| Divorced | 198 (17.0) | 32 (18.1) | 22 (15.5) | 21 (15.0) | 4 (12.9) | 8 (6.2) | |||
|
| Separated | 52 (4.4) | 9 (5.1) | 3 (2.1) | 5 (3.6) | 3 (9.7) | — | |||
|
| Never married | 143 (12.2) | 32 (18.1) | 31 (21.8) | 21 (15.0) | 8 (25.8) | — | |||
|
| Single | — | — | — | — | — | 20 (15.4) | |||
|
| Cohabitating | 61 (5.2) | — | — | — | — | 9 (6.9) | |||
|
| Not cohabitating | — | 13 (16.9) | — | — | — | 2 (1.5) | |||
|
| ||||||||||
|
| $0-$25,000 | 294 (25.5) | 63 (36.6) | 9 (6.4) | 4 (2.9) | 1 (3.2) | — | |||
|
| $25,000-$50,000 | 210 (18.2) | 53 (30.8) | 21 (14.9) | 13 (9.5) | 4 (12.9) | — | |||
|
| $45,000-$55,000 | 94 (8.2) | — | — | — | — | — | |||
|
| $50,000-$75,000 | 126 (10.9) | 27 (15.7) | 31 (22.0) | 15 (11.0) | 7 (22.6) | — | |||
|
| $75,000-$100,000 | 113 (9.8) | 14 (8.1) | 24 (17.0) | 23 (16.8) | 6 (19.4) | — | |||
|
| >$100,000 | 251 (21.8) | 8 (4.6) | 13 (9.2) | 20 (14.6) | 2 (6.4) | — | |||
|
| $125,000-$150,000 | — | 2 (1.2) | 18 (12.8) | 17 (12.4) | 6 (19.4) | — | |||
|
| $150,000-$175,000 | — | 2 (1.2) | 8 (5.7) | 18 (13.1) | 0 (0.0) | — | |||
|
| $175,000-$200,000 | — | 0 (0.0) | 5 (3.6) | 13 (9.5) | 2 (6.4) | — | |||
|
| >$200,000 | — | 3 (1.7) | 12 (8.5) | 14 (10.2) | 3 (9.7) | — | |||
|
| ||||||||||
|
| Less than 9th grade | 80 (6.8) | 2 (1.1) | 0 (0.0) | 0 (0.0) | 0 (0.0) | — | |||
|
| Partial high school | 156 (13.4) | 10 (5.6) | 1 (0.7) | 0 (0.0) | 0 (0.0) | — | |||
|
| High school or GEDf | 280 (24.0) | 35 (19.8) | 13 (9.1) | 5 (4.3) | 1 (3.2) | — | |||
|
| Associate’s degree, technical, or partial college | 373 (31.9) | 52 (43.5) | 22 (15.4) | 19 (16.4) | 4 (12.9) | — | |||
|
| Bachelor’s degree | 279 (23.9) | 44 (24.9) | 52 (36.4) | 41 (35.3) | 11 (35.5) | — | |||
|
| Graduate or professional degree | — | 34 (19.2) | 55 (38.5) | 51 (44.0) | 15 (48.4) | — | |||
| Characteristic | NHANESa | MIDUSb | ENACT | IMPACT | FitLink Pilot | FitLink Full |
| BMI | Measured | Measured | Measured | Measured | Measured | Measured |
| CVDc risk | Individual questions (diagnosis) | Individual questions (diagnosis) | WALId and BMI | WALI and BMI | WALI and BMI | WALI and BMI |
| Depressive symptoms | PHQ-9e | CES-Df | BDI-IIg | BDI-II | WALI | BDI-II |
| PA motivation | —h | — | TSRQi | TSRQ | TSRQ | — |
| Weight loss attempts | Self-reported (past year) | — | WALI | WALI | WALI | WALI |
| Social comparison | — | Comparison of CVD risk | INCOMj | — | — | INCOM |
| CVD risk condition | NHANESa | MIDUSb | ENACT | IMPACT | FitLink Pilot | FitLink Full |
| Hypertension | ✓ | ✓ | ✓ | ✓ | ✓ | ✓ |
| High cholesterol | ✓ |
|
|
|
|
|
| Prediabetes | ✓ |
|
|
|
|
|
| Type 2 diabetes | ✓ | ✓ | ✓ | ✓ | ✓ | ✓ |
| Obesity (BMI ≥30 kg/m2) | ✓ | ✓ | ✓ | ✓ | ✓ | ✓ |
| Smoker | ✓ | ✓ | ✓ | ✓ | ✓ |
|
Peer Reviews
No public reviews on file for this paper yet. If you reviewed it on a platform where reviews are public (OpenReview, ICLR, NeurIPS, ICML), you can paste yours below so the community can read it here.
Videos
No videos yet. Explain this paper in a talk, walkthrough, or lecture? Add one.
Taxonomy
TopicsPhysical Activity and Health · Obesity, Physical Activity, Diet · Behavioral Health and Interventions
Introduction
Cardiovascular disease (CVD) remains the leading cause of death in the United States, and risk for CVD meaningfully increases during midlife (ages 40-60 years) [1,2]. Increased risk for CVD during midlife is due to universal aging processes and associated conditions such as obesity and hypertension, as well as to sex-specific metabolic and hormonal changes (eg, the onset of menopause), which result in distinct risk patterns for women and men [2-6]. Engaging in regular physical activity (PA) during midlife can significantly reduce the risk of CVD for both women and men [7,8]. Unfortunately, low PA engagement among midlife adults is common, which exacerbates their CVD risk and contributes to their substantial health care costs [4,9]. This problem persists despite decades of efforts to promote PA that include high participation rates among midlife adults [10,11], and when PA promotion is effective, the benefits of participation are short-lived [12]. This applies to the many PA interventions that are specifically tailored for midlife adults, including those that are gender-specific (ie, enroll only men or women or focus on sex- or gender-specific content, such as PA in the context of gender roles, effects of PA on menopause symptoms, or risk for prostate cancer) [13-18]. Evidence consistently shows that very few midlife adults—particularly those with CVD risk conditions such as obesity, hypertension, or type 2 diabetes—achieve PA levels that would confer significant protection against CVD [19-21]. Thus, additional work is needed to effectively promote PA to reduce CVD risk among midlife adults.
Critically, however, our understanding of current PA engagement and the benefits of PA for reducing CVD risk among midlife adults relies on accurate PA measurements in this at-risk population. Assessment of PA using research-grade or commercially available devices (eg, Fitbit) provides more accurate estimates of PA engagement than methods such as self-report [22]. To ensure accurate estimates by accounting for normal daily variability in PA engagement [23], monitoring periods typically last 7 days, and observed PA behavior (eg, steps per day, minutes of moderate-to-vigorous-intensity activity) is averaged across these days to generate an overall estimate of PA engagement [24]. Evidence across the multidisciplinary field of PA promotion highlights the potential for bias in the assessment of PA using monitoring technology; one source of this bias is measurement reactivity, or change in PA behavior due to the introduction of its measurement [17,21,25,26]. Introducing PA monitoring via an external device during participation in a research study is thought to increase the salience of both immediate PA engagement and the notion that someone else is watching [27,28]. This increased awareness can lead to significantly more PA engagement early in the monitoring period than is typical or sustainable. Specifically, PA measurement reactivity typically manifests as greater PA at the start of observation periods, relative to subsequent days (eg, negative linear slope across days, or higher on day 1 or days 1-2) [25]. When estimates are calculated as averages across days, initial elevation could skew these estimates to show greater engagement than is typical or sustainable [25]. The resulting inflation of PA estimates could mask the effects of PA interventions, as preintervention starting points could be overestimated [17] (among other confounds), leading to incorrect conclusions about PA engagement among at-risk groups such as adults in midlife.
To fully understand the value of promoting PA to reduce CVD risk among adults in midlife with existing risk factors, it is critical to ensure the accuracy of PA measurements in this population. As noted, if measurement reactivity effects are substantial, the resulting biased estimates of PA in at-risk groups such as midlife adults could lead to incorrect conclusions and next steps for PA promotion. PA measurement reactivity has been observed in a subset of studies to date [25,29-31], and some PA researchers consider reactivity a critical source of bias that warrants increased attention and mitigating actions, such as requiring extra days of observation to get used to the PA monitor or removing the first 1-2 days of PA observation from analyses [30]. The evidence is equivocal, however, with some studies showing no reactivity patterns or patterns that are not clinically significant (and thus, would not meaningfully affect overall PA estimates) [25,28]. As a result, there is considerable debate about the need for such drastic measures, or even the need for ongoing attention to this phenomenon. PA recordings on these days represent actual PA engagement, even if the level of engagement is not “typical,” and adding assessment days increases participant burden [32]. Consequently, the extent of PA measurement reactivity and best practices for handling PA data to address the potential for it to affect estimates have yet to be identified.
Existing evidence is also limited in three key ways. First, studies of PA measurement reactivity have often focused on children or healthy, younger adults. Because these populations generally are more active than midlife adults with elevated risk for CVD (or similar at-risk groups) [19,33], they may respond differently to the introduction of PA monitoring. Second, there is little consistency between existing studies with respect to definitions of reactivity or which PA outcomes are affected; outcomes of interest have included steps per day, light PA, moderate-to-vigorous PA (MVPA), and sedentary time [29,30,33], which have distinct implications for CVD risk that differ by gender [34,35]. In addition, some work has defined reactivity as an overall linear decrease in PA across days of observation [25,36], whereas others have examined direct comparisons between day 1 and subsequent days (days 2, 3, 4, or combinations) [29,37]. Third, there has been little attention to the contexts where PA measurement reactivity is a meaningful problem, leading to inconsistent and often drastic recommendations for addressing it. As noted, these include adding observation days, which increases participant burden, and removing the first 1-2 days of observation, which reduces the precision of estimates (or both of these steps) [25,27,30,38]. Although there is some convergence in PA estimates between commercially available wearable devices and research-grade monitors [39], differences in the location of wear (eg, wrist vs hip) and the extent to which a device offers PA feedback (eg, via a digital display of accumulated steps per day in real time) could influence reactivity by differentially increasing the salience of PA [31]. Assessment of PA prior to the start of an intervention (vs in studies that use observation alone) may also affect reactivity via differences in participants’ anticipation of future increases in their PA [30].
In addition, individual differences in mental health symptoms, physical health characteristics, and psychosocial processes are known determinants of PA engagement and thus may influence reactivity patterns [39]. For example, depressive symptoms, number of cardiovascular risk factors, and BMI are negatively associated with PA engagement [40,41] and, as a result, may limit reactivity. In contrast, tendencies toward self-evaluation relative to others and increased motivation for health behaviors may have the opposite effects [40,42]. Specifically, women and those who have stronger tendencies to make and value social comparisons (ie, self-evaluations of one’s traits or behaviors compared to others [43]) may show greater measurement reactivity responses, as these individuals may be particularly interested in managing others’ perceptions of them (such as researchers) [43-46]. Higher (vs lower) levels of PA motivation and more (vs fewer) past attempts at PA behavior change may also be associated with stronger reactivity responses, as these may indicate greater focus on PA overall [47]. Greater attention to individual differences and contexts, rather than treating PA measurement reactivity as universally problematic versus not (as it is currently), could identify optimal and tailored targets for mitigating reactivity in future studies.
Thus, the role of PA measurement reactivity in PA promotion for at-risk groups remains unclear, and no existing study has examined the extent of reactivity based on research design, study procedures, and individual participant characteristics. For this study, we will capitalize on the availability of existing data resources with a multilevel coordinated analysis across 6 studies (including 2 nationally representative observational studies and 4 intervention trials) to achieve the following aims:
To characterize midlife adults’ PA measurement reactivity in each dataset. We will determine whether daily PA engagement meaningfully changes over 6-7 days of observation, across available PA outcomes. Available data include monitor-independent measurement summary (MIMS) units, activity counts, and steps per day.To determine whether the presence or extent of measurement reactivity differs based on demographic, medical, or psychological characteristics. We hypothesize that reactivity will be weaker among adults with higher (vs lower) BMIs, numbers of CVD risk factors, and depressive symptoms. Conversely, we hypothesize that reactivity effects will be stronger among women, adults with higher (vs lower) PA motivation and social comparison tendencies, and those with more previous attempts to increase PA or lose weight. We will further examine whether gender moderates the effects of other individual difference characteristics on PA engagement over 6-7 days by including the interaction effect between gender and other predictors.To determine whether the presence or extent of measurement reactivity differs based on study characteristics. We hypothesize that reactivity effects will be stronger in studies that use observation only (as there is no expectation of later improvement), commercially available devices (which tend to be visible throughout the day), wrist wear (based on both visibility and sensitivity to movement [31,48]), and devices that offer feedback in real time (as they provide additional information that can prompt a behavioral response [49]). We will further examine whether gender moderates the effects of study characteristics on PA engagement over 6-7 days by including the interaction effect between gender and other predictors.
Methods
Overview
Using a coordinated analysis approach [50], we will model differences in PA engagement across days of observation using data from each of the 6 studies. These include 2 observational studies that have publicly available datasets and 4 clinical trial datasets. All data were collected between January 2005 and January 2023. Procedures included 6-7 days of intensive PA assessment using a research-grade or commercially available device. Analysis of available datasets leverages existing resources to address questions beyond those originally intended; this limits cost and eliminates additional participant burden while offering insights into important phenomena [51]. This approach is uniquely suited for the present study, as the concern about PA measurement reactivity is that it appears any time PA monitoring devices are introduced. If this concern is warranted, evidence of measurement reactivity should be observed in studies that were not specifically designed to test this phenomenon (eg, studies for which PA was assessed for other purposes and data are already available). The datasets used for this set of secondary analyses were selected for their accessibility to the research team, representation of a large number and range of individuals in the target population, and heterogeneity in study designs and monitoring PA devices used. Together, these datasets will enable examination of reactivity patterns following the introduction of PA measurement devices in multiple people and contexts.
Observational Studies
These include samples from the National Health and Nutrition Examination Survey (NHANES) [52] and the Midlife in the United States (MIDUS) [1] Study (combined n=1385). NHANES is a national, longitudinal program of research focused on understanding various aspects of health among adults and children in the United States, and data are publicly available. We will use data from the most recent wave of collection that included PA monitoring (2013-2014; 7 days of assessment with the ActiGraph GT3X). MIDUS is a longitudinal investigation of life circumstances and health outcomes among adults aged 25-75 years. The present analyses use data from the MIDUS Biomarker Project (2004-2009), which included PA monitoring (6 days of assessment with the Actiwatch-64).
Randomized Clinical Trials
These studies were tests of improvements to standard behavioral weight loss treatment (4 studies, combined n=444). Each study used a 7-day pretreatment observation window, which will be used to examine PA measurement reactivity. Project ENACT (NCT01858714) tested the effects of an enhanced focus on the food environment and the use of acceptance and commitment skills to support behavior change on long-term weight loss [53]. The collection of the data to be used in the planned analyses began in 2011 and finished in 2013. Project IMPACT (NCT02363 010) tested an increased emphasis on PA and acceptance and commitment skills to support behavior change on long-term weight loss [54]. Collection of the data to be used in the planned analyses began in 2014 and finished in 2016. The last 2 studies examined the added benefits of sharing PA self-monitoring data, either with coaches (Project FitLink Pilot, 2018-2019; NCT03337139 [55]) or with coaches, a designated member of the participant’s existing social network (friend or family member), and other participants (Project FitLink Full, 2021-2023; NCT05180448 [56]). ENACT and IMPACT used the same research-grade accelerometer (Actigraph GT3X), worn on the hip. FitLink Full used a commercially available wearable PA monitor (Fitbit Inspire 2), worn on the wrist, and FitLink Pilot used both the research-grade hip-worn accelerometer and a commercially available wrist-worn monitor (Fitbit Flex; Table 1). The commercial device was worn from the baseline period through treatment; the research-grade device was added at a 3-month assessment (ie, at randomization to condition after a uniform treatment period). ENACT, IMPACT, and FitLink Pilot were conducted in person in a large city in the northeastern United States, whereas FitLink Full was conducted remotely using national recruitment and enrollment.
Participants
Eligible participants are adults in midlife (aged 40-60 years) with ≥1 risk factors for CVD who completed the relevant PA assessment period (see below for additional details about inclusion in data analyses). CVD risk factors include prediabetes, type 2 diabetes, hypertension, high cholesterol, obesity, and current smoking. As noted, observational studies (n=1385) recruited nationally in the United States; clinical trials (n=444) were behavioral weight loss studies completed in the northeastern United States, one of which was conducted remotely. Participant demographics are listed in Table 2.
Procedures
Datasets were chosen for the availability of consecutive days of PA measurement captured immediately following the introduction of commercial and research-grade accelerometers. PA data were recorded using research-grade or commercially available devices (see Table 1). Participant demographics and individual difference characteristics were collected using questionnaires or structured interviews. Specific details about these measures are described in detail below.
Measures
Demographics
Participants’ basic demographics were collected via self-report. These data included age, gender, racial and ethnic identity, marital status, income, and education (see Table 2). NHANES collected these data during structured, in-person interviews with participants. The remaining studies captured these data using electronic or paper questionnaires.
Physical Activity
Included studies captured 6-7 days of PA data using different PA monitoring devices and will enable examination of device-specific effects. ActiGraph devices were used for observational studies and 3 (of 4) clinical trials. These devices were wrist-worn and hip-worn ActiGraph models for observational studies and clinical trials, respectively; remaining clinical trials used commercially available Fitbit devices (see Table 1). PA outcomes were daily PA summary metrics or steps per day. Observational studies used MIMS units [57] and total activity counts; clinical trial datasets provided steps per day (also detailed in Table 1). Steps per day captured using Fitbit at baseline and both a Fitbit and ActiGraph at 3 months into treatment during the FitLink Pilot will allow for comparison of potential recurrence of reactivity patterns after the onset of behavioral weight loss treatment.
Individual Difference Measures
Measures of individual differences are shown in Table 3.
CVD risk conditions include prediabetes or type 2 diabetes, hypertension, high cholesterol, obesity, or current smoking. Participants were prompted to report whether they had a physician diagnosis of prediabetes, type 2 diabetes, hypertension, and high cholesterol. BMI ≥30 kg/m2 will be used to indicate obesity and will be calculated based on measured height and weight. Table 4 summarizes the risk factors assessed in each study. Participants with pre-existing CVD will be excluded from analyses, including those who self-report a history of heart disease, heart failure, stroke, or heart attack. We will calculate the proportion of CVD risk factors endorsed out of the risk factors assessed to determine an overall risk percentage.
Depressive symptoms were measured in each study using validated self-report measures, including the Patient Health Questionnaire (PHQ-9) [58], the Center for Epidemiologic Studies Depression Scale (CES-D) [59], and the Beck Depression Inventory [60]. Total scores for these measures range from 0 to 27, 0 to 60, and 0 to 63, respectively, with higher scores indicating more severe depressive symptoms. Depressive symptoms were captured for the FitLink Pilot using the Weight and Lifestyle Inventory (WALI [61]), which prompts participants to report experience of depressed mood or anhedonia during the past month.
Social comparison will be examined for 3 datasets (ie, MIDUS, ENACT, and FitLink Full). MIDUS captured health-related social comparison experiences; participants were prompted to indicate their perception of their level of risk for a heart attack compared to others (ie, higher, lower, or the same) and the degree of this difference (eg, a lot higher, somewhat higher, or only a little higher). Social comparison experiences for clinical trial participants were measured using the Iowa-Netherlands Comparison Orientation Measure (INCOM) [43]. This measure assesses respondents’ perceptions of their own tendency to make social comparisons, generally and tendencies toward upward (ie, better off) and downward (ie, worse off) comparison targets. Higher total scores indicate stronger tendencies toward social comparison.
Motivation to be physically active was assessed for 3 datasets (clinical trials; ie, ENACT, IMPACT, FitLink Pilot) using an adapted version of the Treatment Self-Regulation Questionnaire (TSRQ [62]). This measure assesses different types of motivation for changing health behaviors by capturing the extent to which respondents endorse particular reasons for changing their health behavior on a scale (from 1=not at all true to 7=very true). Specific TSRQ item scores are summed to calculate summary scores for autonomous motivation, introjected regulation, external regulation, and amotivation, with higher scores indicating greater endorsement of motivation subtypes.
History of weight loss attempts was collected in 5 studies. All 4 clinical trials used the WALI [61], which asks respondents to report their age at the time of these efforts, weight loss method, and pounds lost. These occurrences will be summed to indicate participants’ history of weight loss attempts. NHANES collected these data by prompting participants to indicate if they attempted weight loss during the past year, and if so, asking whether they used specific weight loss methods. Participants’ responses to these prompts will be summed to indicate the total number of weight loss methods used during the past year.
Ethical Considerations
The coordinated, secondary analysis plan outlined here is approved as exempt (no human subjects enrollment) by the Institutional Review Board at Rowan University and Rowan-Virtua School of Osteopathic Medicine (protocol number PRO-2021-550). Original data collection for public datasets and clinical trials was approved by the organizations’ home institutional review boards, and participants received monetary compensation for their time and effort [1,52-56]. All consent processes involved authorization for secondary analyses. Datasets were anonymized or deidentified prior to analyses.
General Analysis Plan
Our primary analyses will examine how device-assessed PA behavior varies within persons across days of participation, using multilevel models. Each dataset includes summary indicators of PA on a given day, and days are nested within persons, creating dependence best accounted for by 2-level multilevel models. Primary outcomes of interest will be MIMS units, activity counts, and steps per day, as available in each dataset. As noted, data from participants who met demographic and medical criteria were included in the present analyses. We also set minimum PA monitoring device wear time to 10 hours of wake time per day, and days with <10 hours of valid wear time were excluded from analyses. The original, reduced, and analytical sample sizes for each study based on these criteria are provided in Figure 1.
Anticipated analytical sample sizes for included studies. MIDUS: Midlife in the United States; NHANES: National Health and Nutrition Examination Survey.
Coordinated Analysis Approach
As we have multiple datasets that share subsets of our outcomes and moderators of interest, we will use coordinated analysis to arrive at conclusions [50]. In coordinated analysis, models are parameterized and fit to datasets, and statistical results from specific datasets are compared and contrasted to efficiently replicate substantive conclusions [63,64]. Given the differences in study design, we will fit equivalent models separately across datasets, and standardized estimates can be generated to determine the consistency of effects with respect to direction and relative size. As in our previous work, we will use semipartial correlation coefficients as standardized effect size estimates [65-68]. Fitting separate models also allows for exploration of dataset-specific covariates and associations to address substantive questions relevant to individual datasets.
Aim 1
To address our first aim, we will fit models that examine whether daily parameters of PA behavior at level 1 change within a person as a function of day of measurement to describe the pattern of measurement reactivity. For these models, we will examine day of measurement as a continuous predictor of PA using both linear and quadratic trends. Further, we have the opportunity to consider the day of measurement as a categorical predictor to identify whether a particular day of measurement shows greater or lower activity counts relative to adjacent days. As in previous work, we will document patterns where day 1 and days 1-2 meaningfully differ from other days of observation as measurement reactivity [29,37,65,69].
Aim 2
We will then add moderators of change across days to address our second aim: to understand whether patterns of measurement reactivity differ based on BMI, percentage of CVD risk factors assessed, depressive symptoms, and gender. We will also examine whether patterns of measurement reactivity depend on motivation to engage in PA, social comparison responses, and previous attempts to lose weight. All moderators will be entered at level 2 as between-person predictors, and the cross-level interaction with the day of measurement will be included to assess for differences in patterns of measurement reactivity. We will also examine whether any reactivity that does emerge differs between genders. To do this, we will incorporate the 3-way interaction among gender, day of measurement, and the above moderators. Significant interactions will be probed with specific contrasts and visualizations separately for each group for categorical moderators or at 1 SD above and below the mean for continuous moderators.
Aim 3
To address our third aim, we will use standardized estimates to compare the effect of the day of measurement on PA summary scores across study designs and device characteristics. Consistent with our follow-up analyses for our second aim, we will incorporate a cross-level interaction with gender and day of measurement to determine whether any effects of study design and device type depend on the gender of the individual being measured.
Results
The datasets described provide 11,707 valid PA observations across 1832 adults in midlife with ≥1 risk factor for CVD. As indicated, participant characteristics for each study can be found in Table 2. Dataset acquisition is complete, and data cleaning in preparation for analysis is underway. We expect to complete analyses by April 2025 and to make full results available by July 2025.
Discussion
This study will be the first to systematically investigate PA measurement reactivity in a population with elevated CVD risk using a coordinated multilevel analysis. Analyses will be executed on a large, diverse sample of midlife adults with elevated risk for CVD, who are frequent targets of PA promotion and who make up substantial subgroups in broader PA programs [2-7]. A critical advantage of the proposed analytic approach is that days will be treated separately and nested within individuals to determine the extent of potential effects of reactivity on estimates of averages [22]. This approach will also be applied across multiple research designs, PA monitoring devices, and individual difference characteristics, allowing for the identification of potential moderators of PA measurement reactivity responses.
A noteworthy limitation of our approach is that there is no opportunity to compare the same PA outcome across all studies. Only certain variables are publicly available for NHANES and MIDUS (ie, total activity counts and MIMS units, respectively), and these cannot be converted to estimates of steps or minutes of activity per day [70]. Conversely, only the latter are available for clinical trials, and these cannot be converted to corresponding units. To address this, we will report and compare standardized effect sizes across outcomes and studies [24]. In addition, a subset of participants in each study did not contribute enough valid PA data to be included, and participants who were included occasionally had days where valid data were missing due to insufficient wear time on that day (<20% of expected days) [25]. An additional advantage of a multilevel modeling approach is that these models are robust to missing data [71,72]. Thus, estimates and conclusions are unlikely to be affected by the observed level of missingness at the day level [25,28]. At the person level, we will also compare participants who were included in analyses to those who were excluded for having too few days of valid PA data. This will allow us to determine whether these groups differ with respect to demographic or medical characteristics and to what extent this level of missingness might impact the generalizability of our findings.
As noted, there is considerable debate about the need for substantial steps to address PA measurement reactivity, such as adding and removing days of observation or blinding participants to PA feedback from their measurement devices [25,29-31,73]. Limitations notwithstanding, findings from this study will indicate whether such steps are warranted among adults in midlife with elevated CVD risk and under what circumstances (eg, across participants or study designs vs for certain subgroups or study designs). Adults in this population are primary targets and recipients of PA assessment research and intervention, as evidence consistently shows low PA in this group despite considerable PA promotion efforts. However, very little PA measurement reactivity work has focused on this group. Drastic measures to minimize reactivity responses may improve PA estimates if reactivity is substantial; if not, such measures are likely to limit the benefits of self-monitoring in an intervention [74], as well as waste resources and increase participant burden for those who are most in need of support. Alternatively, there may be subgroups for whom or research contexts in which PA measurement reactivity is particularly problematic. Focusing attention on low-burden ways to minimize reactivity responses in situations where it is most likely to bias PA estimates would be more cost-effective than universal measures. For example, introducing participants to the concept and the possibility of reactivity, encouraging participants to be aware of it, and emphasizing engagement in normal PA behavior despite research participation or the presence of a monitor may effectively mitigate effects on PA estimates [65,75]. Such an approach, rather than adding days of assessment, would also increase the accessibility of research and intervention for midlife adults, who often have busy, unpredictable schedules [76] and who may find additional days of assessment overwhelming (and therefore, decline to participate or withdraw after enrollment [77,78]). Findings from this study will provide high-quality evidence to determine the effect of measurement reactivity on PA estimates in a key population of interest, and thereby contribute to best practice recommendations for measuring PA in daily life [31,38].
The reference list from the paper itself. Each links out to its DOI / PubMed record.
- 1Brim OG Ryff CD Kessler RC How Healthy Are We? A National Study of Well-Being at Midlife 2019 Chicago, IL University of Chicago Press
- 2Rodgers JL Jones J Bolleddu SI Vanthenapalli S Rodgers LE Shah K Karia K Panguluri SK Cardiovascular risks associated with gender and aging J Cardiovasc Dev Dis 20196219 10.3390/jcdd 602001931035613 jcdd 602001931035613 PMC 6616540 · doi ↗ · pubmed ↗
- 3Matthews KA Crawford SL Chae CU Everson-Rose SA Sowers MF Sternfeld B Sutton-Tyrrell K Are changes in cardiovascular disease risk factors in midlife women due to chronological aging or to the menopausal transition?J Am Coll Cardiol 2009542523662373 10.1016/j.jacc.2009.10.00920082925 S 0735-1097(09)03447-020082925 PMC 2856606 · doi ↗ · pubmed ↗
- 4Appelman Yvan Rijn BB Ten Haaf ME Boersma E Peters SAE Sex differences in cardiovascular risk factors and disease prevention Atherosclerosis 2015241121121810.1016/j.atherosclerosis.2015.01.02725670232 S 0021-9150(15)00061-125670232 · doi ↗ · pubmed ↗
- 5Karvinen S Jergenson MJ Hyvärinen M Aukee P Tammelin T SipiläS Kovanen V Kujala UM Laakkonen EK Menopausal status and physical activity are independently associated with cardiovascular risk factors of healthy middle-aged women: cross-sectional and longitudinal evidence Front Endocrinol (Lausanne)201910589 10.3389/fendo.2019.005893154386531543865 PMC 6729112 · doi ↗ · pubmed ↗
- 6Kapoor E Collazo-Clavell ML Faubion SS Weight gain in women at midlife: a concise review of the pathophysiology and strategies for management Mayo Clin Proc 201792101552155810.1016/j.mayocp.2017.08.00428982486 S 0025-6196(17)30602-X 28982486 · doi ↗ · pubmed ↗
- 7Piercy KL Troiano RP Physical activity guidelines for Americans from the US Department of Health and Human Services Circ Cardiovasc Qual Outcomes 20181111 e 005263 10.1161/CIRCOUTCOMES.118.0052633057133930571339 · doi ↗ · pubmed ↗
- 8Shiroma EJ Lee I Physical activity and cardiovascular health: lessons learned from epidemiological studies across age, gender, and race/ethnicity Circulation 2010122774375210.1161/CIRCULATIONAHA.109.91472120713909122/7/74320713909 · doi ↗ · pubmed ↗