Corrigendum: Redefining vascular repair: revealing cellular responses on PEUU—gelatin electrospun vascular grafts for endothelialization and immune responses on in vitro models
María A. Rodríguez-Soto, Alejandra Riveros-Cortés, Ian C. Orjuela-Garzón, Inés María Fernández-Calderón, Cristian F. Rodríguez, Natalia Suárez Vargas, Carlos Ostos, Carolina Muñoz Camargo, Juan C. Cruz, Seungil Kim, Antonio D'Amore, William R. Wagner, Juan C. Briceño

Abstract
Genes, proteins, chemicals, diseases, species, mutations and cell lines named across the full text — each resolved to its canonical identifier and authoritative record.
Click any figure to enlarge with its caption.
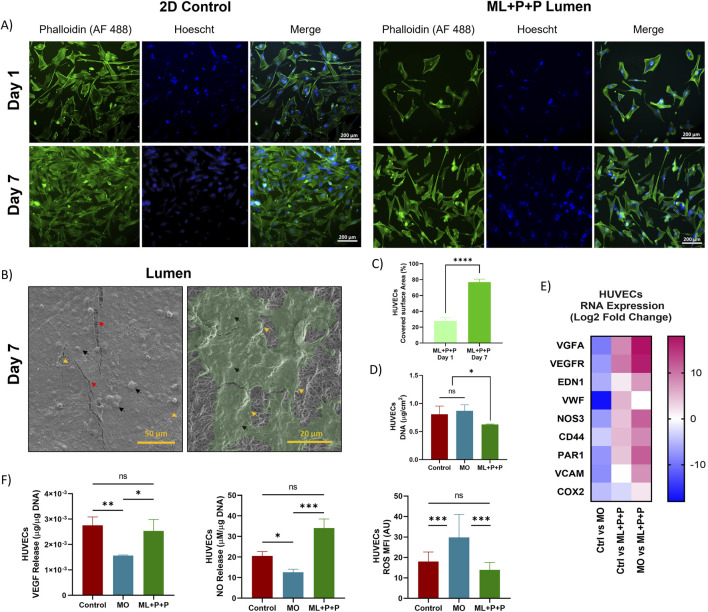 Figure 1
- —Ministerio de Ciencia, Tecnología e Innovación 10.13039/100022965
Peer Reviews
No public reviews on file for this paper yet. If you reviewed it on a platform where reviews are public (OpenReview, ICLR, NeurIPS, ICML), you can paste yours below so the community can read it here.
Videos
No videos yet. Explain this paper in a talk, walkthrough, or lecture? Add one.
Taxonomy
TopicsElectrospun Nanofibers in Biomedical Applications
In the published article, there was an error in Figure 9 as published. The image labeled as “2D control Day 1 panel of Phalloidin (AF 488)” was mistakenly similar to the image labeled as “ML + P + P Lumen Day 7 panel of Phalloidin (AF 488) due to a mislabeling during file organization.” The corrected Figure 9 and its caption “Endothelialization potential of ML + P + P with HUVECs seeded on the luminal surface. (A) Phalloidin staining at days 1 and 7 compared with a 2D control on a glass slide. (B) SEM images of Endothelial cell lining. Black arrows highlight cells and cell nuclei, yellow arrows indicate cell boundaries, and red arrows correspond to cracks in the fixed cell monolayer resulting from sample processing; beneath this layer, electrospun fibers are visible. (C) Percentage of covered surface area by HUVECs, data normalized from with 2D control. (D) DNA quantification at 7 days. (E) RNA expression profile. (E) VEGF and NO release. (F) Intracellular ROS production. (Mean ± SD) where, ns = no significant *p ≤ 0.05, **p ≤ 0.01, ***p ≤ 0.001, ****p ≤ 0.0001.” appear below.
The authors apologize for this error and state that this does not change the scientific conclusions of the article in any way. The original article has been updated.