Correlation analysis between serum uric acid and carotid intima-media thickness: a cross sectional study
Ziheng Zhang, Peng Zhang, Xiangli Yu, Zhongmin Ji, Aimei Zhang, Hongjun Wang, Daojing Li

TL;DR
This study finds that higher serum uric acid levels above a certain threshold are linked to increased carotid artery thickness, suggesting a possible link to atherosclerosis.
Contribution
The study identifies a non-linear relationship and a specific threshold of uric acid levels associated with carotid intima-media thickness.
Findings
A non-linear relationship between serum uric acid and CIMT was identified with a threshold at 3.15 mg/dL.
Uric acid levels above 3.15 mg/dL were positively correlated with increased CIMT.
No significant association was found for uric acid levels below 3.15 mg/dL.
Abstract
This study aims to investigate the association between serum uric acid (UA) and carotid intima-media thickness (CIMT) in adults undergoing routine health screenings. Clinical data from 375 participants (mean age: 64.26 ± 9.97 years; 48.53% male) who underwent health examinations at Jining Medical University Affiliated Hospital (January 2022–January 2023) were analyzed. Generalized additive models and piecewise linear regression were used to evaluate linear/non-linear relationships and threshold effects. The study included a total of 375 individuals, with an average age of 64.26 ± 9.97 years. The participants consisted of 48.53% males. After adjusting for confounding factors (age, sex, BMI, etc.), a non-linear relationship between UA and CIMT was identified. The threshold occurred at UA = 3.15 mg/dL. When UA ≥ 3.15 mg/dL, each 1 mg/dL increase in UA was associated with a 0.061 mm…
Genes, proteins, chemicals, diseases, species, mutations and cell lines named across the full text — each resolved to its canonical identifier and authoritative record.
Click any figure to enlarge with its caption.
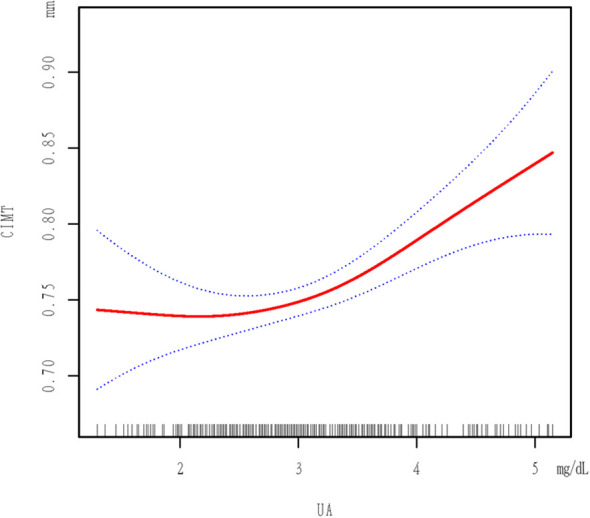 Figure 1
| UA Category | Q1 (N=93) 1.298-2.552 | Q2 (N=94) 2.553-3.014 | Q3 (N=91) 3.015-3.590 | Q4 (N=97) 3.602-5.148 | P-value |
|---|---|---|---|---|---|
| Age, y | 64.04 ± 10.34 | 65.80 ± 9.60 | 63.88 ± 10.70 | 63.35 ± 9.23 | 0.270 |
| SEX (%) | <0.001 | ||||
| Male (%) | 25 (26.88%) | 38 (40.43%) | 56 (61.54%) | 63 (64.95%) | |
| Female (%) | 68 (73.12%) | 56 (59.57%) | 35 (38.46%) | 34 (35.05%) | |
| SBP, mmHg | 134.06 ± 18.78 | 135.49 ± 19.91 | 133.21 ± 15.38 | 135.59 ± 18.49 | 0.697 |
| DBP, mmHg | 77.53 ± 12.28 | 78.61 ± 12.47 | 80.56 ± 11.17 | 80.87 ± 11.56 | 0.142 |
| Heart rate, beats per minute | 74.903 ± 9.537 | 74.691 ± 11.746 | 73.736 ± 11.326 | 76.237 ± 13.212 | 0.522 |
| BMI, kg/m² | 24.30 ± 2.85 | 24.31 ± 3.54 | 24.99 ± 3.28 | 26.30 ± 2.95 | <0.001 |
| CR, µmol/L | 55.88 ± 16.99 | 60.12 ± 13.69 | 63.48 ± 14.72 | 72.60 ± 24.63 | <0.001 |
| Cystatin C, mg/L | 1.01 ± 0.22 | 1.11 ± 0.45 | 1.12 ± 0.34 | 1.15 ± 0.25 | <0.001 |
| FPG, mmol/L | 5.57 ± 2.00 | 5.31 ± 1.75 | 5.10 ± 1.01 | 5.53 ± 1.91 | 0.289 |
| Triglyceride, mmol/L | 1.24 ± 0.66 | 1.32 ± 0.70 | 1.34 ± 0.64 | 1.66 ± 1.13 | 0.006 |
| Total cholesterol, mmol/L | 4.22 ± 0.98 | 4.15 ± 1.21 | 4.02 ± 0.88 | 4.25 ± 1.16 | 0.424 |
| HDL-C, mmol/L | 1.31 ± 0.28 | 1.31 ± 0.35 | 1.24 ± 0.25 | 1.18 ± 0.28 | 0.004 |
| LDL-C, mmol/L | 2.55 ± 0.79 | 2.44 ± 0.93 | 2.43 ± 0.77 | 2.71 ± 0.87 | 0.112 |
| HCY, µmol/L | 1.24 ± 0.66 | 1.32 ± 0.70 | 1.34 ± 0.64 | 1.66 ± 1.13 | 0.006 |
| Neutrophil count,10^9/L | 3.46 ± 1.16 | 3.53 ± 1.46 | 3.42 ± 1.01 | 3.67 ± 1.11 | 0.192 |
| TLC,10^9/L | 1.87 ± 0.52 | 1.90 ± 0.63 | 2.06 ± 0.66 | 2.04 ± 0.55 | 0.117 |
| Platelet count,10^9/L | 231.91 ± 52.60 | 219.55 ± 62.63 | 227.45 ± 52.21 | 226.16 ± 53.79 | 0.691 |
| Albumin, g/L | 40.22 ± 3.17 | 40.80 ± 4.52 | 41.15 ± 4.65 | 42.01 ± 3.36 | 0.010 |
| Diabetes mellitus (%) | 0.329 | ||||
| 0 | 70 (75.27%) | 73 (77.66%) | 78 (85.71%) | 78 (80.41%) | |
| 1 | 23 (24.73%) | 21 (22.34%) | 13 (14.29%) | 19 (19.59%) | |
| Hypertension (%) | 0.073 | ||||
| 0 | 47 (50.54%) | 45 (47.87%) | 40 (43.96%) | 32 (32.99%) | |
| 1 | 46 (49.46%) | 49 (52.13%) | 51 (56.04%) | 65 (67.01%) | |
| CVD (%) | 0.301 | ||||
| 0 | 74 (79.57%) | 64 (68.09%) | 64 (70.33%) | 68 (70.10%) | |
| 1 | 19 (20.43%) | 30 (31.91%) | 27 (29.67%) | 29 (29.90%) | |
| Stroke (%) | 0.186 | ||||
| 0 | 82 (88.17%) | 74 (78.72%) | 73 (80.22%) | 74 (76.29%) | |
| 1 | 11 (11.83%) | 20 (21.28%) | 18 (19.78%) | 23 (23.71%) | |
| Antiplatelet drug use (%) | 0.048 | ||||
| 0 | 77 (82.80%) | 66 (70.21%) | 59 (64.84%) | 69 (71.13%) | |
| 1 | 16 (17.20%) | 28 (29.79%) | 32 (35.16%) | 28 (28.87%) | |
| Statins use (%) | 0.221 | ||||
| 0 | 78 (83.87%) | 67 (71.28%) | 68 (74.73%) | 74 (76.29%) | |
| 1 | 15 (16.13%) | 27 (28.72%) | 23 (25.27%) | 23 (23.71%) | |
| Smoking status (%) | <0.001 | ||||
| 0 | 84 (90.32%) | 72 (76.60%) | 61 (67.03%) | 59 (60.82%) | |
| 1 | 9 (9.68%) | 22 (23.40%) | 30 (32.97%) | 38 (39.18%) | |
| Alcohol consumption status (%) | 0.001 | ||||
| 0 | 83 (89.25%) | 77 (81.91%) | 64 (70.33%) | 66 (68.04%) | |
| 1 | 10 (10.75%) | 17 (18.09%) | 27 (29.67%) | 31 (31.96%) |
| Covariate | Statistics | Effect size | P-value |
|---|---|---|---|
| Age, y | 64.264 ± 9.974 | 0.003 (0.002, 0.004) | <0.00001 |
| Sex, male | 182 (48.533%) | Ref | |
| Sex, female | 193 (51.467%) | -0.061 (-0.085, -0.036) | <0.00001 |
| SBP, mmHg | 134.608 ± 18.193 | 0.000 (-0.000, 0.001) | 0.47153 |
| DBP, mmHg | 79.397 ± 11.917 | -0.001 (-0.002, -0.000) | 0.04462 |
| BMI, kg/m² | 24.986 ± 3.259 | 0.000 (-0.004, 0.004) | 0.97703 |
| BMI category, kg/m² | |||
| <24 | 146 (38.933%) | Ref | |
| ≥24, <28 | 162 (43.200%) | -0.021 (-0.049, 0.006) | 0.13068 |
| ≥28 | 67 (17.867%) | -0.002 (-0.038, 0.034) | 0.91437 |
| UA, mg/dL | 3.104 ± 0.781 | 0.037 (0.021, 0.052) | <0.00001 |
| UA category, mg/dL | |||
| Q1 | 93 (24.800%) | Ref | |
| Q2 | 94 (25.067%) | 0.031 (-0.004, 0.065) | 0.08288 |
| Q3 | 91 (24.267%) | 0.040 (0.005, 0.074) | 0.02623 |
| Q4 | 97 (25.867%) | 0.081 (0.047, 0.115) | <0.00001 |
| Neutrophil count,10^9/L | 3.523 ± 1.198 | 0.012 (0.002, 0.022) | 0.02213 |
| Cystatin C, mg/L | 1.099 ± 0.329 | 0.057 (0.019, 0.095) | 0.00333 |
| TLC,10^9/L | 1.967 ± 0.596 | 0.002 (-0.019, 0.023) | 0.81933 |
| Platelet count,10^9/L | 226.245 ± 55.445 | -0.000 (-0.000, 0.000) | 0.38947 |
| FPG, mmol/L | 5.380 ± 1.724 | 0.002 (-0.005, 0.010) | 0.50670 |
| Albumin, g/L | 41.056 ± 4.008 | -0.003 (-0.007, -0.000) | 0.02796 |
| Triglyceride, mmol/L | 1.393 ± 0.825 | 0.003 (-0.012, 0.018) | 0.68291 |
| HDL, mmol/L | 1.258 ± 0.297 | -0.054 (-0.096, -0.013) | 0.01079 |
| LDL, mmol/L | 2.533 ± 0.848 | -0.020 (-0.034, -0.005) | 0.00754 |
| HCY, µmol/L | 11.289 ± 4.662 | 0.006 (0.003, 0.008) | 0.00006 |
| Hypertension (%) | |||
| 0 | 164 (43.733%) | Ref | |
| 1 | 211 (56.267%) | 0.045 (0.020, 0.070) | 0.00042 |
| Diabetes mellitus (%) | |||
| 0 | 299 (79.733%) | Ref | |
| 1 | 76 (20.267%) | 0.010 (-0.021, 0.041) | 0.51582 |
| Stroke (%) | |||
| 0 | 303 (80.800%) | Ref | |
| 1 | 72 (19.200%) | 0.013 (-0.018, 0.045) | 0.40582 |
| CVD (%) | |||
| 0 | 270 (72.000%) | Ref | |
| 1 | 105 (28.000%) | 0.012 (-0.016, 0.039) | 0.40916 |
| Antiplatelet drug use (%) | |||
| 0 | 271 (72.267%) | Ref | |
| 1 | 104 (27.733%) | 0.047 (0.020, 0.075) | 0.00084 |
| Statins drug use (%) | |||
| 0 | 287 (76.533%) | Ref | |
| 1 | 88 (23.467%) | 0.036 (0.007, 0.066) | 0.01532 |
| Smoking status (%) | |||
| 0 | 276 (73.600%) | Ref | |
| 1 | 99 (26.400%) | 0.048 (0.020, 0.076) | 0.00090 |
| Alcohol consumption status (%) | |||
| 0 | 290 (77.333%) | 0 | |
| 1 | 85 (22.667%) | 0.036 (0.006, 0.066) | 0.01739 |
| Variable | Crude model | Minimally adjusted model | Fully adjusted model |
|---|---|---|---|
| UA | 0.037 (0.021, 0.052) <0.00001 | 0.031 (0.015, 0.048) 0.00017 | 0.034 (0.016, 0.051) 0.00028 |
| UA(%) category | |||
| Q1 | Ref | Ref | Ref |
| Q2 | 0.031 (-0.004, 0.065) 0.08288 | 0.019 (-0.014, 0.052) 0.25150 | 0.020 (-0.014, 0.053) 0.24777 |
| Q3 | 0.040 (0.005, 0.074) 0.02623 | 0.025 (-0.009, 0.060) 0.14450 | 0.021 (-0.015, 0.056) 0.25315 |
| Q4 | 0.081 (0.047, 0.115) <0.00001 | 0.068 (0.033, 0.103) 0.00015 | 0.069 (0.031, 0.107) 0.00040 |
| P for trend | <0.00001 | 0.00022 | 0.00098 |
| Inflection Point of UA (mg/dL) | Effect Size (β) | 95% CI | P-value |
|---|---|---|---|
| <3.15 | -0.002 | (-0.033, 0.030) | 0.9240 |
| ≥3.15 | 0.061 | (0.031, 0.090) | <0.0001 |
Peer Reviews
No public reviews on file for this paper yet. If you reviewed it on a platform where reviews are public (OpenReview, ICLR, NeurIPS, ICML), you can paste yours below so the community can read it here.
Videos
No videos yet. Explain this paper in a talk, walkthrough, or lecture? Add one.
Taxonomy
TopicsGout, Hyperuricemia, Uric Acid · Cardiovascular Disease and Adiposity · Cardiovascular Health and Disease Prevention
Introduction
1
The global expansion of the elderly population has been accompanied by a rising incidence of stroke. Despite significant advancements in stroke treatment and prevention strategies, stroke-related mortality and disability rates remain persistently high (1). Atherosclerotic plaques, a predominant precursor of ischemic stroke, predominantly occur in the internal carotid artery distal to the bifurcation of the common carotid artery in Western populations. This anatomical predilection may be associated with reduced shear stress at this arterial segment. Compromised endothelial function, characterized by increased intimal thickness and diminished nitric oxide release under low shear stress conditions, contributes to the susceptibility to cholesterol plaque formation. Since 2015, stroke has emerged as the leading cause of mortality and disability in China, posing substantial threats to public health and socioeconomic stability (2).
Atherosclerosis serves as the principal pathological foundation for cardiovascular and cerebrovascular diseases (3, 4). Carotid intima-media thickness (CIMT), a non-invasive ultrasonographic marker, provides reliable assessment of subclinical atherosclerosis and endothelial dysfunction (5, 6). Growing evidence supports CIMT as a predictive biomarker for cardiovascular events and stroke (7–9). While traditional risk factors for atherosclerosis are well-characterized, the pathophysiological contributions of certain metabolic parameters require further elucidation.
Urine is the main route for excreting serum uric acid (UA), which is the final byproduct of purine metabolism synthesized in the liver (10).The elevation of UA concentration in human plasma is influenced by factors such as diet, alcohol consumption, fructose intake, obesity, and ethnicity (11).Many studies have demonstrated that an excess of uric acid can lead to conditions such as gout, kidney stones, and inflammatory reactions (12–15).There is an increasing body of evidence supporting the promotive role of UA in atherosclerosis. However, it is noteworthy that some studies have indicated its antioxidative effects in oxidative stress (16), suggesting a protective role for blood vessels in the human body (17, 18). Contradictory data (19–21) characterizes the involvement of UA in the development of atherosclerosis. Furthermore, there is no consensus on the optimal UA level control in healthy populations to manage atherosclerosis. Hence, it is crucial to further explore the connection between UA and CIMT in people undergoing health examinations, providing a basis for future medication interventions that aim to regulate UA levels in order to prevent the onset and progression of atherosclerosis.
Materials and methods
2
Study population
2.1
Data from 560 individuals who were undergoing health check-ups at the Health Check Center of the Affiliated Hospital of Jining Medical College between January 2022 and January 2023 were analyzed in this cross-sectional study. Inclusion criteria: (1) age ≥ 18 years and (2) signed informed consent. Exclusion criteria: (1) a history of gout or the use of medications affecting uric acid metabolism, (2) significant organ failure in the heart, kidneys, lungs, liver, etc., (3) comorbidities like tumors, rheumatic diseases, or autoimmune diseases, and (4) incomplete data collection for UA and carotid ultrasound. Participants with gout (n = 23), tumors or autoimmune diseases (n = 13), incomplete carotid ultrasound data (n = 86), or missing UA data (n = 63) were excluded from the analysis. The final analysis included 375 participants. Health screenings involved a comprehensive assessment, including UA levels, carotid ultrasound, and other laboratory tests.
General information
2.2
The hospital’s health examination system provided comprehensive details about the participants, encompassing their gender, age, systolic blood pressure, diastolic blood pressure, BMI, blood creatinine, fasting blood sugar, triglycerides, total cholesterol, low-density lipoprotein cholesterol, high-density lipoprotein cholesterol, homocysteine, neutrophil count, platelet count, albumin, medical history (including diabetes, hypertension, coronary heart disease, and stroke), usage of antiplatelet and statin medications, smoking habits, and alcohol consumption. Blood pressure was measured following the American College of Cardiology (ACC) guidelines.
Laboratory measurements
2.3
After fasting for 8-12 hours, fasting blood samples were collected for laboratory analysis. An automated biochemical analyzer (Cobas) was used to measure UA levels, TC, HDL-C, LDL-C, TG, and FPG. The concentration of glycated hemoglobin (HbA1c) was determined through high-performance liquid chromatography, while the measurement of plasma glucose was conducted using the hexokinase method.
Ultrasound image analysis
2.4
Carotid ultrasound examinations were conducted using a portable LOGIQ ultrasound machine (GE, Best, USA). Trained and certified ultrasound physicians followed standard scanning and reading protocols. CIMT measurements were obtained at six different positions near the division point of the common carotid artery, 1 cm above and below the division point on both sides. To enhance reliability and eliminate measurement errors, each of these six locations was measured twice, and the values were averaged.
Statistical analysis
2.5
Statistical analyses were conducted using Empower Stats and R software version 4.2.0. Descriptive statistics were employed for general information and biochemical variables. Mean (standard deviation) was used to express continuous variables with a normal distribution, whereas the median was used for non-normally distributed continuous variables. Frequencies or percentages were used to present categorical variables. Univariate analysis models were used to examine the correlation of UA and other anthropometric and biochemical variables with CIMT. Following the adjustment for possible confounding variables, a sleek curve fitting technique was utilized to investigate the correlation between UA and CIMT. Multivariate segmented linear regression models were further employed to assess the independent correlation between UA and CIMT based on the smooth curve fit. Threshold effect analysis was used to determine the presence of inflection points. A significance level of less than 0.05 was attributed to the p-value.
Results
3
Participant characteristics
3.1
There are a total of 375 individuals involved in the study, consisting of 182 (46.75%) males and 193 (53.25%) females. Participants had an average age of 64.264 ± 9.974 years. The mean levels of UA and CIMT were 3.104 ± 0.781 mg/dL and 0.763 ± 0.123 mm, respectively. For UA, the median values ranged from 1.298 to 5.148 mg/dL, while for CIMT, it ranged from 0.5 to 1.095 mm. In order to investigate the connection between UA and CIMT, UA was divided into four groups (Q1-Q4) according to quartiles, and the initial characteristics of this group are described in Table 1.
Univariate analysis
3.2
To investigate the correlation between clinical parameters and CIMT, a single-variable linear regression analysis was conducted. Table 2 shows a noteworthy correlation between UA and CIMT, indicating a positive relationship.UA was categorized into four groups based on quartiles, revealing statistically significant associations in the Q3 and Q4 groups (p = 0.02623, p ≤ 0.00001). CIMT exhibited no significant correlation with BMI, triglycerides, and medical history (p > 0.05).
Linear regression results of UA and CIMT
3.3
In the original model, every 1 mg/dL rise in UA was associated with a 0.037 mm increase in CIMT (β=0.037; 95% CI=0.021–0.052, p<0.00001).After making minimal adjustments for age, sex, and BMI, the model still showed a noteworthy association (β=0.031; 95% CI=0.015-0.048, p=0.00017).After controlling for relevant confounding factors such as sex, age, BMI, HCY, CR, HBP, CYC, antiplatelet drug use, smoking status, alcohol consumption status, DLP, HDL, LDL, NEU, ALB, DBP, and removing factors with Variance Inflation Factors greater than 10 from the fully adjusted model, the adjusted model II still demonstrated a significant positive linear association between UA and CIMT (β=0.033; 95% CI=0.015-0.050, p=0.00032).However, a statistically significant association between UA and CIMT was observed only in Q4 when grouped by quartiles (β=0.069; 95% CI=0.031-0.106, p=0.00036).This suggests a potential non-linear relationship between UA and CIMT (Table 3).
Non-linear relationship between UA and CIMT
3.4
Figure 1 shows a non-linear relationship between UA and CIMT in the smoothed curve plot, after adjusting for the mentioned confounding factors. Table 4 revealed the recognition of a pivotal moment in the correlation between UA levels and CIMT. When UA is <3.15 mg/dL, the relationship is not statistically significant (p = 0.9240). Nevertheless, in the UA level range from 3.15 to 5.148 mg/dL, there is a notable and meaningful connection between UA and CIMT, which varies depending on the dosage (adjusted β = 0.061; 95% CI = 0.031-0.090, p < 0.0001).
Plot Of Piecewise Linear Regression. The relationship between UA and CIMT. A threshold, nonlinear association between UA and CIMT was found in a generalized additive model (GAM). Solid red line represents the smooth curve fit between variables. Dotted line represents the 95% of confidence interval from the fit. All adjusted for SEX; AGE; BMI; HCY; CR; Hypertension; Cystatin C; Antiplatelet drug use; Smoking status; DLP; HDL-C; LDL-C; Alcohol consumption status; Neutrophil count; Albumin; DBP.
post hoc power analysis
3.5
A post hoc power analysis was conducted to evaluate the achieved statistical power based on the observed effect size in the multivariate piecewise linear regression model. Power was computed using R (version 4.4.1) with parameters obtained from the primary analysis, assuming a significance level of 0.05 and a critical power threshold of 0.80. The post hoc power analysis was conducted using an effect size of 0.0634 and degrees of freedom (19, 320). The estimated power was found to be 0.80.
Discussion
4
Elevated levels of UA in the human body have been associated with multiple pathological processes. Epidemiological studies consistently identify hyperuricemia as an independent risk factor for cardiovascular events. For instance, Bos et al. demonstrated that hyperuricemia independently predicts myocardial infarction and stroke (22). Epidemiological studies consistently identify hyperuricemia as an independent risk factor for cardiovascular events. For instance, Bos et al. demonstrated that hyperuricemia independently predicts myocardial infarction and stroke (23).Research conducted on endothelial cells from the human umbilical vein discovered that elevated levels of UA trigger oxidative stress and inflammation by impacting the signaling pathway of HMGB1/RAGE, the pathway of NF-κB, the activation of the renin-angiotensin system, the reduction of NO, and the expression of inflammatory cytokines (24–26). These mechanisms collectively promote endothelial dysfunction and vascular remodeling, accelerating atherosclerosis.
In our study involving a healthy check-up population, we identified an independent correlation between UA and increased CIMT (β = 0.037; 95% CI = 0.021-0.052, p < 0.00001).The correlation remained significant even after accounting for other variables (β = 0.033; 95% CI = 0.015-0.050, p = 0.00032).The association between increased UA from Q1 to Q4 and CIMT was significant in both minimally adjusted and fully adjusted models (Table 3). Significantly, we noticed an inverse correlation between UA and CIMT, exhibiting a critical threshold at 3.15 mg/dL. Below this threshold, UA levels were not statistically associated with CIMT, while above this threshold, a significant positive correlation was observed, suggesting a hormesis phenomenon.
Subsequent analysis using smoothing functions and segmented linear regression models confirmed the threshold effect at 3.15 mg/dL. According to our research, there is a nonlinear correlation between UA and CIMT in the population undergoing regular health check-ups, with a critical value at 3.15 mg/dL. There is no significant correlation between CIMT and UA when UA is less than 3.15 mg/dL, but a significant positive correlation with CIMT is observed when UA is 3.15 mg/dL or higher. Reducing uric acid through treatment can help alleviate factors that cause arterial inflammation and the formation of neointimal lesions in a mouse model induced with carotid atherosclerosis (27).To reduce the risk of increased CIMT, it is suggested that individuals without symptoms should maintain UA levels below 3.15 mg/dL, taking into account the potential advantages of prolonged non-bisphosphonate therapy in preventing arterial stiffness caused by hyperuricemia (28).
The innovation of this study is primarily reflected in the following aspects:Revealing the nonlinear relationship between UA and CIMT: While previous studies have investigated the association between hyperuricemia and atherosclerosis, few have systematically analyzed the nonlinear relationship between uric acid (UA) and carotid intima-media thickness (CIMT). By employing generalized additive models (GAMs) and piecewise linear regression models, we successfully demonstrated this nonlinear relationship, overcoming the limitations of traditional linear models. Furthermore, a threshold effect of UA levels was identified, providing a more precise reference for clinical intervention.Highlighting the potential of UA as an early biomarker for arteriosclerosis: Through our analysis, we observed a significant association between elevated UA levels and increased CIMT, particularly when UA concentrations exceeded 3.15 mg/dL. These findings provide a theoretical foundation for the potential application of UA as a biomarker in early arteriosclerosis screening. This discovery may offer new directions for the prevention and intervention of early-stage cardiovascular and cerebrovascular diseases.
Despite these findings, our study has certain limitations. Initially, as a cross-sectional study, it solely illustrates a non-linear correlation between UA and CIMT and cannot establish causation, necessitating prospective studies for verification. Secondly, averaging the measurements of CIMT at six locations on both sides of the neck may not fully reflect the thickness at other locations if there is severe thickening beyond these measured locations. Thirdly, due to collinearity, the use of statin drugs, total cholesterol, and estimated glomerular filtration rate were not adequately adjusted and may influence the results. Additionally, our study population had a high proportion of individuals over 60 years old (67.73%), possibly influenced by factors such as social, economic, and family values, making them more willing to undergo health check-ups. In conclusion, since this study was conducted retrospectively on a population undergoing routine health check-ups, the findings may not be applicable to individuals suffering from different medical conditions.
The reference list from the paper itself. Each links out to its DOI / PubMed record.
- 1Hankey GJ. Stroke. Lancet. (2017) 389:641–54. doi: 10.1016/S 0140-6736(16)30962-X 27637676 · doi ↗ · pubmed ↗
- 2Tu WJ Wang LDR. Special Writing Group of China Stroke Surveillance. China stroke surveillance report 2021. Mil Med Res. (2023) 10:33. doi: 10.1186/s 40779-023-00463-x 37468952 PMC 10355019 · doi ↗ · pubmed ↗
- 3Bjorkegren JLM Lusis AJ. Atherosclerosis: recent developments. Cell. (2022) 185:1630–45. doi: 10.1016/j.cell.2022.04.004 PMC 911969535504280 · doi ↗ · pubmed ↗
- 4Tsao CW Aday AW Almarzooq ZI Anderson CAM Arora P Avery CL. Heart disease and stroke statistics-2023 update: A report from the American Heart Association. Circulation. (2023) 147:e 93–e 621. doi: 10.1161/CIR.0000000000001123 36695182 PMC 12135016 · doi ↗ · pubmed ↗
- 5Antonini-Canterin F Di Nora C Pellegrinet M Vriz O La Carrubba S Carerj S. Effect of uric acid serum levels on carotid arterial stiffness and intima-media thickness: A high resolution Echo-Tracking Study. Monaldi Arch Chest Dis. (2019) 89. doi: 10.4081/monaldi.2019.1007 30968661 · doi ↗ · pubmed ↗
- 6Cismaru G Serban T Tirpe A. Ultrasound methods in the evaluation of atherosclerosis: from pathophysiology to clinic. Biomedicines. (2021) 9. doi: 10.3390/biomedicines 9040418 PMC 807040633924492 · doi ↗ · pubmed ↗
- 7Kumar P Sharma R Misra S Kumar A Nath M Nair P. CIMT as a risk factor for stroke subtype: A systematic review. Eur J Clin Invest. (2020) 50:e 13348. doi: 10.1111/eci.13348 32671819 · doi ↗ · pubmed ↗
- 8Willeit P Tschiderer L Allara E Reuber K Seekircher L Gao L. Carotid intima-media thickness progression as surrogate marker for cardiovascular risk: meta-analysis of 119 clinical trials involving 100 667 patients. Circulation. (2020) 142:621–42. doi: 10.1161/CIRCULATIONAHA.120.046361 PMC 711595732546049 · doi ↗ · pubmed ↗