Comorbidities, level of education, and alcohol consumption are predictive factors of undernutrition among adult outpatients living with diabetes: a case at Hawassa governmental hospitals in Ethiopia
Asfaw Asegidew Meseret, Zelalem Tafese Wondimagegne

TL;DR
This study finds that comorbidities, low education, and alcohol use are linked to undernutrition in diabetic outpatients in Ethiopia.
Contribution
The study identifies specific predictive factors for undernutrition among diabetic patients in a low-resource setting.
Findings
Undernutrition occurred in 15.2% of diabetic outpatients.
Comorbidities were present in 57.8% of participants.
Alcohol consumption, comorbidities, and education level were significant predictors of undernutrition.
Abstract
Comorbidities, which are additional health conditions that occur alongside diabetes, can have a significant effect on blood sugar control. These conditions often complicate the management of diabetes and worsen overall health. Malnutrition, on the other hand, is a common concern for people with diabetes due to difficulties with food intake and metabolism. Proper nutrition is crucial for maintaining general health and effectively managing the disease. However, the extent of comorbidities and malnutrition within this group is not well understood in the study area. A cross-sectional study was conducted at Hawassa governmental hospitals between April and May 2023, involving 422 adult outpatients living with diabetes. The study aimed to evaluate their comorbidities, nutritional status, and associated factors. The required data were collected using structured and semi-structured…
Genes, proteins, chemicals, diseases, species, mutations and cell lines named across the full text — each resolved to its canonical identifier and authoritative record.
Click any figure to enlarge with its caption.
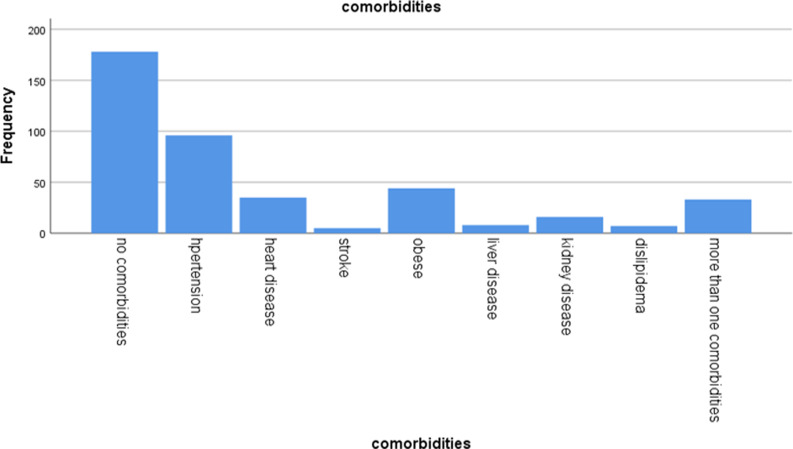 Figure 1
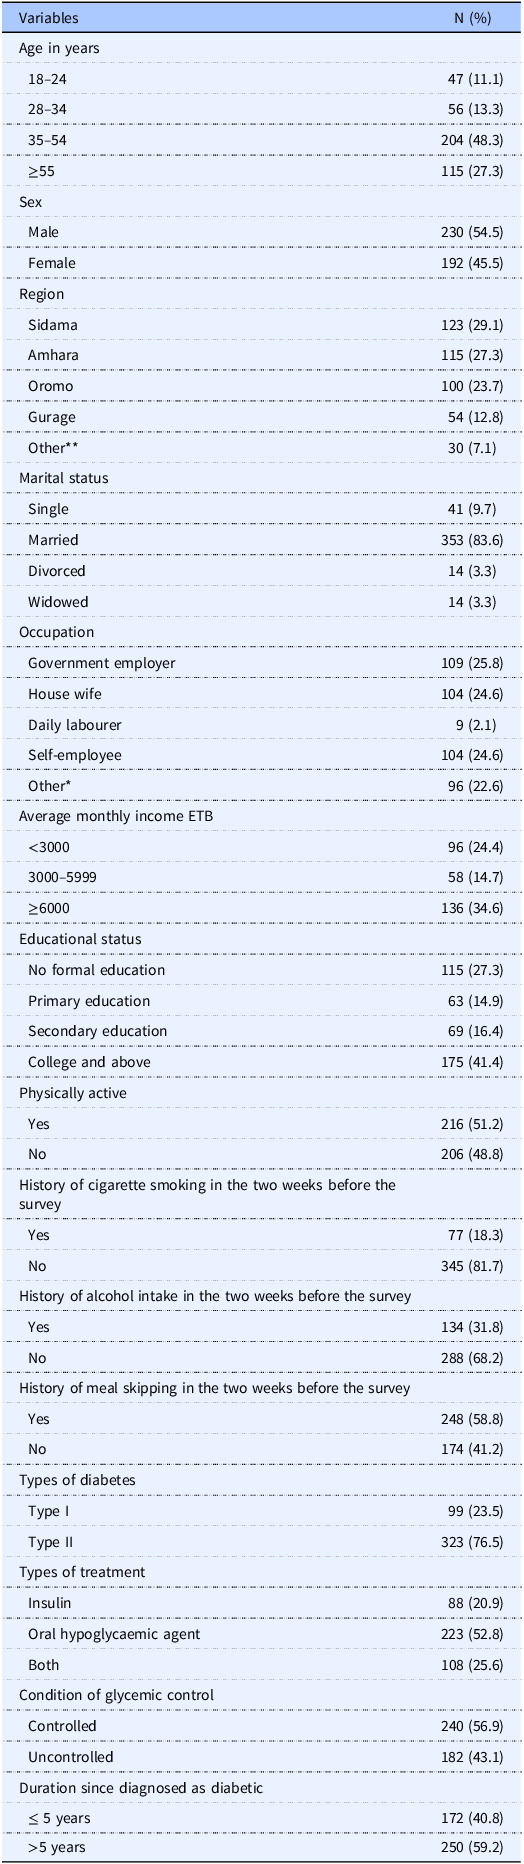 Figure 2
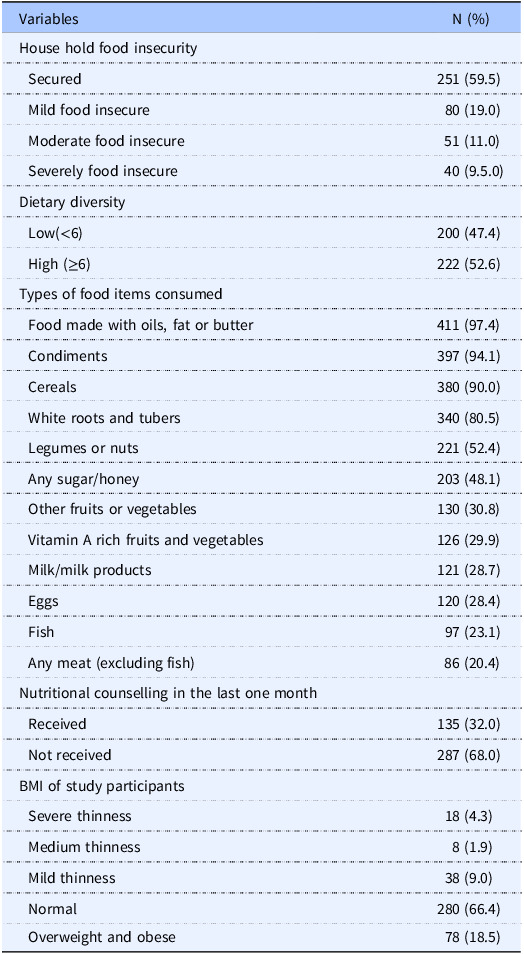 Figure 3
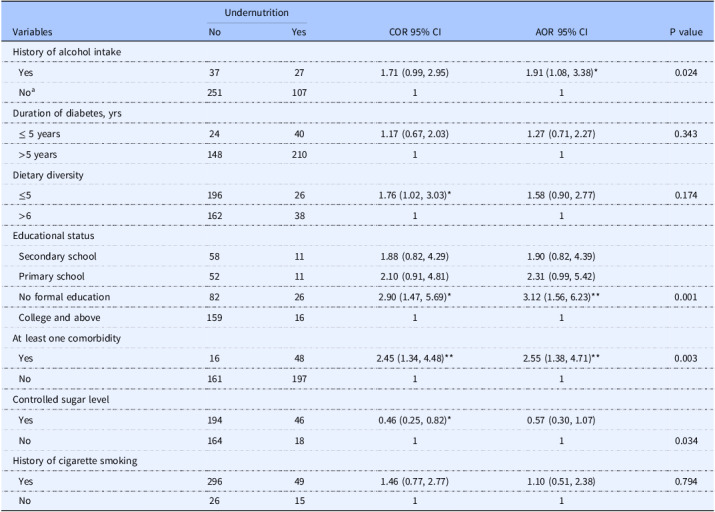 Figure 4
Peer Reviews
No public reviews on file for this paper yet. If you reviewed it on a platform where reviews are public (OpenReview, ICLR, NeurIPS, ICML), you can paste yours below so the community can read it here.
Videos
No videos yet. Explain this paper in a talk, walkthrough, or lecture? Add one.
Taxonomy
TopicsNutrition and Health in Aging · Chronic Disease Management Strategies · Obesity and Health Practices
Background
Diabetes is a common, chronic metabolic disease that is characterised by elevated blood glucose levels. Type 1 diabetes is caused by insufficient insulin, whereas type 2 diabetes is caused by insufficient insulin and insulin resistance.^(1)^ More than 90% of diabetes cases worldwide are type-2 diabetes, which primarily affects adults and is brought on by the body becoming resistant to insulin or by the pancreas producing insufficient amounts of the hormone.^(2)^ Diabetes is one of the diseases with the fastest rate of global increase.^(3)^ It is a difficult public health issue with major health repercussions and expenses linked to an unhealthy lifestyle, including cardiovascular illnesses, amputations, vision loss, and renal failure.^(4)^
The World Health Organization (WHO) stated that during the past ten years, low- and middle-income countries have seen a faster increase in the prevalence of diabetes.^(5)^ Approximately 75% of people with diabetes worldwide reside in low- and middle-income nations.^(6)^ Despite significant regional and national variations in the trend and severity of NCD risk factors, 28 million people are expected to have the disease by 2030, with T2DM (Type 2 diabetics mellitus) being most common in Africa, where the current number of people living with diabetes has reached 19 million.^(7)^ This figure aligns with ongoing trends of increasing diabetes prevalence in the region, which has been attributed to factors like urbanisation, lifestyle changes, and limited access to early diagnosis and treatment.
Similarly, due to its sizable population, Ethiopia has the highest rate of diabetes prevalence in Africa, ranging from 2.0% to 6.5%, with a low of 2% in smaller rural areas.^(8)^
Diabetes can have a negative impact on a person’s quality of life. If blood glucose levels are not controlled, hyperglycaemia is a common side effect of uncontrolled diabetes that can cause major harm to numerous bodily systems over time, particularly to the blood vessels and nerves.^(9)^ Comorbidities and undernutrition are common challenges faced by individuals with diabetes. Comorbidities, such as cardiovascular diseases, hypertension, and kidney dysfunction, often occur alongside diabetes and can complicate disease management. Concordant and discordant comorbidities are two categories of chronic conditions that are commonly present in patients with diabetes.^(11)^ A recent review synthesising evidence on the burden of diabetes noted the increasing prevalence of comorbidities, highlighting that many individuals with diabetes are also affected by complications like cardiovascular disease and kidney dysfunction.^(10)^ Concordant comorbidities are defined as two or more diseases that share similar pathophysiological traits and are more likely to be influenced by the same underlying factors, often requiring a unified approach to management. In contrast, discordant comorbidities refer to diseases with distinct and unrelated pathophysiological features.^(12)^ Thus, among patients with diabetes, concordant comorbidities such as obesity, hypertension, hyperlipidaemia, chronic vascular disease (CVD), and chronic kidney disease (CKD) are frequently reported.^(13)^ An Indian study found that 84% of diabetic patients had one or more comorbid conditions, with hypertension being the most common chronic comorbidity in this primary care population.^(14)^ A retrospective cohort study conducted to quantify the prevalence and co-prevalence of common comorbidities among type 2 diabetes found that the majority of adults with diabetes have at least one comorbidity.^(15)^ A study conducted in Nigeria, Ghana, and Kenya found that comorbidity rates among type 2 people living with diabetes in tertiary health centres are rapidly increasing, ranging from 6% to 64%, likely due to differences in healthcare access, socioeconomic factors, and lifestyle or genetic influences.^(16)^ A study conducted in eastern Ethiopia reported that 55.8% of people living with diabetes had concordant comorbid conditions.^(17)^ Undernutrition is also common among people living with diabetes, with a recent study reporting a pooled prevalence of 20.5% among people living with diabetes in Ethiopia.^(18)^ Being underweight is a recognised risk factor for diabetic complications, as confirmed by a Korean study showing that underweight people living with diabetes had more than twice the risk of cardiac complications during follow-up.^(19)^
People with diabetes are frequently advised to adopt healthy eating practices worldwide because diet control is thought to be the most important aspect of diabetes treatment.^(20)^ Undernutrition, marked by insufficient intake of essential nutrients, is common among diabetic patients and can worsen their health and glycemic control, as they often struggle to find a diet that is both nutritionally adequate and sufficient in quantity.^(21)^ Patients’ understanding of a recommended diet has an impact on their choices of foods and eating habits. For this reason, dietary evaluation is crucial for promoting health, preventing disease, and developing personalised treatment plans for diabetic patients.^(22)^ It has been demonstrated that dietary interventions for people living with diabetes improve functional outcomes while reducing mortality and complications.^(23)^ Both comorbidities and undernutrition can degrade the quality of life and heighten the risk of complications in diabetic patients, emphasising the need for early detection and comprehensive management. Previous research has shown a significant rise in diabetes-related morbidity and mortality in sub-Saharan Africa.^(24)^ Ethiopia is among the African countries with a significant diabetes burden, affecting 1.7 million adults.^(25)^ Most people living with diabetes have reported inadequate control over their blood sugar levels, indicating a need for improved management strategies and support.^(26)^ To develop appropriate plans and health programmes, there is a need to shift healthcare priorities and update current data on the prevalence and complications of diabetes in Ethiopia.^(27)^ However, there is a notable lack of data regarding the risk factors and epidemiology of diabetes comorbidities.^(17)^ The current study was designed to assess the comorbidities, nutritional status, and associated factors among individuals with diabetes. The findings aim to contribute valuable insights for developing targeted recommendations, including nutritional care interventions. By providing evidence-based data, the study holds the potential to enhance diabetes care and control complications, ultimately improving patient outcomes and public health strategies.
Methods
Study design and setting
This study has been conducted and reported in accordance with the STROBE guidelines for observational studies (Elm et al., 2014).^(28)^ A cross-sectional study was conducted from May 2022 to April 2023 across several healthcare institutions, including Adare General Hospital, Hawassa University Comprehensive Specialized Hospital, and the governmental hospitals in Hawassa City. Located 273 km north of Addis Ababa, Hawassa serves as a key site for diabetes care, with hospitals providing comprehensive treatment and regular follow-up visits at least once a month. Approximately 2,600 individuals with diabetes were being monitored at these hospitals. All patients aged 18–65 years enrolled in the outpatient diabetes management programme who agreed to participate were included in the study.
Measurements
The data collection tools used in this study included a digital scale (770 alpha), a stadiometer, a strain-resistance metre, and a structured questionnaire. The questionnaire gathered information on sociodemographic factors, behaviours, health-related issues, household food security, dietary diversity, and anthropometric measurements (weight and height). Information on comorbidities for individuals with diabetes was obtained from patient charts. Glycemic control was evaluated by averaging the last three fasting blood glucose readings, with a normal fasting blood sugar level defined as below 100 milligrams per decilitre. Sociodemographic data were collected via structured questionnaires, face-to-face interviews, and physical measurements using standardised methods and calibrated equipment.
Height was measured with participants standing barefoot and without shoes, ensuring their body was upright with their buttocks, scapula, and head in contact with the stadiometer. The reading was recorded to the nearest 0.1 cm, and the measurement was taken twice, with the average used for analysis. Participants were then weighed in light clothing and barefoot, with the weight recorded to the nearest 0.1 kg. To minimise measurement errors, the instruments were calibrated after each use. A scoring system was developed based on participant responses to assess comorbid conditions, household dietary diversity, and food insecurity. The food insecurity section included nine statements with ‘yes’ or ‘no’ responses, which were scored as follows: ‘1’ for infrequent (once or twice), ‘2’ for occasional (three to ten times), and ‘3’ for frequent (more than ten times). ‘No’ responses received a score of ‘0’. This scoring system categorised household food insecurity into four levels: food secure, mild, moderate, and severely food insecure, as outlined by the Food and Nutrition Technical Assistance guidelines.^(29)^
The Food and Agriculture Organization of the United Nations employed a standardised tool to assess dietary diversity, which involved counting the number of food groups consumed the previous day from a set list of 12. The dietary diversity score was then calculated and categorised as low (<4), moderate (4–5), or high (>5).^(30)^ Cigarette smoking was assessed based on participants’ self-reported smoking history within the two weeks prior to the survey. Study participants were classified as Type 1 or Type 2 diabetes based on data directly extracted from the patient registry.
We utilised the short version of the International Physical Activity Questionnaire (IPAQ), a widely recognised tool designed to evaluate individuals’ physical activity levels based on their activities over the past week. Through this questionnaire, we inquired about the participants’ frequency and duration of walking, moderate-intensity activities, and vigorous-intensity activities. The IPAQ classifies physical activity levels according to the intensity, frequency, and duration of activity, categorising individuals as ‘inactive’, ‘insufficiently active’, or ‘sufficiently active’. For this study, we simplified the classification by grouping ‘inactive’ and ‘insufficiently active’ as ‘not active’, while those classified as ‘sufficiently active’ were considered ‘active’.^(31)^
Sample size and sampling technique
Sample sizes for three specific objectives were calculated: prevalence of comorbidities, nutritional status and factors associated with nutritional status among adult outpatients living with diabetes using a uniform population proportion formula with a 95% confidence interval and a 5% margin of error (d). We used the assumption of comorbidity from a study in eastern Ethiopia,^(17)^ the nutritional status of Vietnamese people living with diabetes,^(32)^ and a maximum ratio of 0.5 for factors associated with the nutritional status of adult people with diabetes. The final sample size of 422 was calculated by adding a 10% non-response rate. Participants were selected through systematic random sampling from a group of 2,593 individuals with diabetes receiving treatment at two public hospitals. The sample size was proportionally divided between 109 patients from Adare General Hospital and 313 from Hawassa University General Specialist Hospital, based on the total number of adults with diabetes at each hospital. The first participant was randomly chosen using a lottery method, and then every sixth individual was selected from the sampling frame, following the sampling interval (k = 6).
Study variables
Dependent variable
The nutritional status of adult outpatients living with diabetes as measured by BMI, served as the dependent variable. It was computed using heights in metres and body weight in kilograms (kg/m^2^). Patients were considered undernourished if their BMI was less than 18.5 kg/m^2^. The WHO classifies BMI as follows: a BMI of <16.0 kg/m² is considered severe thinness, 16.0–16.99 kg/m² is moderate thinness, and 17.0–18.49 kg/m² is mild thinness.^(33)^
Independent variables
A questionnaire was administered through face-to-face interviews to collect data on sociodemographic factors such as age, sex, marital status, income, religion, and education level. The participants’ responses were then analysed to assess their associations with comorbid conditions.
The dietary diversity score (DDS) was developed by asking study participants to recall their food intake over a 24-hour period. High dietary diversity (≥ 6 food groups) included cereals, green leafy vegetables, vitamin A-rich fruits, oil, other vegetables, fish, legumes, nuts, and seeds. A medium level of dietary diversity was defined as consuming four to five food groups, such as cereals, leafy green vegetables, vitamin-rich fruits, and oil. A diet with three or fewer food groups was considered the least diverse, including only green leafy vegetables, vitamin A-rich fruits, and oil.^(30)^ The Household Food Insecurity Access Scale (HFIAS) questionnaire was employed to assess the level of food insecurity within households of study participants. The nine-item HFIAS questionnaire was scored according to the Indicator Guide.^(29)^ Health-related information, including the type of diabetes, duration since diagnosis, and glycemic control, was retrieved from the individual patient charts.
Data quality control
Data collectors underwent two-day training on the tool components, including the Kobo Toolbox, data collection methods, and procedures, prior to the actual data collection. The collected data were rigorously reviewed for completeness, accuracy, and consistency each day during the data collection period. At the end of each day, supervisors reviewed the questionnaires to ensure their completeness.
Data analysis and procedures
The collected data was coded, recoded, cleaned, and examined to identify outliers and missing values, ensuring completeness through manual checks. It was then exported from the Kobo toolbox to SPSS version 25.0. After data exploration, descriptive statistics were used to analyse variables such as the sociodemographic characteristics of the participants in relation to the dependent variable. A chi-square test was conducted to identify independent variables associated with the dependent variable. To evaluate the goodness of fit of the final model, the Hosmer and Lemeshow test and log-likelihood were applied. A binary logistic regression model was used to determine factors linked to nutritional status. Variables with a P-value ≤ 0.25 in the bi-variable logistic regression were included in the multivariable logistic regression analysis. An adjusted odds ratio (AOR) with a 95% confidence interval (CI) was used to measure the strength of the association, with a P-value ≤ 0.05 indicating statistical significance in the multivariable logistic regression. Multicollinearity was assessed, and the highest variable inflation factor recorded was 1.64, indicating no threat of multicollinearity.
Results
Socio-demographic characteristics of study participants
A 100% response rate was achieved from the 422 adult outpatients living with diabetes who participated in the study, with medical record reviews and interviews conducted. The participants had an average age of 44.46 ± 14.33 years, and 204 (48.3%) were between the ages of 35 and 54. Among the participants, 175 (41.4%) had a college degree or higher, while 115 (27.3%) had no formal education. As shown in Table 1, the majority of participants were married (353, 81.8%), and 109 (25.6%) were employed in government positions.
Table 1.Socio-demographic behavioural, and clinical characteristics of adult diabetic outpatient at Hawassa governmental hospitals, 2023 (n = 422)VariablesN (%)Age in years 18–2447 (11.1) 28–3456 (13.3) 35–54204 (48.3) ≥55115 (27.3)Sex Male230 (54.5) Female192 (45.5)Region Sidama123 (29.1) Amhara115 (27.3) Oromo100 (23.7) Gurage54 (12.8) Other30 (7.1)Marital status Single41 (9.7) Married353 (83.6) Divorced14 (3.3) Widowed14 (3.3)Occupation Government employer109 (25.8) House wife104 (24.6) Daily labourer9 (2.1) Self-employee104 (24.6) Other*96 (22.6)Average monthly income ETB <300096 (24.4) 3000–599958 (14.7) ≥6000136 (34.6)Educational status No formal education115 (27.3) Primary education63 (14.9) Secondary education69 (16.4) College and above175 (41.4)Physically active Yes216 (51.2) No206 (48.8)History of cigarette smoking in the two weeks before the survey Yes77 (18.3) No345 (81.7)History of alcohol intake in the two weeks before the survey Yes134 (31.8) No288 (68.2)History of meal skipping in the two weeks before the survey Yes248 (58.8) No174 (41.2)Types of diabetes Type I99 (23.5) Type II323 (76.5)Types of treatment Insulin88 (20.9) Oral hypoglycaemic agent223 (52.8) Both108 (25.6)Condition of glycemic control Controlled240 (56.9) Uncontrolled182 (43.1)Duration since diagnosed as diabetic ≤ 5 years172 (40.8) >5 years250 (59.2)1 USD = 59 ETB, Other = wolaita, Hadiya, Other* = house wife, student.
Behavioural characteristics, and clinical conditions of the study population
Among the respondents, 77 (18.2%) reported being smokers, and 134 (31.8%) consumed alcohol. The average duration since their diabetes diagnosis was 6.54 years. The majority of participants, 323 (76.5%), were diagnosed with Type 2 diabetes, 223 (52.8%) were currently using oral hypoglycaemic agents, and 216 (51.2%) were physically active. Furthermore, 228 (54.0%) of the participants had poor glycemic control (Table 1).
Prevalence of comorbidity
The overall prevalence of concordant comorbidities among adult outpatients living with diabetes was 245 (58%). Among these, hypertension was reported by 96 (22.7%) participants, obesity by 44 (10.4%), heart disease by 35 (8.3%), dyslipidemia by 7 (1.7%), chronic kidney disease by 16 (3.8%), and stroke by 5 (1.2%). Additionally, 32 (7.6%) patients had more than one comorbidity (Fig. 1).
Fig. 1.Comorbid disease distribution among adult outpatients living with diabetes at Hawassa government hospitals, 2023 (n = 422).
Dietary and nutritional status of respondents
According to the HFIAS, 171 (40.5%) of the adult outpatients living with diabetes were from food-insecure households. Analysis of the food groups consumed by the participants on the day prior to the survey revealed a mean (± SD) dietary diversity score of 6.2 (±1.4). Over three-fourths of the participants had consumed foods made with oils, fats, or butter (97.4%), cereals (90%), and white roots and tubers (80.5%). However, the intake of nutrient-dense foods, such as animal-source foods and fruits and vegetables, was relatively low. Overall, 200 (47.4%) participants had low dietary diversity. The prevalence of undernutrition among adult outpatients living with diabetes was 15.2% (BMI < 18.5 kg/m²) (Table 2). Specifically, 38 (9%) were mildly underweight (BMI 17.0–18.49 kg/m²), 8 (1.9%) were moderately underweight (BMI 16.0–16.99 kg/m²), and 18 (4.27%) were severely underweight (BMI < 16.0 kg/m²). Additionally, 78 (18.5%) individuals were overweight or obese (BMI > 25 kg/m²), while 280 (66.4%) were of normal weight (BMI 18.5–24.9 kg/m²).
Table 2.Dietary and Nutritional characteristics counselling among adult diabetic outpatient at Hawassa governmental hospitals, 2023 (n = 422)VariablesN (%)House hold food insecurity Secured251 (59.5) Mild food insecure80 (19.0) Moderate food insecure51 (11.0) Severely food insecure40 (9.5.0)Dietary diversity Low(<6)200 (47.4) High (≥6)222 (52.6)Types of food items consumed Food made with oils, fat or butter411 (97.4) Condiments397 (94.1) Cereals380 (90.0) White roots and tubers340 (80.5) Legumes or nuts221 (52.4) Any sugar/honey203 (48.1) Other fruits or vegetables130 (30.8) Vitamin A rich fruits and vegetables126 (29.9) Milk/milk products121 (28.7) Eggs120 (28.4) Fish97 (23.1) Any meat (excluding fish)86 (20.4)Nutritional counselling in the last one month Received135 (32.0) Not received287 (68.0)BMI of study participants Severe thinness18 (4.3) Medium thinness8 (1.9) Mild thinness38 (9.0) Normal280 (66.4) Overweight and obese78 (18.5)
Predictors of undernutrition
The multivariable analysis’s candidacy criteria were met by the history of alcohol consumption, duration of time after being diagnosed as diabetic, dietary diversity, educational status, presence of comorbidities, glycemic control, and cigarette smoking (P < 0.25), according to the binary logistic regression analysis. However, the final model found that the presence of comorbidities, educational attainment, and alcohol consumption history were significantly linked to undernutrition. Study participants who reported alcohol consumption were nearly twice as likely to be undernourished (AOR = 1.91, 95% CI: 1.08–3.38, P < 0.05) compared to those with no history of alcohol use. When comparing respondents with no formal education to those with higher education, the odds of developing undernutrition were more than three times higher (AOR = 3.12, 95% CI: (1.56–6.23), at P < 0.01). Adult outpatients living with diabetes who had at least one comorbidity were more than twice as likely to be undernourished as those who did not (AOR = 2.55, 95% CI: (1.38–4.71), at P < 0.01) (Table 3).
Table 3.Summary of logistic regression analysis for factors associated with under nutrition among adult diabetic outpatient at Hawassa governmental hospitals, 2023 (n = 422)VariablesUndernutritionCOR 95% CIAOR 95% CIP valueNoYesHistory of alcohol intake Yes37271.71 (0.99, 2.95)1.91 (1.08, 3.38)*0.024 No^a^ 25110711Duration of diabetes, yrs ≤ 5 years24401.17 (0.67, 2.03)1.27 (0.71, 2.27)0.343 >5 years14821011Dietary diversity ≤5196261.76 (1.02, 3.03)*1.58 (0.90, 2.77)0.174 >61623811Educational status Secondary school58111.88 (0.82, 4.29)1.90 (0.82, 4.39) Primary school52112.10 (0.91, 4.81)2.31 (0.99, 5.42) No formal education82262.90 (1.47, 5.69)*3.12 (1.56, 6.23)**0.001 College and above1591611At least one comorbidity Yes16482.45 (1.34, 4.48)**2.55 (1.38, 4.71)**0.003 No16119711Controlled sugar level Yes194460.46 (0.25, 0.82)0.57 (0.30, 1.07) No16418110.034History of cigarette smoking Yes296491.46 (0.77, 2.77)1.10 (0.51, 2.38)0.794 No261511Abbreviations: AOR, adjusted odd ratio; COR, crude odd ratio; BMI, body mass index. Statistically significant P <.05; ** Statistically significant P <.001.^a^ Reference catagory.
Discussion
This study aims to assess the prevalence of undernutrition and comorbidities among adult outpatients living with diabetes, as well as the factors influencing them. Our findings confirmed a high prevalence of undernutrition and associated comorbidities among adult outpatients living with diabetes in the study area. Specifically, the results showed that 245 (58%) of outpatients living with diabetes had concordant comorbidities. While this result is significantly greater than the comorbidity found in previous research from Ethiopia and Bangladesh,^(34,35)^ it is consistent with the findings of an earlier Ethiopian investigation.^(17)^ Conversely, our result was substantially lower than those of previous studies conducted in other parts of the world, including Switzerland (91%),^(36)^ Spain (82%),^(37)^ and India (84%).^(38)^ The observed variation in comorbidity prevalence among studies may be attributed to changes in the sociodemographic characteristics of the study populations as well as variations in the types of diabetes that were included in the investigations.
The study found that 15.2% of adult outpatients living with diabetes were undernourished, a figure lower than the 43.1% prevalence reported in another study conducted in Ethiopia.^(39)^ This difference could be explained by variations in sociodemographic factors, lifestyle, economic status among the study populations, and the possibility of underdiagnoses. The current study found that adult diabetic patients with a history of alcohol consumption were almost twice as likely to experience undernutrition. This finding aligns with a previous study in Uganda, which reported a 23.45% prevalence of alcohol consumption among individuals with diabetes, highlighting the need for interventions to address the impact of alcohol use in this population.^(40)^ Although alcohol consumption negatively affects the nutritional status and treatment outcomes of diabetic patients, alcohol consumption by diabetics can worsen blood sugar control in those patients. Additionally, long-term alcohol ingestion by adult outpatients living with diabetes who are not adequately nourished can lead to dangerously low blood sugar levels.^(41)^ This can affect nutritional status and increase the risk of diabetes-related medical complications.
Educational attainment is a key factor influencing the nutritional status of adults, as individuals with higher levels of education are more likely to make informed dietary choices, engage in health-promoting behaviours, and access healthier food options.
Consistent with findings from similar studies, educational attainment is a key factor influencing the nutritional status of adults.^(42–44)^ Our findings indicate that individuals with diabetes who have no formal education are more than three times as likely to suffer from undernutrition compared to those with a college degree or higher. Educational attainment is a key determinant of adults’ nutritional status. People with higher education levels are generally more knowledgeable about the benefits of a balanced diet and are better equipped to make a healthy food choice, which contributes to improved nutrition. On the other hand, those with limited education often lack awareness about essential nutrients and may develop poor dietary habits, heightening the risk of malnutrition. On the other hand educational attainment is often linked to income,^(45)^ which plays a crucial role in determining access to healthy foods. By enhancing educational opportunities, nutritional outcomes can be improved, as individuals with higher education are typically more knowledgeable about maintaining good self-care and nutrition. However, in this study, the connection between undernutrition and lower economic status was not examined, as no statistical link was found between average monthly income and undernutrition. Nevertheless, education alone does not ensure improved practices, as social and environmental factors also significantly influence behaviour. Therefore, interventions must go beyond education to address these wider determinants.^(46,47)^
Diabetes patients with at least one comorbid condition showed more than two times more likely to be undernourished. The occurrence of comorbid conditions in patients with diabetes significantly increases the risk of undernutrition. Conditions such as hypertension, cardiovascular disease, and kidney dysfunction can impair nutritional intake, disrupt nutrient absorption, and alter metabolic processes, all of which contribute to a higher likelihood of malnutrition in these patients.^(48,49)^ This association might be explained by a diabetes patient with comorbidity having difficulty controlling blood sugar. If blood sugars are high, it can make the patient urinate frequently, and this results in dehydration as a possible cause of weight loss. Muscle breakdown can also occur if blood sugars are too high and cells can’t utilise enough insulin to convert glucose into energy. Due to this, the body starts consuming muscle and body fat, resulting in unhealthy weight loss. Additionally, some comorbidity may also cause loss of appetite, diarrhoea, constipation, and vomiting, which results in an abnormal loss of weight among patients.
Likewise, the relationship between uncontrolled blood sugar levels and undernutrition can be explained by impaired glucose regulation, which affects nutrient absorption and energy balance, resulting in unhealthy weight loss. This, in turn, can worsen nutritional deficiencies, increase health complications, and create a cycle of metabolic and nutritional imbalances that further compromise overall well-being of the patient.
Strengths of the study
This study is one of the few to investigate nutritional status and comorbid conditions, areas that have been underexplored in previous research conducted in Ethiopia and similar settings.
Limitations of the study
The cross-sectional design and small sample size of this study limit its generalizability. Moreover, nutrition was assessed solely using BMI, without considering other influencing factors or the impact of anti-diabetic medications. Recall bias may have influenced the responses regarding food intake. The study also did not account for nutritional expertise or genetic predispositions to under- or over-nutrition. Additionally, the lack of hypertension measurement contributed to the low prevalence reported, representing another limitation.
Conclusion
This study evaluates the prevalence of undernutrition and its predictors among adult outpatients living with diabetes. Our findings indicate a high prevalence of concordant comorbidities among this population. Specifically, undernutrition was significantly predicted by the presence of comorbidities, alcohol consumption, educational level, and uncontrolled blood sugar levels. Preventing comorbidities in adult outpatients living with diabetes is a vital aspect of comprehensive diabetes care, requiring regular screening, early detection, and prompt management. Tailored nutrition counselling promoting sustainable lifestyle changes, such as adopting healthier eating habits, is strongly recommended. Equally important is strengthening healthcare professionals’ ability to identify and manage diabetes-related comorbidities effectively. Furthermore, the study’s results are applicable to similar populations and settings, with due consideration given to sample representativeness and the study’s limitations.
The reference list from the paper itself. Each links out to its DOI / PubMed record.
- 1American Diabetes Association. Diagnosis and classification of diabetes mellitus. Diabetes Care 2010;33:S 62–S 69.20042775 10.2337/dc 10-S 062PMC 2797383 · doi ↗ · pubmed ↗
- 2Kotwas A , Karakiewicz B , Zabielska P , et al. Epidemiological factors for type 2 diabetes mellitus: evidence from the Global Burden of Disease. Arch Public Health 2021;79:110.34158120 10.1186/s 13690-021-00632-1PMC 8218426 · doi ↗ · pubmed ↗
- 3Ong KL , Stafford LK , Mc Laughlin SA , et al. Global, regional, and national burden of diabetes from 1990 to 2021, with projections of prevalence to 2050: a systematic analysis for the Global Burden of Disease Study. Lancet 2023;402:203–234.37356446 10.1016/S 0140-6736(23)01301-6PMC 10364581 · doi ↗ · pubmed ↗
- 4Grimaccia F , Kanavos P. Cost, outcomes, treatment pathways and challenges for diabetes care in Italy. Global Health 2014;10:58.25024101 10.1186/1744-8603-10-58PMC 4110929 · doi ↗ · pubmed ↗
- 5Liu J , Bai R , Chai Z , et al. Low- and middle-income countries demonstrate rapid growth of type 2 diabetes: an analysis based on Global Burden of Disease 1990–2019 data. Diabetologia 2022;65:1339–1352.35587275 10.1007/s 00125-022-05713-6PMC 9118183 · doi ↗ · pubmed ↗
- 6Cho NH , Shaw JE , Karuranga S , et al. IDF diabetes atlas: global estimates of diabetes prevalence for 2017 and projections for 2045. Diabetes Res Clin Pract 2018;138:271–281.29496507 10.1016/j.diabres.2018.02.023 · doi ↗ · pubmed ↗
- 7Malek R. Prevalence of type 2 diabetes mellitus in Africa: an updated narrative review. Nor Afr J Food Nutr Res 2020;4:S 87–92.
- 8Kinfe GB , Carolyn J , Henock G , et al. Diabetes in Ethiopia: a systematic review of prevalence, risk factors, complications, and cost. Obes Med 2019;15:100132.