Development of a new high-yield integration site assay reveals disease-specific patterns across HTLV-1-associated pathologies
Vincent Guiraud, Jérôme Alexandre Denis, Sofia Ben Attia, Erwan Ablin, Ronan Legrand, Véronique Morel, Claire Lacan, Sylvain Choquet, Rabab Debs, Margaux Cheval, Cindy Marques, Alexandre Le Joncour, Jean-Christophe Corvol, Olivier Benveniste, Valérie Pourcher

TL;DR
A new, simple assay for detecting HTLV-1 integration sites was developed and used to reveal distinct clonal patterns in different HTLV-1-related diseases.
Contribution
A high-yield, PCR-based integration site assay for HTLV-1 that is easy to implement and unbiased.
Findings
The assay achieved a 20% yield with an average sequence length of 336 bp downstream of integration sites.
Distinct clonal patterns were observed across HTLV-1-associated pathologies, such as ATLL, polymyositis, and HAM.
The assay results aligned with TCRγ clonality assessments, confirming minimal bias in integration site retrieval.
Abstract
Human T lymphotropic virus type 1 (HTLV-1) chronic infection is maintained through mitotic proliferation of the infected CD4+ T cells, where the viral genome is integrated as a provirus in its host genome. HTLV-1 integration sites (ISs) have a part in HTLV-1-associated pathologies, with distinct IS patterns associated with malignant proliferation or inflammatory diseases. However, IS determination remains challenging because most assays rely on complex biological and biocomputing protocols. We present an IS assay that solely relies on PCR and Sanger sequencing, which allowed HTLV-1 IS determination in four patients with various HTLV-1-associated pathologies. We adapted an IS assay derived from a panhandle PCR, with several modifications to increase yield. Absence of bias regarding IS retrieval was confirmed using TCRγ clonality. IS analysis was performed in four HTLV-1-positive…
Genes, proteins, chemicals, diseases, species, mutations and cell lines named across the full text — each resolved to its canonical identifier and authoritative record.
Click any figure to enlarge with its caption.
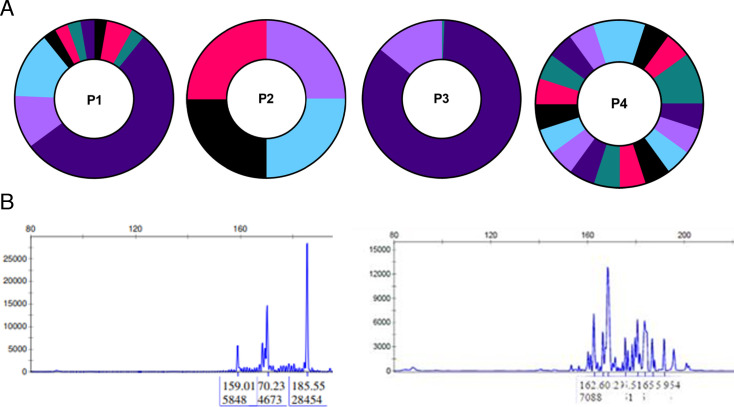 Fig 1
Fig 1| P1 | P2 | P3 | P4 | |
|---|---|---|---|---|
| Age (years) | 31 | 36 | 49 | 73 |
| Sex at birth | Male | Female | Male | Male |
| HTLV pathology | Polymyositis | HTLV-associated myelopathy | Adult T cell leukemia - lymphoma | Polymyositis |
| Country of birth | Congo | Ivory Coast | Senegal | Haiti |
| HTLV-1 viral load, log [cp/106 cells] | 3.7 (blood) | 4.7 (CSF) | 4.9 (blood) | 4.4 (blood) |
| Treatment | IVIG, prednisone, methotrexate | methylprednisolone | Prednisone, idelalisib | None |
| Clinical response | Partial response | Lost to follow-up | Death | Not available |
- —Agence Nationale de Recherches sur le Sida et les Hépatites Viraleshttp://dx.doi.org/10.13039/501100003323
- —Groupe Pasteur Mutualitéhttp://dx.doi.org/10.13039/100014846
Peer Reviews
No public reviews on file for this paper yet. If you reviewed it on a platform where reviews are public (OpenReview, ICLR, NeurIPS, ICML), you can paste yours below so the community can read it here.
Videos
No videos yet. Explain this paper in a talk, walkthrough, or lecture? Add one.
Taxonomy
TopicsT-cell and Retrovirus Studies · Animal Disease Management and Epidemiology · Vector-Borne Animal Diseases
INTRODUCTION
Human T lymphotropic virus type 1 (HTLV-1), the first human retrovirus discovered, affects 10 million people worldwide (1, 2). Around 5% of HTLV-1 carriers develop either an aggressive hematologic malignancy known as adult T-cell leukemia/lymphoma (ATLL) or an inflammatory condition, such as HTLV-1-associated myelopathy (HAM) or polymyositis (3, 4).
HTLV-1 chronic infection is sustained through mitotic proliferation of infected CD4+ T cells, where the viral genome persists as a provirus integrated in its host genome. The viral integration site (IS) within the host genome appears significant; several studies have identified differing IS patterns in asymptomatic carriers versus patients with ATLL or HAM (3, 5–8). However, determining HTLV-1 integration sites is technically challenging (9).
We present a high-yield HTLV-1 integration site (IS) assay using PCR and Sanger sequencing alone.
MATERIALS AND METHODS
Patients
All patients with an HTLV-1 diagnosis performed in Pitié-Salpêtrière Hospital and available samples collected for routine standard clinical management were included.
HTLV quantification
Genomic (including HTLV-proviral) DNA was extracted from whole blood or cerebrospinal fluid (using a QiaSymphony (Qiagen) platform. Quantification was performed with previously published primers (10), using the Qx200 digital droplet platform (Bio-Rad). Results were normalized with the quantification of the albumin gene (11).
Integration primer design:
HTLV-1 sequences were retrieved from GenBank with keywords “HTLV-1 LTR” and “complete genome HTLV-1” (12). Sequences were aligned using MAFFT (13) and visualized with UGENE (14). Primers were designed to have a melting temperature (Tm) of 60°C, secondary structures were screened with OligoCalc (15), and primer specificity was assessed using Primer-BLAST (16).
Integration site assay
We used a modified panhandle PCR to capture HTLV-1 3′ integration sites with several modifications to increase yield (12, 13). First, genomic DNA was diluted into 96-well plates with two proviruses per well. Then, unidirectional linear extension was performed using 300 nM HTLV-1 primer (ACAGCCTGGCAAAACGGCCTCCTTCC), 1× GXL Buffer, 200 mM dNTP, and 5% DMSO in 30 µL. Cycling was 30 cycles (98°C 10 s, 60°C 15 s, and 68°C 3 min), followed by a progressive cooling down to 25°C (0.2 °C/s ramp) to promote genomic DNA renaturation. This last step is critical as it allows genomic DNA to hybridize (14), with added DMSO to accelerate the process (15). Then, a mixture of 5 IU Taq DNA polymerase (New England Biolabs, #M0273E), 1.5× Taq Buffer, 8 µM decaHTLV1.U5 (ACGGCCAAGTRCCGGCGACTNNNNNNNNNN) and 200 mM dNTP in 10 µL was added to each well. The reaction was incubated at 68°C for 2 min, 65°C for 1 min, cooled by 1°C per minute until 25°C, heated to 60°C, and ramped down by 1°C per minute until 20°C. This primer was in large excess to hybridize with the newly synthesized single-strand DNA, and Taq was added to polymerize the reverse complementary strand. Then, 10 IU of Exonuclease 1 (New England Biolabs, #M0293L) was added to the 40 µL reaction mix, with the following cycling: 45 min 37°C, heated by 1°C every 3 min until reaching 43°C, heated at 68°C for 15 min, 80°C for 15 min before cooling at 8°C. This step was performed to increase yield by removing previous primers and trimming ends to allow a unique sticky end that is complementary to the HTLV-I LTR. Then, loop formation was performed using 20 µL of the previous round with a fresh mix composed of 3.75 IU Taq, 1X Taq buffer, 5% DMSO, 200 mM dNTP, and 1 µM HTLV.RF2 (CACCCCTTTCCCTTTCATTCACGAC) in 30 µL. Cycling: 1 min at 95°C, 10 cycles (94°C for 20 s, 60°C for 30 s, 68°C for 2 min), 40 cycles (92°C for 10 s, 65°C for 15 s, and 68°C for 2 min), 68°C for 5 min. Using a fresh mix is critical as a long contact between DMSO and Taq inhibits the enzyme (16). The first 10 rounds were performed to favor intra-strand hybridization and complete the panhandle, while the following allows first amplifications. Finally, two nested PCRs were performed, using first HTLV.RF1 (CGACTRACTGCCGGCT) then HTLV1.U5 (ACGGCCAAGTRCCGGCGACT). PCR mixtures were identical: 2 µL of previous round with 3.75 IU Taq, 200 mM dNTP, 0.6 µM Primer in 50 µL. Cycling was identical for both rounds: 95°C for 1 min, 35 cycles (94°C for 20 s, 65°C for 30 s, and 68°C for 2 min), 68°C for 5 min. Amplicons were visualized on a 1% agarose gel, with positive wells exhibiting a 1–5 kb amplicon (Fig. S1). Amplicons were purified and Sanger-sequenced using the (Fig. S1) HTLV.2.U5 primer (CCGTTGGCTCGGAGCCAG), and resulting sequences were analyzed using the “Integration Site” web tool as previously described (17). Consensus viral sequence adjacent to integration site is “AGTACACA.”
TCR gamma
TCR gamma rearrangement determination was performed using established methods (18).
Statistics analyses
Figures and statistical analyses were performed using R or GraphPad Prism. Yield was calculated by dividing the total number of integration sites retrieved (after Sanger sequencing) by the total number of integration sites used as input.
RESULTS
The integration site assay (IS) was performed in four HTLV-1-seropositive patients: two with polymyositis, one with ATLL, and one with HAM (Table 1). Blood samples were used for all patients except for P2 (HAM), for whom cerebrospinal fluid was analyzed. End-point dilutions, performed using ddPCR, were of two proviruses per well, except for P2 (1.2 provirus/well) because of the extremely limited number of proviruses available (Table S2). Considering all proviruses as an input, overall yield was around 20%: 18% (37 positive well/87 total wells) for P1, 50% (4/8) for P2, 40% (156/192) for P3, and 5% (20/191) for P4. The mean sequence length downstream of the IS was 336 ± 230 bp (range, 44–1,024 bp). One sequence from P1 (sequence length 456) matched multiple intergenic regions in the Y chromosome and was excluded for further analysis.
Despite a limited number of distinct IS due to clonal expansions, IS was predominant in genes, around 75% of all ISs identified, except for P3 (100% intergenic, n = 3 distinct IS). Integration site patterns suggested differences in clonal expansion by disease type, with oligoclonal or polyclonal profiles in polymyositis cases, while the ATLL case exhibited oligoclonal or monoclonal patterns (Fig. 1). Clonality was consistent with TCRγ clonality for P1 and P4, though insufficient sample quantity precluded TCRγ analysis for P2 and P3.
Clonality of HTLV-I-infected cells in patients with diverse HTLV-I-associated pathology. P1 and P4: polymyositis, P2: HAM (on four sequences only due to the very limited available sample), P3: ATLL. (A) Clonality using the integration site analysis, (B) P1 clonality using TCRgamma (C) P4 clonality using TCR gamma.
DISCUSSION
We present an HTLV-1 integration site assay that relies solely on PCR and Sanger sequencing, making it feasible without advanced bioinformatic resources. This assay provided similar results regarding HTLV-1 clonality compared with a TCRγ assay.
Apart from its relatively high yield compared to the 1%–10% of the LM-PCR (9), the primary advantage of this method is its usability without the need for bioinformatic skills. LM-PCR or LAM-PCR assays need complex bioinformatics filtering because of PCR misprimings and chimeric PCR artifacts between LTR and repeated human sequences, an issue that has already led to erroneous conclusions, as experienced by the 2015 Cell study by Cohn et al. (9, 19). The use of multiple overlapping primers and independent Sanger sequencing mitigates such issues in our approach. The web tool used in analysis provides an additional safeguard, confirming the immediate proximity of viral and human sequences.
Overall, we present an integration site assay for HTLV-1 that allows an unbiased IS analysis regarding clonal populations in various HTLV-1-associated pathologies.
Supplementary Material
Reviewer comments
The reference list from the paper itself. Each links out to its DOI / PubMed record.
- 1Gessain A, Cassar O. 2012. Epidemiological aspects and world distribution of HTLV-1 infection. Front Microbiol 3:388. doi:10.3389/fmicb.2012.0038823162541 PMC 3498738 · doi ↗ · pubmed ↗
- 2Gessain A, Ramassamy JL, Afonso PV, Cassar O. 2023. Geographic distribution, clinical epidemiology and genetic diversity of the human oncogenic retrovirus HTLV-1 in Africa, the world’s largest endemic area. Front Immunol 14:1043600. doi:10.3389/fimmu.2023.104360036817417 PMC 9935834 · doi ↗ · pubmed ↗
- 3Cook LB, Melamed A, Niederer H, Valganon M, Laydon D, Foroni L, Taylor GP, Matsuoka M, Bangham CRM. 2014 a. The role of HTLV-1 clonality, proviral structure, and genomic integration site in adult T-cell leukemia/lymphoma. Blood 123:3925–3931. doi:10.1182/blood-2014-02-55360224735963 PMC 4064332 · doi ↗ · pubmed ↗
- 4Martin F, Taylor GP, Jacobson S. 2014. Inflammatory manifestations of HTLV-1 and their therapeutic options. Expert Rev Clin Immunol 10:1531–1546. doi:10.1586/1744666 X.2014.96669025340428 · doi ↗ · pubmed ↗
- 5Niederer HA, Laydon DJ, Melamed A, Elemans M, Asquith B, Matsuoka M, Bangham CR. 2014. HTLV-1 proviral integration sites differ between asymptomatic carriers and patients with HAM/TSP. Virol J 11:172. doi:10.1186/1743-422X-11-17225270762 PMC 4192323 · doi ↗ · pubmed ↗
- 6Melamed A, Laydon DJ, Gillet NA, Tanaka Y, Taylor GP, Bangham CRM. 2013. Genome-wide determinants of proviral targeting clonal abundance and expression in natural HTLV-1 infection. P Lo S Pathog 9:e 1003271. doi:10.1371/journal.ppat.100327123555266 PMC 3605240 · doi ↗ · pubmed ↗
- 7Gillet NA, Malani N, Melamed A, Gormley N, Carter R, Bentley D, Berry C, Bushman FD, Taylor GP, Bangham CRM. 2011. The host genomic environment of the provirus determines the abundance of HTLV-1-infected T-cell clones. Blood 117:3113–3122. doi:10.1182/blood-2010-10-31292621228324 PMC 3062313 · doi ↗ · pubmed ↗
- 8Meekings KN, Leipzig J, Bushman FD, Taylor GP, Bangham CRM. 2008. HTLV-1 integration into transcriptionally active genomic regions is associated with proviral expression and with HAM/TSP. P Lo S Pathog 4:e 1000027. doi:10.1371/journal.ppat.100002718369476 PMC 2265437 · doi ↗ · pubmed ↗