Investigation of influential environmental and climatic determinants on COVID-19 spread in India to formulate a sustainable pandemic response
Jaraline Kirubavathy K., Thulasi Bai V.

TL;DR
This study explores how environmental and climate factors influence the spread of COVID-19 in India, aiming to develop a sustainable pandemic response strategy.
Contribution
The novel CS-AE algorithm identifies key environmental determinants influencing infectious disease spread using time-series data.
Findings
Shortwave Downward Radiation (SDR) strongly correlates with COVID-19 spread (r = 0.9525).
Granger causality analysis confirms a temporal causal relationship between SDR and disease spread.
SDR influences surface and air temperature and other environmental determinants.
Abstract
The COVID-19 pandemic has highlighted the need for a Sustainable Pandemic Response Strategy (SPRS), driven by scientific research and engineering principles. This study focuses on Environmental and Climatic Determinants (ECDs) that may influence the occurrence pattern of infectious diseases. The objective of SPRS is to develop a climate-resilient framework for infectious diseases using Earth Observation (EO) data. ECDs were derived from EO data during the COVID-19 study period in India, spanning 1094 days (January 3, 2020, to December 31, 2022). A Convergent Search – Add or Eliminate (CS-AE) algorithm was developed for the investigation of complex association between ECDs and disease occurrence patterns. This algorithm identifies the most influential ECDs in the spread of COVID-19 in India, categorizing them as Determinants of Concern (DOC) or Determinants of Interest (DOI). Shortwave…
Genes, proteins, chemicals, diseases, species, mutations and cell lines named across the full text — each resolved to its canonical identifier and authoritative record.
Click any figure to enlarge with its caption.
 Figure 1
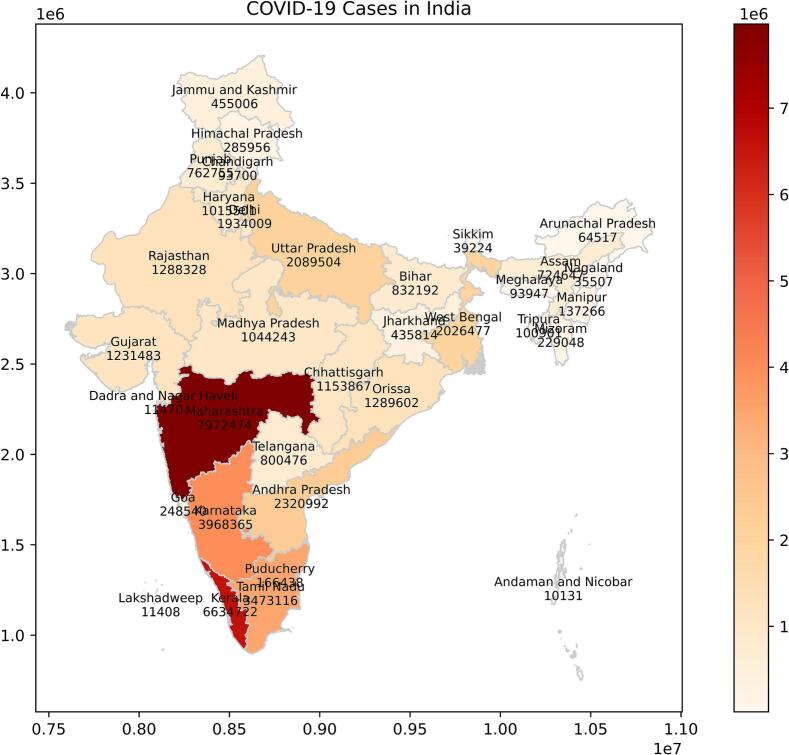 Figure 2
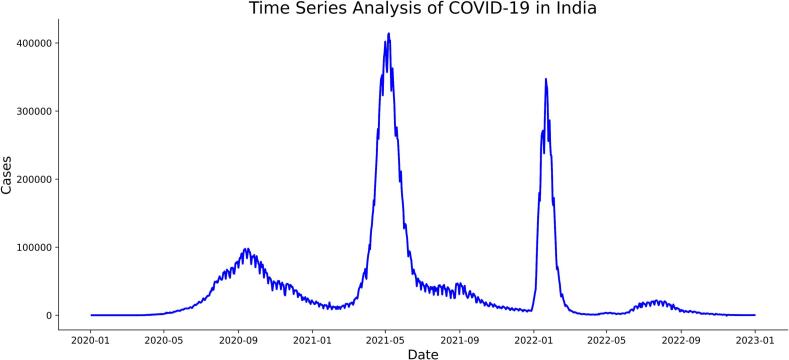 Figure 3
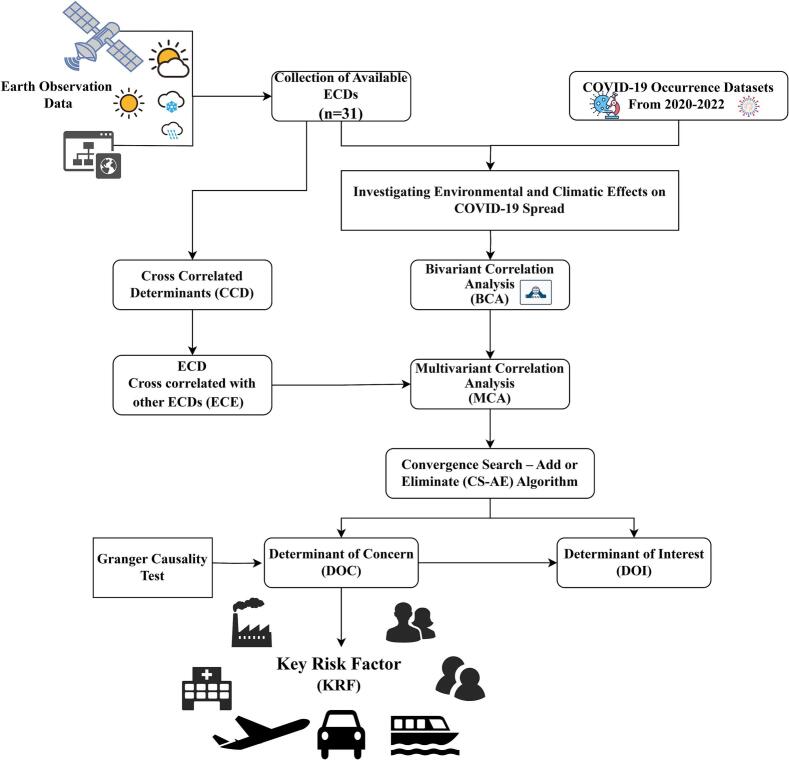 Figure 4
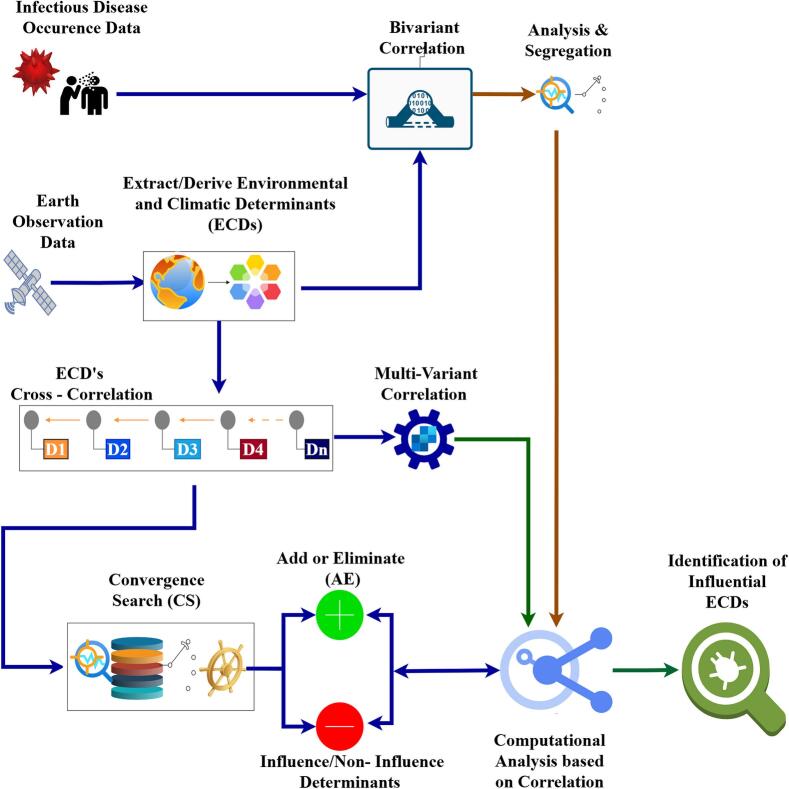 Figure 5
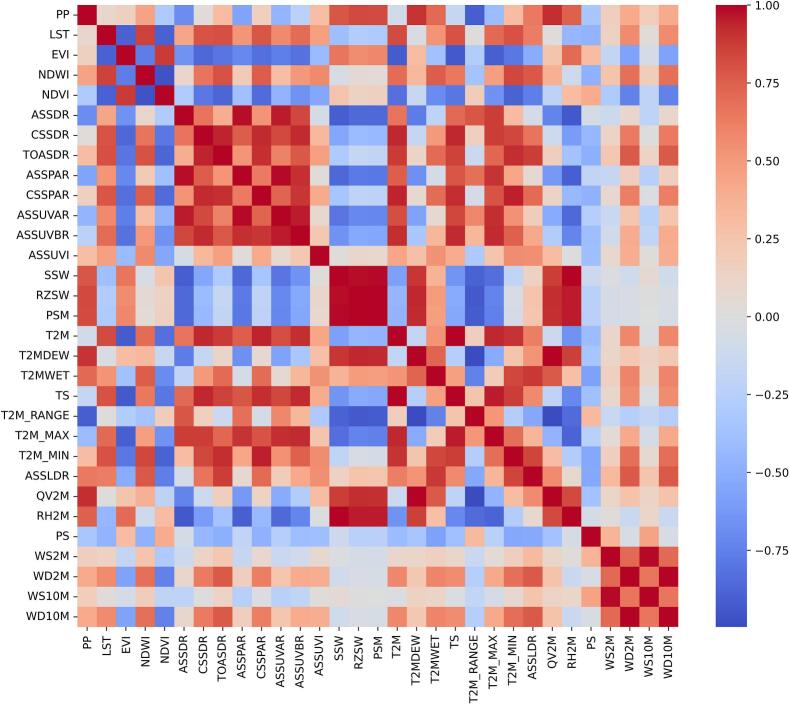 Figure 6
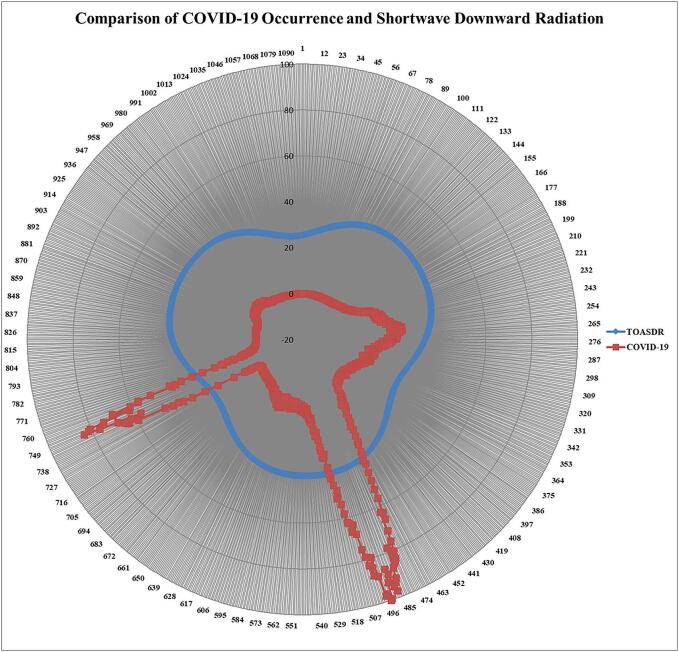 Figure 7
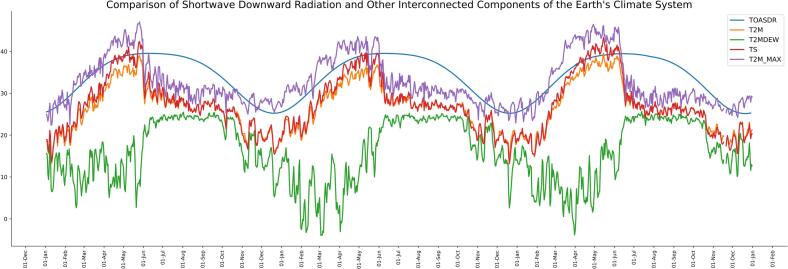 Figure 8
Peer Reviews
No public reviews on file for this paper yet. If you reviewed it on a platform where reviews are public (OpenReview, ICLR, NeurIPS, ICML), you can paste yours below so the community can read it here.
Videos
No videos yet. Explain this paper in a talk, walkthrough, or lecture? Add one.
Taxonomy
TopicsCOVID-19 epidemiological studies · COVID-19 Pandemic Impacts · COVID-19 impact on air quality
Introduction
1
The 21st century has seen the emergence and re-emergence of several infectious diseases, including SARS-CoV, MERS-CoV, and SARS-CoV-2—members of the coronavirus family that have posed recurring global health challenges. The COVID-19 pandemic, driven by SARS-CoV-2, demonstrated the widespread impact of emerging pathogens and underscored the need for proactive, data-driven public health strategies [1]. Understanding the spatial and temporal variation of infectious diseases is essential for improving early warning systems and outbreak preparedness.
From ecosystem crisis to one health
1.1
Environmental degradation, biodiversity loss, and climate change interact to destabilize ecosystems, influencing the persistence and transmission of pathogens [2]. These stressors contribute to shifts in infectious disease patterns and, in densely populated areas, may enable the emergence of novel variants—as observed during the COVID-19 pandemic [[3], [4], [5], [6], [7], [8]]. As shown in Fig. 1, environmental degradation acts locally, biodiversity loss operates regionally to globally, and climate change exerts global influence. Their interconnected effects form a feedback loop that contributes to emerging diseases such as SARS, MERS, Ebola, Nipah and others [9,10].Fig. 1. From ecosystem crisis to One Health.Fig. 1
Addressing these challenges requires a holistic One Health approach, grounded in understanding ecosystem crises through the analysis of Environmental and Climatic Determinants (ECDs) influencing disease dynamics [11,12].
Importance of creating sustainable pandemic response strategy (SPRS)and its purpose
1.2
World Health Organization released Pandemic Influenza Preparedness (PIP) Framework, for 2024–2030 which states that study of the impact of environment degradation and climate change becomes significant to contribute to human health and animal health. This shows the need for introspect of recent pandemic agent, SARS-CoV-2 with various ECDs [13]. To address this emerging concern, the development of Sustainable Pandemic Response Strategy (SPRS) is essential for addressing the future infectious disease challenges in the coming decades. The fundamental goal of SPRS is to develop climate-resilient infectious disease framework through a study of the association of ECDs with an infectious disease.
During the prevalence of COVID-19, WHO categorized the variant as Variant of Concern (VOC) and Variant of Interest (VOI) based on the severity of the occurrence pattern of COVID-19. For instance, studies have shown that VOCs such as Delta and Omicron exhibit surface stability that could influence transmission potential under various environmental conditions [14]. Moreover, climatic variables like temperature and humidity were found to significantly impact COVID-19 spread in different regions, emphasizing the role of environmental factors in modulating pandemic dynamics [[15], [16], [17], [18], [19], [20]]. Drawing from WHO's approach of classifying viral variants, this study proposes categorizing ECDs into:
- •Determinants of Concern (DOCs): ECDs that exhibit a strong correlation with disease transmission and may also influence other ECDs.
- •Determinants of Interest (DOIs): ECDs that are correlated with disease occurrence patterns and are likely influenced by DOCs.
This categorization helps provision of a framework of influential ECDs for an infectious disease irrespective of other confounding factors. This can help release of suitable polices and actions like lock down and travel restriction during outbreak or pandemic, and the effect of monitoring the concern ECDs and taking necessary precautionary steps to avoid the outbreak. Hence the proposed investigation is focused only on the investigation of the association of ECDs and the infectious disease, which will contribute to building the foundational knowledge needed for SPRS.
Limitations and gaps in existing research on COVID-19 and ECDs
1.3
Several studies have examined the correlation between COVID-19 occurrence and ECDs, primarily during the first or second pandemic waves. Meta-analyses report significant associations with temperature, humidity, wind speed, and population density. Early investigations in China, India, and the USA considered limited parameters, with around 517 articles focusing solely on temperature and humidity. Commonly identified ECDs include temperature, humidity, rainfall, dew point, sunshine duration, pressure, wind speed, and population density. Some studies found a negative correlation with temperature, while others reported a positive association with Diurnal Temperature Range (DTR). A few also explored UV radiation, solar radiation, and wind direction [[21], [22], [23], [24], [25]].
These ECDs have been examined using diverse analytical approaches, including correlation methods (Spearman, Kendall, and linear correlations), statistical and regression models (generalized additive models, negative binomial regression), causal and time-series models (Granger causality, vector autoregressive models, autoregressive distributed lag models), spatial analysis (bivariate spatial association), and machine learning techniques (e.g., artificial neural networks). Although COVID-19 transmission is influenced by various non-climatic factors such as socioeconomic and demographic variables, ECDs remain essential for understanding the environmental contribution to disease dynamics. Therefore, exploratory data analysis focusing on ECDs is vital for identifying their role in the spread of COVID-19 in India [[26], [27], [28]].
Despite the role of ECDs in shaping the spread of pathogens, the coronavirus remains a major threat due to its ability to drive recurring outbreaks and pandemics. This underscores the urgent need for dynamic epidemiological models that can identify outbreak patterns linked to seasonal or climatic variations. Developing such models will support evidence-based disease prevention strategies across different climates, especially in the absence of vaccines [29,30].
The survey highlights a research gap—most studies have not examined the association between COVID-19 and all available ECDs over the full pandemic period. Identifying influential ECDs across complete pandemic waves is essential for improving outbreak preparedness. There is also a need to standardize algorithms for detecting key ECDs in complex disease patterns to enhance predictive modeling and mitigation.
This study aims to develop a climate-resilient infectious disease framework by analysing the association between ECDs and COVID-19 spread. Beyond identifying correlated ECDs, the study seeks to uncover interacting or converging ones—termed DOCs. Since traditional statistical methods may not fully capture these complexities, the approach integrates evolutionary algorithms with correlation analysis to identify DOCs and DOIs requiring further validation.
Materials and methods
2
India is the seventh largest geographic, and most populous country in the world. It is located at 20.5937°N and 78.9629°E. The geographical location of India, along with the occurrence rate of COVID-19 spread as of June 30, 2022, is shown in Fig. 2 (https://prsindia.org/covid-19/cases). As on May 2, 2023 India is the second highest confirmed COVID-19 cases in the world [26,33].Fig. 2. The geographical location of India.Fig. 2
Figure 3 shows the occurrence pattern of COVID-19 in India. India faced three pandemic waves during the year 2020–2022. The first wave that began in March 2020 subsided by November 2020. The second wave started in February 2021 and ended by June 2021. The third wave, driven by the Omicron variant, began in December 2021, surged in cases in early 2022, and started to decline by February 2022.Fig. 3. Time series analysis of COVID-19 occurrence in India.Fig. 3
Spatial data preparation
2.1
Environmental time series data were obtained from Landsat 8 satellite imagery (LANDSAT/LC08/CO1/T1_TOA), which provides high-resolution observations with a spatial resolution of 15 to 30 m. Key environmental determinants such as NDVI, NDWI, EVI, and LST were derived using the Google Earth Engine (GEE) platform (https://code.earthengine.google.com/) from 2020 to 2022. GEE, a cloud-based geospatial tool, enables satellite image processing using JavaScript and Python through its API. Missing values in the environmental datasets were addressed using forward and backward fill imputation methods. Additional ECDs were retrieved from NASA's Prediction of Worldwide Energy Resources (POWER) portal (https://power.larc.nasa.gov/) for the COVID-19 period in India. As the NASA POWER data contained no missing values, it was directly used for analysing the impact of ECDs on COVID-19 spread. The temporal and spatial resolution of the Earth Observation data used is summarized in Table 1.Table 1. Description of utilized environmental and climatic determinants (ECDs).Table 1S.No.Environmental and Climatic Determinants (ECDs)NotationEarth ObservationData1Land Surface TemperatureLSTLandsat 8 satellite images (LANDSAT/LC08/CO1/T1_TOA); Spatial and Temporal Resolution: 15-30 m and 16 days2Enhanced Vegetation IndexEVI3Normalized Difference Wetness IndexNDWI4Normalized Difference Vegetation IndexNDVI5PrecipitationPP6All Sky Surface Shortwave Downward Irradiance (MJ/m^2/day)ASSDRNASA POWER Spatial and Temporal Resolution: 0.5° (∼55 km) at the equator for surface data, 1° (∼111 km) for atmospheric data and, Daily, Monthly7Clear Sky Surface Shortwave Downward Irradiance (MJ/m^2/day)CSSDR8Top-Of-Atmosphere Shortwave Downward Irradiance (MJ/m^2/day)TOASDR9All Sky Surface PAR Total (W/m^2)ASSPAR10Clear Sky Surface PAR Total (W/m^2)CSSPAR11All Sky Surface UVA Irradiance (W/m^2)ASSUVAR12All Sky Surface UVB Irradiance (W/m^2)ASSUVBR13All Sky Surface UV Index (dimensionless)ASSUVI14Surface Soil WetnessSSW15Root Zone Soil WetnessRZSW16Profile Soil MoisturePSM17Temperature at 2 Meters (C)T2M18Dew/Frost Point at 2 Meters (C)T2MDEW19Wet Bulb Temperature at 2 Meters (C)T2MWET20Surface TemperatureTS21Temperature at 2 Meters Range (C)T2M_RANGE22Temperature at 2 Meters Maximum (C)T2M_MAX23Temperature at 2 Meters Minimum (C)T2M_MIN24All Sky Surface Long-wave Downward Irradiance (W/m^2)ASSLDR25Specific Humidity at 2 Meters (g/kg)QV2M26Relative Humidity at 2 Meters (%)RH2M27Surface Pressure (kPa)PS28Wind Speed at 2 Meters (m/s)WS2M29Wind Direction at 2 Meters (Degrees)WD2M30Wind Speed at 10 Meters (m/s)WS10M31Wind Direction at 10 Meters (Degrees)WD10M
A total of 31 Environmental and Climatic Determinants (ECDs) were selected based on literature, focusing on factors frequently used in infectious disease monitoring. These determinants were chosen for their availability through freely accessible satellite and Earth observation datasets, enabling real-time monitoring and modeling of infectious disease dynamics through a diverse range of ECDs.
Proposed research framework for identifying influential ECDs
2.2
Comprehensive exploration of direct, indirect, and complex associations is crucial for identifying influential ECDs that shape infectious disease dynamics. The proposed research framework shown as Fig. 4, provides the outline of the proposed investigation to identify influential ECDs and categorize ECDs as DOC and DOI. Direct associations between ECDs and COVID-19 spread were analyzed using Bivariate Correlation Analysis (BCA), indirect associations through Multivariate Correlation Analysis (MCA), and complex patterns via a correlation-based evolutionary algorithm. Influential ECDs were then identified and categorized as Determinants of Concern (DOCs) and Determinants of Interest (DOIs).Fig. 4. Proposed research framework.Fig. 4
The proposed computational analysis has used Convergence Search – Add or Eliminate (CS-AE) algorithm. It comprises spatial data preparation, which includes the creation of an ECD table and a COVID-19 occurrence table, Bivariate Correlation Analysis (BCA), Creation of CCD (Cross Correlated Determinants) table, Creation of ECE (ECD Cross-correlated with other ECDs) table, Multivariate Cross-correlation Analysis (MCA), and finally, categorization of ECDs as DOC and DOI Convergence Search and Add or Eliminate (CS-AE) method.
The strength of association was evaluated using correlation coefficients (r). A value of ±1.0 indicates a perfect relationship where both variables consistently change together, while values between ±0.9 and ± 0.8 reflect a very strong association. Coefficients ranging from ±0.7 to ±0.6 indicate a moderate relationship, and values from ±0.5 to ±0.3 suggest a fair connection. A weak or poor association is represented by values between ±0.2 and ± 0.1, whereas a coefficient of 0 signifies no relationship between the variables [34,35].
The initial step in implementing the proposed research framework involves the collection of infectious disease occurrence data, along with the extraction and derivation of ECDs from Earth Observation (EO) data. Fig. 5 illustrates the steps for implementing the proposed CS-AE algorithm using correlation based evolutionary approach.Fig. 5CS-AE Implementation Based on Evolutionary Steps.Fig. 5
Based on the COVID-19 occurrence datasets and the extracted or derived ECDs from the EO data, create the following table to implement the proposed CS-AE algorithm.
Create ECD table
2.2.1
Let and represents various ECD's and Covid-19 occurrence in India from 03 Jan 2020 to 31 Dec 2022.
Where, .
Create COVID-19 data table
2.2.2
Collect COVID-19 data from the portal and form a table as
Where,
Create CCD (Cross Correlated Determinants) table
2.2.3
Perform cross correlation for the investigation of the complex linkage COVID-19 occurrence rate and ECDs, represent them as a Cross Correlated Determinants, CCD table.
Create ECE (ECD Cross correlated with other ECDs) table - Selection
2.2.4
For each ECD, select the influential ECDs based on the correlation-based fitness function (r ≥ 0.6). Select only the moderate, strong and highly correlated ECDs with an ECD by using CCD table and create ECE table (ECD Cross correlated with other ECDs).
Where,
Convergent Search (CS) process - crossover:
2.2.5
In this step, the algorithm searches for ECDs that exhibit significant interactions or convergence with one another. Accordingly, the relationships between each ECD and its cross-correlated counterparts are reassessed in every iteration to identify which determinants most strongly converge or interact with the spread of the disease. Each iteration is evaluated using a fitness function, with a correlation threshold of r ≥ 0.8. The outcome of the CS process is the identification of convergent or interactive determinants that satisfy this fitness criterion. The search process terminates when the selected ECDs meet or exceed the correlation threshold. If the threshold is not achieved, the process continues to optimize until the maximum possible correlation is obtained.
Add or eliminate (AE) process – mutation
2.2.6
For each ECD, the algorithm evaluates its convergent ECDs, adding or eliminating non-influential and influential ones based on the fitness function (r ≥ 0.8). This process continues until a high correlation level is reached, ensuring that only the most influential ECDs are retained while overfitted ones are excluded from the final analysis.
Identification of Determinants of Concern (DOC) and Determinant of Interest (DOI) based on CS-AE method:
- •Determine DOC: The DOC refer to ECD that play a significant role in the occurrence and spread of COVID-19. These determinants are often strongly correlated with disease transmission and may also influence other ECDs. DOCs are critical for explaining the spatial and temporal dynamics of COVID-19 and are essential to understanding and managing outbreaks. The identification of DOC is based on assessing the degree of involvement of each ECD, particularly through convergent/interactive effects and the add process incorporated in the CS-AE method.
- •Determine DOI: After multiple iterations of selection, crossover, and mutation, the algorithm identifies a final set of ECDs that exhibit a very strong correlation with the occurrence pattern of COVID-19. ECDs with a correlation coefficient greater than 0.9 (r ≥ 0.9) are referred to as DOI, as they are considered to have the most significant impact on the transmission dynamics.
Granger causality test for validating DOC
2.3
The Granger causality test evaluates whether past values of one time series can predict future values of another, using lagged data. If the past values of variable X significantly improve the prediction of Y, then X is said to Granger-cause Y. The test provides both an F-test (for short-term, linear associations) and a Chi-square test (for long-term, potentially nonlinear associations), along with corresponding p-values. The ECDs showing statistical significance in these tests, as well as in correlation analysis, can be classified as DOC. Thus, the Granger causality test strengthens the identification of DOC by capturing temporal and causal relationships.
Implementation
3
The proposed CS-AE algorithm was implemented in RStudio version 3.6.0. Based on the extracted and derived ECDs using GEE API and COVID-19 occurrence rate, Bivariate Correlation Analysis (BCA) was performed using RStudio. This helped in understanding the level of direct association of COVID-19 spread and ECDs. Table 2 shows the result of the Bivariate Correlation Analysis (BCA) with COVID-19 occurrence rate and ECDs. Only the Enhanced Vegetation Index is moderately associated with the occurrence of COVID-19 in India.Table 2. Bivariate correlation analysis (BCA).Table 2S.No.ECDsCorrelationSeverity Level1PP0.3304Fair Correlation2LST0.5269Fair Correlation3EVI−0.6747Moderate Correlation4NDWI0.5382Fair Correlation5NDVI−0.4547Fair Correlation6ASSDR−0.1568No Correlation7CSSDR0.1961No Correlation8TOASDR0.2190No Correlation9ASSPAR−0.0809No Correlation10CSSPAR0.2007No Correlation11ASSUVAR−0.0355No Correlation12ASSUVBR0.0629No Correlation13ASSUVI0.1020No Correlation14SSW0.3102Fair Correlation15RZSW0.2986No Correlation16PSM0.2818No Correlation17T2M0.0765No Correlation18T2MDEW0.3085Fair Correlation19T2MWET0.2812No Correlation20TS0.046No Correlation21T2M_RANGE−0.3081Fair Correlation22T2M_MAX−0.0203No Correlation23T2M_MIN0.1763No Correlation24ASSLDR0.1942No Correlation25QV2M0.3088Fair Correlation26RH2M0.2319No Correlation27PS−0.2722No Correlation28WS2M0.0478No Correlation29WD2M0.1937No Correlation30WS10M0.0453No Correlation31WD10M0.1941No Correlation
Out of 31 ECDs, EVI alone shows a moderate correlation with COVID-19 occurrence. A few determinants that include PP, LST, NDWI, NDVI, SSW, T2MDEW, T2M_RANGE, and QV2M exhibit a fair correlation. Notably, none of the parameters demonstrates a very strong correlation. Multivariate Correlation Analysis (MCA) is performed identify the indirect relationships between COVID-19 occurrence data and various ECDs.
Multivariate correlation analysis (MCA) – Indirect association analysis
3.1
Analysis of indirect influential ECDs on COVID-19 spread was performed using Multivariate Correlation Analysis (MCA). This is based on the Cross Correlated Determinants (CCD) for an each ECD with a correlation-based fitness function (r ≥ 0.6).
Creation of cross correlated determinants (CCD)
3.1.1
To identify the association of one ECD with other ECDs, cross-correlation was performed using RStudio. This provides the Cross Correlated Determinants (CCD) table based on the Fig. 6 shows the CCD matrix depicting the relationship of one ECD with others.Fig. 6. Cross correlated determinants (CCD) matrix.Fig. 6
Creation of ECD cross correlated with other ECDs (ECE) table
3.1.2
Figure 5 illustrates how each ECD changes in relation to other ECDs through cross-correlation. To perform MCA, ECDs that exhibit perfect, very strong, moderate, and fair correlations (r ≥ 0.6) with other ECDs were extracted based on the fitness function. Table 3 shows the cross-correlated ECDs with each ECD. LST exhibits a moderate correlation only with EVI, whereas ASSUVI does not exhibit any significant correlation with other ECDs.Table 3ECD Cross correlated with other ECDs (ECE) table.Table 3S.No.ECDsCross Correlated ECDs1PPSSW,RZSW,PSM,T2MDEW,T2M_RANGE, QV2M2LSTEVI3EVILST,NDWI, NDVI, TOASDR, T2M, TS,T2M_MAX, T2M_MIN4NDWIEVI, NDVI5NDVIEVI, NDWI, TOASDR6ASSDRASSPAR, ASSUVAR, ASSUVBR, T2M_MAX, RH2M7CSSDRASSPAR, ASSUVAR, ASSUVBR, T2M_MAX8TOASDREVI, NDVI, CSSDR, CSSPAR, ASSUVBR, T2M, T2MWET,TS, T2M_MAX, T2M_MIN, ASSLDR, WD2M, WD10M9ASSPARASSDR, CSSDR, ASSUVAR, ASSUVBR, T2M_MAX, RH2M10CSSPARCSSDR, TOASDR, ASSUVBR, ASSUVAR, T2M, T2MWET, TS, T2M_MAX, T2M_MIN, ASSLDR, PS11ASSUVARASSDR, CSSDR, ASSPAR, ASSUVBR, CSSPAR, T2M, TS, T2M_MAX12ASSUVBRASSDR, CSSDR, ASSPAR, CSSPAR, ASSUVAR, TOASDR, T2M, TS, T2M_MIN, T2M_MAX13ASSUVINone14SSWPP, RZSW, PSM, T2M_DEW, T2M_RANGE, T2M_MAX, QV2M, RH2M15RZSWPP, SSW, PSM, T2M_DEW, T2M_RANGE, QV2M, RH2M16PSMPP, SSW, RZSW, T2M_DEW, T2M_RANGE, QV2M, RH2M17T2MEVI, CSSDR, TOASDR, CSSPAR, ASSUVAR, ASSUVBR, T2M_WET, TS, T2M_MAX, T2M_MIN, ASSLDR, PS18T2MDEWPP, SSW, RZSW, PSM, T2M_WET, T2M_RANGE, ASSLDR, QV2M, RH2M19T2MWETTOASDR, CSSPAR, T2M, T2M_DEW, T2M_RANGE, T2M_MIN, ASSLDR, QV2M, PS20TSEVI, CSSDR, TOASDR, CSSPAR, ASSUVAR, ASSUVBR, T2M, T2M_MAX, T2M_MIN, ASSLDR21T2M_RANGEPP, SSW, RZSW, PSM, T2M_DEW, T2M_WET, ASSLDR, QV2M, RH2M22T2M_MAXEVI, ASSDR, CSSDR, TOASDR, ASSPAR, CSSPAR, ASSUVAR, ASSUVBR, SSW, T2M, TS, T2M_MIN, RH2M23T2M_MINEVI, CSSDR, TOASDR, CSSPAR, T2M, T2M_WET, TS, T2M_MAX, ASSLDR, PS, WD2M, WD10M24ASSLDRTOASDR, CSSPAR, T2M, T2M_DEW, T2M_WET, TS, T2M_RANGE, T2M_MIN, QV2M25QV2MPP, SSW, RZSW, PSM, T2M_DEW, T2M_WET, T2M_RANGE, ASSLDR, RH2M26RH2MASSDR, ASSPAR, SSW, RZSW, PSM, T2M_DEW, T2M_RANGE, T2M_MAX27PSCSSPAR, T2M, T2M_WET, T2M_MIN, PS, WS2M, WS2M_MAX, WS2M_MIN, WS2M_RANGE, WS10M, WS10M_MIN, WS10M_MAX, WS10M_RANGE28WS2MWS2M_MAX, WS2M_MIN, WS2M_RANGE, WS10M, WS10M_MIN, WS10M_MAX, WS10M_RANGE29WD2MTOASDR, T2M_MIN, WD10M30WS10MWS2M, WS2M_MIN, WS2M_MAX, WS2M_RANGE31WD10MTOASDR, T2M_MIN, WD10M
Based on the ECE table performed MCA to explore the indirect association between the occurrence of COVID-19 and the ECDs and it shown in Table 4.Table 4. Multivariate correlation analysis (MCA).Table 4S.No.ECDsCross Correlated ECDs (CCDs)CorrelationCorrelation Level1PPSSW,RZSW,PSM,T2MDEW,T2M_RANGE, QV2M0.2908No Correlation2LSTEVI0.5345Fair Correlation3EVILST,NDWI, NDVI, TOASDR, T2M, TS,T2M_MAX, T2M_MIN0.6047Moderate Correlation4NDWIEVI, NDVI0.4856Fair Correlation5NDVIEVI, NDWI, TOASDR0.5041Fair Correlation6ASSDRASSPAR, ASSUVAR, ASSUVBR, T2M_MAX, RH2M0.2385No Correlation7CSSDRASSPAR, ASSUVAR, ASSUVBR, T2M_MAX0.2064No Correlation8TOASDREVI, NDVI, CSSDR, CSSPAR, ASSUVBR, T2M, T2MWET, TS, T2M_MAX, T2M_MIN, ASSLDR, WD2M, WD10M0.5806Fair Correlation9ASSPARASSDR, CSSDR, ASSUVAR, ASSUVBR, T2M_MAX, RH2M0.2459No Correlation10CSSPARCSSDR, TOASDR, ASSUVBR, ASSUVAR, T2M, T2MWET, TS, T2M_MAX, T2M_MIN, ASSLDR, PS0.3479Fair Correlation11ASSUVARASSDR, CSSDR, ASSPAR, ASSUVBR, CSSPAR, T2M, TS, T2M_MAX0.3047Fair Correlation12ASSUVBRASSDR, CSSDR, ASSPAR, CSSPAR, ASSUVAR, TOASDR, T2M, TS, T2M_MIN, T2M_MAX0.3746Fair Correlation13ASSUVINo Correlation–None14SSWPP, RZSW, PSM, T2M_DEW, T2M_RANGE, T2M_MAX, QV2M, RH2M0.3326Fair Correlation15RZSWPP, SSW, PSM, T2M_DEW, T2M_RANGE, QV2M, RH2M0.3286Fair Correlation16PSMPP, SSW, RZSW, T2M_DEW, T2M_RANGE, QV2M, RH2M0.3286Fair Correlation17T2MEVI, CSSDR, TOASDR, CSSPAR, ASSUVAR, ASSUVBR, T2M_WET, TS, T2M_MAX, T2M_MIN, ASSLDR, PS0.8669Very Strong Correlation18T2MDEWPP, SSW, RZSW, PSM, T2M_WET, T2M_RANGE, ASSLDR, QV2M, RH2M0.3557Fair Correlation19T2MWETTOASDR, CSSPAR, T2M, T2M_DEW, T2M_RANGE, T2M_MIN, ASSLDR, QV2M, PS0.3854Fair Correlation20TSEVI, CSSDR, TOASDR, CSSPAR, ASSUVAR, ASSUVBR, T2M, T2M_MAX, T2M_MIN, ASSLDR0.5825Fair Correlation21T2M_RANGEPP, SSW, RZSW, PSM, T2M_DEW, T2M_WET, ASSLDR, QV2M, RH2M0.3557Fair Correlation22T2M_MAXEVI, ASSDR, CSSDR, TOASDR, ASSPAR, CSSPAR, ASSUVAR, ASSUVBR, SSW, T2M, TS, T2M_MIN, RH2M0.6098Moderate Correlation23T2M_MINEVI, CSSDR, TOASDR, CSSPAR, T2M, T2M_WET, TS, T2M_MAX, ASSLDR, PS, WD2M, WD10M0.57907Fair Correlation24ASSLDRTOASDR, CSSPAR, T2M, T2M_DEW, T2M_WET, TS, T2M_RANGE, T2M_MIN, QV2M0.3694Fair Correlation25QV2MPP, SSW, RZSW, PSM, T2M_DEW, T2M_WET, T2M_RANGE, ASSLDR, RH2M0.3557Fair Correlation26RH2MASSDR, ASSPAR, SSW, RZSW, PSM, T2M_DEW, T2M_RANGE, T2M_MAX0.6445Moderate Correlation27PSCSSPAR, T2M, T2M_WET, T2M_MIN, PS, WS2M, WS2M_MAX, WS2M_MIN, WS2M_RANGE, WS10M, WS10M_MIN, WS10M_MAX, WS10M_RANGE0.1907No Correlation28WS2MWS2M_MAX, WS2M_MIN, WS2M_RANGE, WS10M, WS10M_MIN, WS10M_MAX, WS10M_RANGE0.1823No Correlation29WD2MTOASDR, T2M_MIN, WD10M0.1329No Correlation30WS10MWS2M, WS2M_MIN, WS2M_MAX, WS2M_RANGE0.1823No Correlation31WD10MTOASDR, T2M_MIN, WD10M0.1329No Correlation
It shows, Air Temperature (r = 0.8669) exhibits a very strong association with COVID-19 occurrence in India. A few determinants such as Enhanced Vegetation Index (r = 0.6047), Maximum Temperature (r = 0.6098), and Relative Humidity (r = 0.6445) exhibit a moderate association. The BCA revealed no direct influential ECD for COVID-19 spread, whereas MCA identified Air Temperature as an indirect influential ECD. The complex interplay between ECDs and COVID-19 spread can be further investigated using the proposed CS-AE algorithm. This investigation helps categorization of the ECDs as DOC and DOI.
Results and discussion
4
The CS-AE method was implemented in R Studio to investigate complex associations. As shown in Table 5, twenty ECDs exhibited a very strong association with COVID-19 occurrence, while seven demonstrated moderate and three showed fair levels of association.Table 5. Convergence search – add or eliminate (CS-AE) algorithm.Table 5S.No.ECDsConvergent Determinants (CDs)AddedDeterminantEliminatedDeterminantCorrelationCorrelation Level1PPQV2M,TOASDRTOASDR–0.7914Moderate Correlation2LSTEVI,TOASDRTOASDR0.7979Moderate Correlation3EVICSSDR,TOASDR–T2M_MIN0.9658Very strong Correlation4NDWIEVI,TOASDR–NDVI0.7820Moderate Correlation5NDVIEVI,TOASDR–NDVI0.7820Moderate Correlation6ASSDRASSDR,TOASDR–T2M_MAX0.8553Very Strong Correlation7CSSDRT2M_MAX,TOASDR––0.7565Moderate Correlation8TOASDRTOASDR,CSSPAR––0.9525Very Strong Correlation9ASSPARTS,T2M_MAX––0.9027Very Strong Correlation10CSSPARASSUVAR,ASSUVBRTOASDR0.9486Very Strong Correlation11ASSUVARASSLDR,PS––0.8612Very Strong Correlation12ASSUVBRT2M,T2M_MAX0.8007Very Strong Correlation13ASSUVI––––14SSWTS,T2M_MAXTOASDR–0.9759Very Strong Correlation15RZSWT2MDEW,T2M_RANGE0.8778Very Strong Correlation16PSMT2M_MAX,TOASDR0.8778Very Strong Correlation17T2MT2MDEW,T2M_RANGE0.9942Very Strong Correlation18T2MDEWT2MDEW,T2M_RANGE0.9942Very Strong Correlation19T2MWETCSSPAR,TOASDR0.8419Very Strong Correlation20TST2M_MAX,ASSLDR0.9526Very Strong Correlation21T2M_RANGET2MWET,T2M_RANGETOASDRASSLDR0.9237Very Strong Correlation22T2M_MAXT2M_MAX,T2MDEW0.9445Very Strong Correlation23T2M_MINEVI,TOASDR0.9940Very Strong Correlation24ASSLDRRH2M,TOASDR0.8890Very Strong Correlation25QV2MCSSDR,TOASDRASSLDR0.9224Very Strong Correlation26RH2MASSUVAR,ASSUVBR0.7704Moderate Correlation27PSTOASDR,CSSPART2MWET,T2MMIN0.8492Very Strong Correlation28WS2MT2M_RANGE,T2M_MINTOASDRWS2M,WS2M_MAX,0.6408Moderate Correlation29WD2MT2MWET,T2M_RANGEEVIWS2M_MIN, WS2_RANGE,WS10M0.5967Fair Correlation30WS10MRH2M,ASSDREVI,TOASDRWS10M_MIN, WS10M_MAX,0.5392Fair Correlation31WD10MT2M_RANGE,T2M_MAXEVIWS10M_RANGE0.5967Fair Correlation
Significant findings from CS-AE algorithm
4.1
The CS-AE algorithm has demonstrated a robust capacity for the identificaiton and categorization of ECDs, their interactions with Convergent Determinants (CDs) and the occurrence pattern of an infectious disease. This helps unravelling the intricate dynamics between different climatic variables, offering valuable insights for understanding environmental factors influencing occurrences of infectious diseases like COVID-19. The algorithm highlights the convergence of multiple ECDs, that point to a collective influence on disease occurrence. Some of key findings of the proposed CS-AE algorithm are:
- 1.Land Surface Temperature (r = 0.7979) is a key ECD linked with the Enhanced Vegetation Index and Top-of-Atmosphere Shortwave Downward Irradiance. These interactions reveals the interplay between temperature, vegetation, and radiative energy, which collectively influence the overall climate.
- 2.Precipitation (r = 0.7914) is associated with specific humidity and top-of-atmosphere shortwave downward irradiance, highlighting the combined effect of moisture and radiative heat on climate and potential health outcomes.
- 3.Normalized Difference Wetness Index (r = 0.7820) and Normalized Difference Vegetation Index (r = 0.7820) are tied to EVI and TOASDR with the underlining of the relationship between vegetation, moisture levels, and shortwave radiation.
- 4.Shortwave Downward Radiation (r = 0.9525) and Long-wave Downward Irradiance (r = 0.8890), interact in complex ways for the influence on surface temperatures, humidity, and atmospheric pressure. These components affect both direct climatic conditions and indirect feedback mechanisms (e.g., disease transmission).
- 5.Temperature (r > 0.8) variables (T2M_MAX, T2M_MIN, T2M, T2MDEW, T2M_RANGE) exhibit intricate links with various environmental factors, such as Wet Bulb Temperature (T2MWET), Dew Point (T2MDEW), and Specific Humidity (QV2M). These interactions are significant in understanding the impact of temperature fluctuations on public health, including the incidence of COVID-19.
- 6.Top-Of-Atmosphere Shortwave Downward Irradiance (r = 0.9525), as a central determinant, is frequently identified as interacting with other key variables such as CSSPAR, ASSDR, and T2M_MAX. The synergy between these factors indicates that changes in one element, such as radiation levels, can impact multiple atmospheric variables with further affecting the overall climate system. TOASDR interacts with variables such as EVI, QV2M, and T2M, revealing the influence of radiation directly on surface temperatures, moisture content, and humidity. These factors have a significant bearing on disease transmission patterns, as variations in these climatic conditions can create conducive environments for viral spread. To conclude, Shortwave Downward Radiation (SDR) is shown as a Core Determinant among other determinants.
- 7.All Sky Surface PAR (r = 0.9027) is linked with temperature variables like T2M_MAX, T2M_MIN, and TS (surface temperature), demonstrating the contribution between light intensity and temperature for the influence of combine climate patterns and potentially impact disease occurrence.
- 8.Air temperature (r = 0.9942) and dew point temperature (r = 0.9942) have a significant relationship with humidity levels (QV2M and RH2M), influencing the air's capacity to hold moisture and potentially affecting viral stability and transmission.
- 9.Surface Pressure (r = 0.8492) interacts with TOASDR and CSSPAR, with influence on atmospheric dynamics and contributing to feedback loops that affect climate and health outcomes.
- 10.Soil moisture indices such as Surface Soil Wetness (r = 0.9759) and Root Zone Soil Wetness (r = 0.8778), and vegetation-related indices like NDVI and EVI, are critical in understanding the ecological environment's role in disease spread. Vegetation, soil moisture, and radiative energy together impact surface temperatures and humidity, thus playing an indirect role in shaping the environment's susceptibility to outbreaks.
Table 6 shows ECDs with very strong correlation (r ≥ 0.9). Out of 31 ECDs, twenty exhibited a very strong and complex association. Hence these ECDs are categorized as DOI based on CS-AE algorithm.Table 6. Determinants of interest (DOI) based on CS-AE algorithm.Table 6S.No.ECDsCorrelation LevelConvergent Determinant1EVIVery StrongShortwave Downward Radiation2ASSDRVery StrongShortwave Downward Radiation3TOASDRVery StrongPhotosynthetically Active Radiation4ASSPARVery StrongSurface Temperature5CSSPARVery StrongShortwave Downward Radiation6ASSUVARVery StrongLongwave Downward Radiation, Surface Pressure7ASSUVBRVery StrongTemperature8SSWVery StrongShortwave Downward Radiation, Surface Temperature9RZSWVery StrongAir Temperature10PSMVery StrongShortwave Downward Radiation, Surface Temperature11T2MVery StrongDew Point and Air Temperature12T2MDEWVery StrongAir Temperature13T2MWETVery StrongShortwave Downward Radiation, Photosynthetically Active Radiation14TSVery StrongLongwave Downward Radiation and Air Temperature15T2M_RANGEVery StrongShortwave Downward Radiation, Wet-Bulb Temperature16T2M_MAXVery StrongDew Point Temperature17T2M_MINVery StrongShortwave Downward Radiation18ASSLDRVery StrongShortwave Downward Radiation, Relative Humidity19QV2MVery StrongShortwave Downward Radiation20PSVery StrongShortwave Downward Radiation, Photosynthetically Active Radiation
It also reveals Shortwave Downward Radiation (SDR) as a predominant influential ECD, because it significantly impacting several other ECDs.
Determinant of concern (DOC) for the occurrence pattern of COVID-19
4.2
In the investigation of influential ECDs on COVID-19 spread using the CS-AE algorithm, SDR was identified as a predominant influential ECD. The radar chart facilitates visual comparison between multiple quantitative variables across different categories. It also highlights patterns, trends, and relationships in multivariate data and helps getting the complex information.
Figure 7 showcases a radar chart, illustrating the relationship between COVID-19 occurrences and shortwave downward radiation. India experienced three significant spikes in COVID-19 cases during the pandemic, aligning closely with variations in shortwave downward radiation, identified as a concern determinant influencing the spreading dynamics of SARS-CoV-2 pathogen. The discrepancy in the spike timing between TOASDR and COVID-19 occurrences could be by two possibilities: (1) Delays in recording the dates when COVID-19 cases were reported: This means that there may be delays between when individuals actually contracted the virus and when their cases were officially recorded in the data. (2) Delays in the appearance of symptoms associated with the SARS-CoV-2 virus: This refers to the time taken for individuals who have contracted the virus to begin experiencing symptoms. These delays in symptom onset can vary from person to person and may affect the timing of when cases are officially reported.Fig. 7. Comparison of top of atmosphere shortwave downward radiation (TOASDR) and COVID-19 occurrences in India.Fig. 7
Variations in radiation levels have a direct or indirect effect on various ECDs with influence on the infectiousness of the SARS-CoV-2 pathogen. The overall trend shows three distinct phases of both rising and falling shortwave downward radiation alongside COVID-19 occurrences in India. This highlights the dynamic interplay between ECDs and the transmission of COVID-19.
Shortwave downward radiation serves as a pivotal factor in shaping atmospheric dynamics and impacting key elements such as air temperature, humidity, surface pressure, and surface temperature. These components form interconnected parts of the Earth's climate system, where alterations in one element can trigger ripple effects across others, creating intricate feedback loops and climate patterns. Therefore, in addition to shortwave downward radiation, as per the result of MCA, temperature plays a significant role in the occurrence pattern of COVID-19. Fig. 8, shows the comparison between trends and patterns of shortwave downward radiation and all forms of highly correlated temperature as per CS-AE algorithm such as dew temperature (T2MDEW), air temperature (T2M), and wet bulb temperature (T2MWET). The increasing and decreasing trend of air wet bulb and dew temperature is in correlated with SDR.Fig. 8. Comparison of shortwave downward radiation and other interconnected components of the earth's climate system.Fig. 8
Using CS-AE algorithm, SDR was identified as a DOC. The highly correlated determinants (20 ECDs), namely, temperature, humidity, vegetation index, etc., are identified as DOI.
Granger causality test to claim DOC
4.3
The SDR was found to be a DOC, which may be a KRF when it studied with other confounding factors. The identified DOC can be investigated further through Granger causality test to strengthen the claim.
Granger causality test for DOC
4.3.1
The Granger causality test between SDR and the COVID-19 occurrence rate was performed to strengthen the claim of DOC. This test was employed to identify potential temporal causality between SDR and the spread of COVID-19. It was conducted for the occurrence of three different pandemic waves in India.
Table 8 presents two tests, namely the F-test and the chi-square test, along with their significance values (p-values).Table 8. Granger causality test for DOC – shortwave downward radiation.Table 8ECDsLagFirst Pandemic WaveSecond Pandemic WaveThird Pandemic WaveF-TestChi2 testF-TestChi2 testF-TestChi2 testFpchi2pFpchi2pFpchi2pTOASDR12.57430.11122.63870.10434.84380.02974.96590.02598.64890.00428.94720.002823.72980.02697.77850.02055.16320.007110.77150.00469.46220.000229.3334033.04020.03199.68070.02154.97380.002815.84560.00129029.3334042.40790.053610.41270.0342.89260.025512.51710.01394.00240.005317.85680.001352.44170.038813.45170.01952.13940.066211.79660.03773.3270.009119.07480.001965.07350.000134.210102.10510.058814.20970.02743.10240.009321.97530.001278.2727066.424601.05090.40098.44860.29471.78850.103515.24140.03380.69140.69836.48080.59351.21980.295511.45160.17741.62680.134116.36710.037490.42190.92054.54840.87181.42610.187915.40160.08052.63690.011730.88970.0003100.43870.92385.37730.86461.42040.183817.44570.06511.80770.078624.40350.0066
For the first pandemic wave, TOASDR exhibits a temporal and causal relationship with the occurrence of COVID-19 at lags of 2, 3, 6, and 7. These lags may be attributed to delays in reporting the incidence rate, data collection, or the virus's incubation period before case detection. Such time delays are common in epidemiological data. Lag 2 might reflect an early influence of TOASDR on the spread, while lags 6 and 7 could indicate more prolonged effects, potentially due to reporting delays or longer incubation periods.
For the second pandemic wave, TOASDR shows a causal relationship with the occurrence of COVID-19 at lags of 1, 2, 3, and 4, indicating an immediate effect of TOASDR on COVID-19 incidence with shorter lags. This could suggest a quicker response or a more direct influence during this wave, possibly due to improved reporting or a reduced delay in case detection compared to the first wave.
For the third wave, the effect of TOASDR extends to lags of 1, 2, 3, 4, 6, and 7, suggesting a persistent influence of TOASDR for up to six days. It is reasonable to assume that the pandemic had reached a more complex stage at this point, with various factors (e.g., vaccine rollout, policy changes, public behaviour) affecting the speed and nature of case reporting and the spread of the virus.
Granger causality test for SDRs interconnected components of earth's climate system
4.3.2
The interconnected components of Earth's climate system, influenced by Surface Downward Radiation (SDR), include air temperature, wet bulb temperature, dew point temperature, and surface temperature. In multivariate correlation analysis, air temperature was found to be highly correlated with the spread of COVID-19.
In the CS-AE algorithm, SDR was identified as playing a predominant role in COVID-19 spread. Additionally, air temperature (T2M), surface temperature (TS), wet bulb temperature (T2MWET), and dew point temperature (T2MDEW) were found to be interconnected components of SDR, exhibiting a strong correlation with COVID-19 spread according to the proposed approach.
Table 9 presents the Granger Causality Test for SDR's interconnected components of Earth's climate system. Air temperature (T2M) exhibited the most significant p-value for both the F-test and the chi-squared test. T2M showed a temporal and causal relationship at lag 7 during the first wave and lag 3 during the second and third pandemic waves.Table 9. Granger causality test for SDRs interconnected components of earth's climate system.Table 9ECDsLagFirst Pandemic WaveSecond Pandemic WaveThird Pandemic WaveF-TestChi2 testF-TestChi2 testF-TestChi2 testFpchi2pFpchi2pFpchi2pT2M11.77230.18561.81670.17774.84380.02974.96590.02590.02350.87840.02430.87621.25840.28792.62430.26925.16320.007110.77150.00460.85630.42841.81460.403631.89010.13526.01860.11074.97380.002815.84560.00123.07760.032110.03080.018341.67870.15997.25940.12282.89260.025512.51710.01392.46680.051711.00580.026551.83780.111510.12490.07182.13940.066211.79660.03772.08930.07611.97860.035162.45210.029316.53410.01122.10510.058814.20970.02742.07880.066214.72450.022572.63130.015321.12780.00361.05090.40098.44860.29472.63740.017822.47540.002181.28990.257512.09160.14721.21980.295511.45160.17741.56920.151215.78710.045591.58930.129317.13460.04661.42610.187915.40160.08051.29030.2615.11530.0878101.35430.21416.60140.08371.42040.183817.44570.06511.09390.381514.76740.1408T2MDEW11.84260.17721.88870.169312.84360.000513.16740.000313.26250.000513.71980.000220.93820.39431.95660.3763.96950.02158.28130.01592.70120.0735.72390.057231.73580.16365.5270.1373.10350.02959.88720.01954.78420.00415.5930.001441.65680.16517.16460.12741.9250.11138.330.08022.3640.060210.5470.032251.43630.21717.91320.16112.19740.059812.11650.03322.17510.065812.47050.028961.94040.08113.0840.04172.07830.06214.02830.02931.77270.116912.55690.050671.93260.071915.5180.02991.39930.213911.24960.12811.43550.205412.23260.093280.96310.46939.02770.341.19160.31211.18610.19140.90890.51479.14430.330391.25920.269213.57520.13831.1410.342212.32240.19570.97410.469911.41130.2486101.26410.262215.49560.1151.1990.302114.72730.14230.73140.6929.87450.4516T2MWET11.95290.16482.00180.157112.38120.000612.69330.000411.6070.00112.00730.000521.03930.35692.16750.33833.37710.03757.04540.02951.34580.26592.85180.240331.93450.1286.15970.10412.84580.04089.06620.02845.50910.001717.95550.000442.00430.09888.66720.071.6850.15867.29150.12132.78230.032312.41310.014551.83920.111210.13280.07161.90570.099310.50820.06212.95430.017316.93820.004662.37430.034316.00970.01371.82960.100412.34970.05463.36240.005623.81690.000672.44250.023519.61180.00651.13360.34829.11390.24462.16550.04818.45410.010181.22570.292111.48910.17551.2880.258612.09120.14720.75290.64497.57410.476191.67540.105418.06320.03441.18990.310512.85120.16950.85280.57139.98940.3513101.56240.130319.15150.03841.30820.237916.06860.09770.64110.77288.65450.5652TS11.47070.22761.50750.21951.52380.21951.56230.21130.00070.97950.00070.979121.04310.35562.17540.3371.35220.26272.82090.2440.83030.43951.75950.414931.59040.19565.06420.16720.93840.42472.98960.39323.75090.014112.22530.006741.23980.29835.36110.25221.10130.35974.76580.31223.22660.016714.39550.006151.55330.17958.55760.12810.82440.5354.54570.47382.3920.045513.71410.017562.29430.040315.47020.01690.67140.6734.53170.60512.34560.039916.61430.010872.6020.016420.89260.00390.99140.44197.97060.33522.42280.02820.64670.004381.18250.317311.08420.1972.190.034520.55910.00841.2890.264612.9680.11391.59480.127617.19420.04581.91680.058620.70130.0141.07910.390612.64090.1795101.30860.237516.04030.09851.64220.10720.17090.02770.87410.561811.79990.2987
Dew point temperature (T2MDEW) and wet-bulb temperature (T2MWET) showed significant results across several lags, with the most consistent significance observed during the second and third pandemic waves at lag 1 (with p-values <0.006). Surface temperature (TS) demonstrated significant results at lag 7 in the first wave, lag 8 in the second wave, and lag 3 in the third wave.
These findings highlight the significant association of air temperature, wet-bulb temperature, dew point temperature, and surface temperature with the spread of COVID-19 across the pandemic waves.
Comparison of proposed model with other modeling
4.4
The proposed model facilitates the utilization of available ECDs to better understand their complex associations with the occurrence patterns of infectious diseases. Table 7 shows a comparison of the proposed model with the other correlation analysis modeling.Table 7. Comparison of existing correlation analysis with the proposed approach for COVID-19 pandemic.Table 7S.No.Author, Reference No.Study Period-AreaNo. of ECDs used for AnalysisMethod UsedAssociated Parameters Identified1Xie and Zhu (2020), [22]Jan 23, 2020 to Feb 29, 2020 - The majority of the Chinese mainland3Spearman Correlation, Generalized additive modelNonlinear relationship between ambient temperature, positive linear relationship with mean temperature.2Kumar et al. (2020), [25]April 27 toJuly 25, 2020 - India4Spearman rank correlation,Artificial Neural NetworkTemperature, Wind Speed, Relative humidity and Pressure3Melo et al. (2020), [23]Dec 2019 to April 6, 2020 - USA5Vector Autoregressive (VAR) model, Granger causality testTemperature with the lag of seven days4Muktavat et al. (2021), [30]Jan 3, 2021 -May 15, 2021 - India4Kendall rank correlation and Spearman rank correlation tests at 95 % significancePositive correlation with temperature; Negative correlation with humidity and AQI5Jana et al.,(2023), [31]April 26, 2020 to July 10, 2021 - India3Bivariate spatial associationAerosol Optical Depth (AOD), O_3_, and NO_2_6Tyagi et al., (2024), [32]Apr 1, 2020 to November 12,2020 - India5Autoregressive distributed lag modelsPM2.5 and PM10 levels, temperature, humidity and wind speed7Balasubramani et al. (2024), [29]Wave I:April 2020 to Jan 2021Wave II: Feb 2021 to August 2021 - India4Negative Binomial Regression ModelWind speed in wave II, PM_2.5_ in wave I and wave II (for incidence and mortality), Rainfall (for mortality)Key indicators – wealth index (based on occurrence and death rate in wave I and wave II) and Literacy Rates in Wave II (for incidence and mortality) both wave I and II (for mortality), house hold density and overcrowded house hold (for incidence and mortality)8ProposedJan 3, 2020 to Oct 31, 2022 - India31Convergent Search – Add or Eliminate (CS-AE) AlgorithmDeterminant of Concern: Shortwave Downward Radiation (SDR)**Determinant of Interest:**EVI, Photosynthetically Active Radiation, Humidity, Soil Moisture, Surface Pressure, Temperatures, Longwave Downward Radiation, UVA radiation, UVB Radiation
When compared with the existing methodology, the proposed CS-AE algorithm analyzed the maximum number of ECDs and facilitated the categorization of ECDs of greater concern. This categorization highlights the importance of analysing ECDs in the occurrence patterns of infectious diseases. Classifying ECDs as DOC and DOI can provide a framework for developing Climate-Resilient Infectious Disease strategies, which serve as the foundational step for SPRS.
Sustainable pandemic response strategy (SPRS)
4.5
The development of SPRS is based on the identification of environmental risk factors, prioritizing key risk factors, integrating environmental insights and evaluating the impact. The proposed CS-AE algorithm helps development of standard operational framework for the sustainable pandemic management for the COVID-19 through categorization of the concern ECDs for an infectious disease. For COVID-19 occurrence, CS-AE algorithm gave following insights:
- 1.Shortwave Downward Radiation is identified as a DOC. Twenty ECDs have been categorized as DOIs.
- 2.Analysis of the insights from this identification have been made using Radar Chart Visualization, which helped illustration of the complex relationships between each ECD and the occurrence of COVID-19 in India. This also revealed three distinct spikes, corresponding to the three different waves of the pandemic in India
- 3.All correlation cannot be a causation, with the analysis of the cause and effect study using the Granger Causality Test. It is identified that for SDR, and interconnected components of Earth's climate systems shows a significant p value (p < 0.003).
Advantage and limitation of CS-AE algorithm
4.5.1
Hence, the CS-AE algorithm can contribute to the development of a SPRS by providing valuable insights into the relationship between COVID-19 occurrence in India and ECDs. This approach can also be applied to the study of other infectious disease occurrence patterns, provided that there are high-quality time series datasets available. The CS-AE algorithm is applicable only if the datasets are of high quality and contain time series data. Otherwise, it may lead to underfitting, overfitting, or erroneous identification.
Infectious disease control policy
4.5.2
Effective control of infectious diseases requires a collaborative approach involving public health, environmental, and weather monitoring departments. Earth Observation data can be utilized to study ECDs that may influence the occurrence patterns of infectious diseases. By integrating historical infectious disease data with real-time environmental monitoring, patterns can be identified to develop predictive models. Advanced approaches like the CS-AE algorithm can categorize ECDs as DOC and DOI, assessing their impact on various infectious diseases, thereby enabling targeted interventions. A centralized dashboard can be implemented to continuously monitor ECDs alongside past disease occurrences, providing an early warning system for potential outbreaks. This real-time surveillance allows authorities to anticipate pandemic waves, allocate resources efficiently, and implement timely precautionary measures. By leveraging environmental monitoring and predictive analytics, governments and public health officials can enhance preparedness, reduce disease transmission risks, and mitigate the impact of future outbreaks.
Conclusion
5
The proposed CS-AE algorithm has ability to categorize ECDs as Determinant of Interest (DOIs) and Determinants of Concern (DOCs) playing a crucial role in understanding the spread of infectious diseases such as COVID-19. Analysis of the correlation between these ECDs and COVID-19 occurrences help the CS-AE algorithm not only in highlighting the significant factors but also provides insights into the complex interdependencies within Earth's climate system.
One of the pivotal findings from the CS-AE algorithm with respect to COVID-19 spread is the identification of Shortwave Downward Radiation (SDR) as a DOC. SDR serves as a key determinant with strong influence on other ECDs, such as air temperature, surface temperature, vegetation index, humidity etc., It plays a significant role in shaping atmospheric dynamics, and its interaction with these climate components creates intricate feedback loops. Changes in SDR can trigger ripple effects across these interconnected climate elements, with significant interpret on the spread of COVID-19. This confirms the vital role of temperature dynamics, including air, wet, dew, and surface temperature, in the occurrence patterns of infectious diseases.
Performance of Granger Causality test was done for the identification of the causation behind the correlation. It showed SDR Granger-causes COVID-19 spread at lags of 6 and 7 days, while the later waves showed a shorter lag of 3 days. Hence the proposed CS-AE algorithm proved to be a powerful tool for identification and the analysis of the interplay between climate determinants and infectious disease occurrences. Its application can help provision of crucial insights for the management of current and future pandemics through integration of environmental risk factors into disease control policies. However, it is important to note that, high-quality time series datasets are crucial to ensure effectiveness for this methodology. In the absence of such datasets, issues like underfitting or overfitting could compromise the validity of the results.
In conclusion, the traditional statistical correlation based on multivariate correlation analysis, identified air temperature as an indirect association with the COVID-19 spread. However, the proposed CS-AE statistical-based evolutionary algorithm revealed, SDR as a more significant determinant compared to other determinants. Also, SDR is shown as significant in altering other ECDs. This indicates the proposed approach as, uncovering detailed interactions with the offer of deeper insights into the investigation of ECDs in relation to infectious diseases. It suggests monitoring SDR for disease transmission patterns especially during outbreak/pandemic could indeed help in framing more effective public health policies. More targeted and effective strategies can be developed for mitigation of the infectious diseases, both now and in the future with the use of the CS-AE algorithm.
CRediT authorship contribution statement
Jaraline Kirubavathy K: Writing – review & editing, Writing – original draft, Visualization, Validation, Software, Resources, Project administration, Methodology, Investigation, Formal analysis, Data curation, Conceptualization. Thulasi Bai V: Writing – review & editing, Validation, Supervision, Project administration, Conceptualization.
Declaration of generative AI and AI-assisted technologies in the writing process
During the preparation of this work, the author(s) used ChatGPT to refine language and improve readability. After using this tool, the authors reviewed and edited the content as needed and takes full responsibility for the content of the published article.
Declaration of competing interest
The authors have no relevant financial or non-financial interests to disclose.
The reference list from the paper itself. Each links out to its DOI / PubMed record.
- 1Goyal R.Gautam R.K.Chopra H.Dubey A.K.Singla R.K.Rayan R.A.Kamal M.A.Comparative highlights on MERS-Co V, SARS-Co V-1, SARS-Co V-2, and NEO-Co VEXCLI J.2120221245127210.17179/excli 2022-535536483910 PMC 9727256 · doi ↗ · pubmed ↗
- 2Wei T.Liu C.Dong W.Yu H.Yang S.Yan Q.Hao Z.Reduction in extreme climate events and potential impacts by the use of technological advances Int. J. Climatol.4120202495250810.1002/joc.6971 · doi ↗
- 3Selcuk M.Gormus S.Guven M.Impact of weather parameters and population density on the COVID-19 transmission: evidence from 81 provinces of Turkey Earth Syst. Environ.520218710010.1007/s 41748-020-00197-z 34723077 PMC 7803664 · doi ↗ · pubmed ↗
- 4Wei M.Li S.Lu X.Hu K.Li Z.Li M.Changing respiratory pathogens infection patterns after COVID-19 pandemic in Shanghai, China J. Med. Virol.9642024 e 2961610.1002/jmv.2961638634514 · doi ↗ · pubmed ↗
- 5Blanco-Melo D.Nilsson-Payant B.E.Liu W.C.Uhl S.Hoagland D.Møller R.Jordan T.X.Oishi K.Panis M.Sachs D.Wang T.T.Schwartz R.E.Lim J.K.Albrecht R.A.ten Oever B.R.Imbalanced host response to SARS-Co V-2 drives development of COVID-19Cell 1815202010.1016/j.cell.2020.04.0261036–1045.e 9PMC 722758632416070 · doi ↗ · pubmed ↗
- 6White R.Razgour O.Emerging zoonotic diseases originating in mammals: A systematic review of effects of anthropogenic land-use change Mammal Rev.50202033635210.1111/mam.12201 PMC 730089732836691 · doi ↗ · pubmed ↗
- 7Guégan J.Ayouba A.Cappelle J.De Thoisy B.Forests and emerging infectious diseases: unleashing the beast within Environ. Res. Lett.202010.1088/1748-9326/AB 8DD 7 · doi ↗
- 8Gibb R.Ryan S.Pigott D.Del Pilar Fernandez M.Muylaert R.Albery G.Becker D.Blackburn J.Caceres-Escobar H.Celone M.Eskew E.Frank H.Han B.Hulland E.Jones K.Katz R.Kucharski A.Limmathurotsakul D.Lippi C.Longbottom J.Martinez J.Messina J.Nsoesie E.Redding D.Romero-Alvarez D.Schmid B.Seifert S.Sinchi A.Trisos C.Wille M.Carlson C.The anthropogenic fingerprint on emerging infectious diseasesbio Rxiv 202410.1101/2024.05.22.24307684 · doi ↗