State-Level Tax Policy, Cancer Screening, and Mortality Rates in the US
Odysseas P. Chatzipanagiotou, Mujtaba Khalil, Usama Waqar, Selamawit Woldesenbet, Giovanni Catalano, Timothy M. Pawlik

TL;DR
Higher state tax revenue is linked to better cancer screening and lower cancer deaths in the US, especially for White populations.
Contribution
This study identifies state-level tax policy as a novel social determinant influencing cancer screening and mortality rates.
Findings
Increased tax revenue per capita was associated with higher screening rates for colorectal, breast, and cervical cancers.
Higher tax revenue was linked to lower cancer mortality rates among White populations but not among racial and ethnic minorities.
Tax progressivity showed a weaker or inconsistent association compared to overall tax revenue.
Abstract
This cross-sectional study assesses associations of state-level tax revenue and tax progressivity with state-level cancer screening and mortality in the US. Are state-level tax revenue and tax progressivity associated with cancer screening and cancer mortality rates in the US? This cross-sectional study of 1150 state-years consisting of tax revenue data for 23 years (1997-2019) and 50 states found that increased tax income was associated with increased cancer screening rates, as well as decreased cancer mortality rates; this association was more prominent among White than racial and ethnic minority populations. These findings suggest that state-level tax revenue may serve as one aspect of a multifaceted approach to improve cancer-related outcomes in the US and help bridge cancer care gaps, particularly in more progressive tax policy settings. The Healthy People 2030 initiative has…
Genes, proteins, chemicals, diseases, species, mutations and cell lines named across the full text — each resolved to its canonical identifier and authoritative record.
Click any figure to enlarge with its caption.
 Figure
| State | Tax revenue per capita, median (IQR), $ (thousands) | Suits index, mean (SD) | Colorectal, breast, and cervical screening rate, median (IQR), % | Death count, mean (SD) | Age-adjusted cancer mortality rate, mean (SD) per 100 000 population |
|---|---|---|---|---|---|
| Alabama | 3.3 (3.0-3.5) | −1.62 (0.24) | 74.1 (71.8-78.7) | 10 129 (297) | 188.9 (18.2) |
| Alaska | 5.2 (4.7-9.4) | −1.41 (0.42) | 63.1 (61.7-71.1) | 873 (132) | 174.1 (18.1) |
| Arizona | 3.8 (3.7-3.9) | −1.48 (0.22) | 63.8 (62.4-71.4) | 10 742 (1230) | 154.3 (14.5) |
| Arkansas | 3.9 (3.3-4.0) | −1.12 (0.21) | 68.9 (67.0-74.8) | 6416 (188) | 192.7 (15.2) |
| California | 5.5 (4.9-6.0) | −0.04 (0.46) | 70.5 (67.7-76.2) | 56 564 (2499) | 156.5 (16.8) |
| Colorado | 4.5 (4.3-4.7) | −1.15 (0.30) | 67.1 (66.1-74.9) | 7034 (737) | 149.4 (15.5) |
| Connecticut | 7.1 (6.4-7.8) | −1.26 (0.34) | 77.2 (76.2-81.7) | 6829 (231) | 161.3 (19.2) |
| Delaware | 4.9 (4.7-5.1) | −0.17 (0.31) | 76.3 (73.8-80.0) | 1904 (163) | 182.7 (21.0) |
| Florida | 3.8 (3.7-4.1) | −2.69 (0.24) | 71.3 (70.0-76.0) | 42 012 (2549) | 164.0 (16.7) |
| Georgia | 3.9 (3.7-4.0) | −1.08 (0.26) | 73.1 (69.4-77.5) | 15 616 (1531) | 176.8 (18.3) |
| Hawaii | 5.8 (4.8-6.2) | −1.06 (0.21) | 76.3 (73.4-79.2) | 2261 (195) | 139.7 (12.2) |
| Idaho | 3.5 (3.4-3.8) | −0.50 (0.15) | 64.7 (64.3-72.0) | 2572 (332) | 161.0 (13.6) |
| Illinois | 5.1 (4.6-6.0) | −1.49 (0.31) | 71.5 (69.3-76.4) | 24 342 (401) | 179.2 (19.4) |
| Indiana | 4.1 (3.8-4.2) | −1.25 (0.14) | 69.0 (67.8-75.6) | 13 180 (354) | 188.7 (16.6) |
| Iowa | 4.5 (4.0-4.9) | −0.84 (0.13) | 73.4 (71.8-78.2) | 6406 (77) | 171.5 (13.4) |
| Kansas | 4.7 (4.2-4.9) | −1.03 (0.36) | 69.0 (66.6-75.5) | 5427 (110) | 172.2 (12.9) |
| Kentucky | 3.8 (3.6-3.9) | −0.91 (0.11) | 69.1 (68.8-75.1) | 9768 (421) | 205.2 (16.6) |
| Louisiana | 4.1 (3.7-4.5) | −1.34 (0.21) | 74.5 (70.6-78.5) | 9298 (204) | 196.9 (21.7) |
| Maine | 5.2 (4.9-5.3) | −0.38 (0.22) | 74.4 (74.3-79.6) | 3214 (124) | 185.6 (18.5) |
| Maryland | 5.6 (5.1-6.0) | −0.68 (0.29) | 74.2 (72.5-79.4) | 10 477 (244) | 173.6 (22.5) |
| Massachusetts | 6.0 (5.4-6.4) | −1.14 (0.25) | 79.0 (77.3-82.1) | 13 088 (470) | 170.5 (23.2) |
| Michigan | 4.3 (4.2-4.5) | −1.00 (0.26) | 73.4 (72.7-78.5) | 20 395 (511) | 180.3 (15.2) |
| Minnesota | 5.4 (5.1-6.2) | −0.53 (0.36) | 74.8 (73.6-79.0) | 9487 (397) | 163.7 (15.8) |
| Mississippi | 3.5 (3.2-3.8) | −1.17 (0.15) | 68.3 (66.7-75.8) | 6294 (240) | 200.7 (14.3) |
| Missouri | 3.8 (3.7-3.9) | −0.89 (0.15) | 68.5 (67.4-74.7) | 12 642 (307) | 185.2 (15.4) |
| Montana | 3.9 (3.4-4.2) | −0.42 (0.17) | 68.0 (66.3-75.0) | 1983 (102) | 166.1 (18.3) |
| Nebraska | 4.9 (4.4-5.2) | −0.79 (0.24) | 68.3 (67.2-75.0) | 3437 (74) | 167.0 (13.0) |
| Nevada | 4.4 (4.2-4.7) | −2.39 (0.30) | 65.2 (64.4-73.3) | 4585 (573) | 176.4 (20.5) |
| New Hampshire | 4.4 (4.0-4.8) | −1.73 (0.20) | 72.9 (72.7-78.8) | 2630 (141) | 174.1 (20.1) |
| New Jersey | 6.8 (5.7-7.2) | −0.46 (0.35) | 74.1 (70.7-78.9) | 16 820 (814) | 168.1 (25.1) |
| New Mexico | 4.0 (3.7-4.2) | −1.16 (0.22) | 63.2 (62.1-71.5) | 3330 (278) | 152.6 (13.5) |
| New York | 8.4 (6.6-9.1) | −0.74 (0.35) | 75.2 (73.3-79.9) | 35 420 (1202) | 160.6 (21.0) |
| North Carolina | 4.0 (3.8-4.2) | −0.76 (0.15) | 74.1 (72.3-79.1) | 17 992 (1500) | 178.9 (17.1) |
| North Dakota | 5.7 (3.9-7.8) | −1.36 (0.26) | 73.1 (69.7-77.7) | 1307 (42) | 159.9 (16.4) |
| Ohio | 4.5 (4.4-4.8) | −0.91 (0.14) | 71.8 (69.5-77.2) | 25 130 (224) | 187.3 (16.8) |
| Oklahoma | 3.6 (3.5-3.9) | −1.28 (0.17) | 67.3 (63.9-73.6) | 7829 (391) | 190.9 (10.4) |
| Oregon | 4.1 (3.8-4.4) | −0.33 (0.21) | 70.8 (70.5-77.0) | 7649 (461) | 173.3 (16.7) |
| Pennsylvania | 4.9 (4.3-5.1) | −1.42 (0.20) | 72.0 (71.9-77.2) | 28 963 (750) | 179.6 (18.3) |
| Rhode Island | 5.4 (4.8-5.6) | −0.78 (0.28) | 79.1 (77.8-82.7) | 2258 (108) | 173.6 (20.8) |
| South Carolina | 3.5 (3.3-3.6) | −0.59 (0.17) | 75.1 (72.9-79.0) | 9378 (872) | 183.9 (18.1) |
| South Dakota | 3.7 (3.4-3.9) | −2.34 (0.13) | 73.5 (70.7-78.4) | 1633 (64) | 169.2 (13.9) |
| Tennessee | 3.4 (3.2-3.5) | −2.16 (0.08) | 70.2 (69.0-76.0) | 13 458 (810) | 193.4 (17.1) |
| Texas | 4.0 (3.8-4.3) | −2.09 (0.12) | 68.8 (65.2-73.9) | 37 114 (3143) | 167.3 (17.8) |
| Utah | 3.8 (3.6-4.1) | −0.95 (0.35) | 68.2 (67.4-73.9) | 2800 (377) | 132.7 (10.5) |
| Vermont | 5.5 (4.5-5.9) | −0.30 (0.30) | 72.4 (71.1-78.0) | 1315 (80) | 172.8 (15.9) |
| Virginia | 4.6 (4.3-4.9) | −0.83 (0.19) | 74.6 (72.1-79.3) | 14 312 (711) | 174.8 (20.3) |
| Washington | 4.8 (4.5-5.1) | −2.55 (0.13) | 68.8 (68.0-74.8) | 11 837 (844) | 169.6 (18.0) |
| West Virginia | 4.1 (3.6-4.2) | −0.54 (0.13) | 71.6 (69.9-76.9) | 4704 (78) | 198.5 (14.7) |
| Wisconsin | 5.0 (4.8-5.1) | −0.74 (0.18) | 72.6 (69.6-77.8) | 11 154 (324) | 171.2 (15.1) |
| Wyoming | 5.8 (5.0-7.0) | −2.54 (0.38) | 63.9 (62.4-72.8) | 945 (65) | 162.1 (18.4) |
| Model | Change in colorectal cancer screening, % (95% CI) | Change in breast cancer screening, % (95% CI) | Change in cervical cancer screening, % (95% CI) | |||
|---|---|---|---|---|---|---|
| Univariable | ||||||
| Tax revenue per capita | 1.95 (0.96 to 2.95) | <.001 | 1.76 (0.98 to 2.53) | <.001 | 0.68 (0.35 to 1.01) | <.001 |
| Tax progressivity | 2.73 (0.63 to 4.87) | .01 | 2.48 (0.65 to 4.35) | .008 | 1.04 (0.42 to 1.67) | .001 |
| Multivariable | ||||||
| Tax revenue per capita | 1.61 (0.50 to 2.73) | .004 | 2.17 (1.39 to 2.96) | <.001 | 0.72 (0.34 to 1.10) | <.001 |
| Tax progressivity | 0.61 (−1.80 to 3.08) | .62 | 1.46 (−0.15 to 3.08) | .08 | 0.56 (−0.16 to 1.28) | .13 |
| Model | Cancer mortality | |||||
|---|---|---|---|---|---|---|
| All, aIRR (95% CI) | White, aIRR (95% CI) | Racial and ethnic minority, aIRR (95% CI) | ||||
| Univariable | ||||||
| Tax revenue per capita | 0.96 (0.95-0.98) | <.001 | 0.97 (0.96-0.98) | <.001 | 1.00 (0.97-1.02) | .77 |
| Federal transfer revenue per capita | 0.96 (0.93-0.98) | .001 | 0.97 (0.95-0.99) | .005 | 0.98 (0.95-1.02) | .37 |
| Other revenue per capita | 1.00 (0.99-1.00) | .11 | 1.00 (0.99-1.00) | .01 | 1.00 (0.99-1.01) | .99 |
| Health spending per capita | 0.97 (0.93-1.00) | .07 | 0.97 (0.95-1.00) | .02 | 1.01 (0.95-1.06) | .85 |
| Non-Hispanic Black population | 1.00 (0.99-1.00) | .70 | 1.00 (0.99-1.00) | .48 | 1.00 (1.00-1.00) | .86 |
| High school graduation rate | 0.99 (0.99-1.00) | .006 | 1.00 (0.99-1.00) | .04 | 0.99 (0.99-1.00) | .001 |
| Medicaid expansion | 0.96 (0.92-0.99) | .009 | 0.97 (0.95-1.00) | .07 | 0.97 (0.92-1.02) | .21 |
| Multivariable | ||||||
| Tax revenue per capita | 0.98 (0.95-0.98) | <.001 | 0.97 (0.95-0.98) | <.001 | 0.99 (0.98-1.02) | .87 |
| Model | Cancer mortality | |||||
|---|---|---|---|---|---|---|
| All, aIRR (95% CI) | White, aIRR (95% CI) | Racial and ethnic minority, aIRR (95% CI) | ||||
| Univariable | ||||||
| Tax revenue per capita | 0.90 (0.87-0.94) | <.001 | 0.90 (0.87-0.94) | <.001 | 0.98 (0.88-1.10) | .54 |
| Federal transfer revenue per capita | 0.85 (0.81-0.89) | <.001 | 0.85 (0.81-0.89) | <.001 | 0.94 (0.90-0.98) | .008 |
| Other revenue per capita | 0.99 (0.99-0.99) | <.001 | 0.98 (0.97-0.99) | <.001 | 0.91 (0.78-1.07) | .28 |
| Health spending per capita | 0.89 (0.81-0.97) | .006 | 0.89 (0.82-0.96) | .002 | 0.97 (0.87-1.07) | .49 |
| Non-Hispanic Black population | 0.99 (0.99-0.99) | .001 | 1.00 (1.00-1.00) | .16 | 0.99 (0.99-1.00) | .001 |
| High school graduation rate | 0.97 (0.97-0.98) | .001 | 0.97 (0.96-0.98) | <.001 | 0.99 (0.98-0.99) | .001 |
| Medicaid expansion | 0.94 (0.90-0.99) | .02 | 0.95 (0.90-1.00) | .03 | 0.99 (0.95-1.03) | .53 |
| Multivariable | ||||||
| Tax revenue per capita | 0.96 (0.94-0.98) | .001 | 0.95 (0.93-0.98) | <.001 | 0.99 (0.97-1.02) | .50 |
Peer Reviews
No public reviews on file for this paper yet. If you reviewed it on a platform where reviews are public (OpenReview, ICLR, NeurIPS, ICML), you can paste yours below so the community can read it here.
Videos
No videos yet. Explain this paper in a talk, walkthrough, or lecture? Add one.
Taxonomy
TopicsGlobal Cancer Incidence and Screening · Healthcare Policy and Management · Economic and Financial Impacts of Cancer
Introduction
The Healthy People 2030 initiative set goals of implementing cancer screening and prevention programs, as well as elevating the level of care and improving survivorship among patients with cancer.^1,2^ Target population goals were set at 68.3% for colorectal cancer screening, 80.3% for breast cancer screening, and 79.2% for cervical cancer screening.^3,4,5^ Regarding overall cancer mortality, the aim is to reduce the baseline 149.1 cancer deaths per 100 000 population by approximately 30 deaths per 100 000 until the year 2030.^1^ Even though the number of cancer-related deaths has been declining in recent years, cancer persists as the second leading cause of death in the US, resulting in more than 600 000 deaths every year.^2,6,7^ Importantly, disparities persist despite screening initiatives, earlier diagnoses, and improved treatment options, especially among disadvantaged populations in underserved areas that consistently experience higher cancer incidence, lower screening rates, decreased odds of receiving guideline-appropriate treatment, and higher cancer death rates.^1,8^
Various social determinants of health (SDoH), including socioeconomic privilege, racial segregation, redlining, and food insecurity impact cancer screening and mortality.^9,10,11,12,13,14^ In theory, state-level tax policy can be considered an upstream SDoH because the generation of tax revenue and the redistribution of wealth through progressive tax policies may help mitigate socioeconomic and health care disparities.^15^ Of note, progressive taxes are designed to burden wealthier individuals more than less wealthy populations, which is opposite to regressive taxation.^15,16,17^ Previous studies assessing the impact of tax policy on health outcomes have focused on how the earned income tax credit and sin taxes on tobacco or alcohol have promoted health-related outcomes.^18,19^ However, few studies have considered the entire tax system as an SDoH. Specifically, a recent study by Junior et al^15^ assessed the association of state-level tax policy with infant mortality rates across the US, demonstrating the impact that tax policy had on this important indicator of population health.
According to the National Cancer Institute, screening and mortality rates are measures that reflect cancer health disparities.^8^ Nonetheless, the impact of state-level tax policy on cancer screening and mortality rates remains ill-defined. Therefore, the objective of the current study was to assess how state-level tax policy, including tax revenue and tax progressivity may be associated with cancer screening and mortality rates. We hypothesized that increased tax revenue and more progressive tax policies would be associated with higher screening rates and lower mortality rates.
Methods
Study Design and Data Sources
This population-based, state-level, cross-sectional study was deemed exempt from institutional review board approval and the requirement of informed consent by The Ohio State University because data were derived from publicly available data sources and analyzed at the state level without individual information. The study followed the Strengthening the Reporting of Observational Studies in Epidemiology (STROBE) reporting guideline.^20^ We utilized data from the US Census Bureau Annual Survey of State and Local Government Finances and the Institute on Taxation and Economic Policy (ITEP) to calculate state-level tax revenue and tax progressivity.^15,16,17,21,22,23,24,25^ The unit of analysis was the state-year, which represented the combination of a specific year and state for each outcome of interest (eFigure 1 in Supplement 1). Covariates included in the analysis were queried from the US Census Bureau and the Bureau of Economic Analysis.^26,27^ Tax policy data were made available upon request by Junior et al.^15^ Cancer mortality data from 1999 to 2021 were derived from the Centers for Disease Control and Prevention (CDC) Wide-Ranging Online Data for Epidemiologic Research (WONDER) database.^28^ Moreover, cancer screening rates for the years 2020 and 2022 were derived from the CDC Population Level Analysis and Community Estimates (PLACES) database, which includes model-based predictions for 29 health-related outcomes and behaviors at various geographic levels in the US (eMethods in Supplement 1).^9,29^ In the current study, county-level data were aggregated at the state level.
Primary Exposure and Outcomes of Interest
The primary exposure was state-level tax policy, proxied by tax revenue per capita and the Suits index of tax progressivity, with higher progressivity representing increased taxation among wealthier individuals.^15,17^ Tax revenue per state was calculated as the sum of all revenue at the state and local level defined as taxes by the US Census Bureau.^30^ Local-level revenue collected by counties, cities, townships, special districts, and independent school districts or educational service agencies was aggregated at the state level. Five editions of tax progressivity data had been published by the ITEP within the study period, namely for 2002, 2009, 2012, 2014, and 2018, evaluating policies on income, property, and general sales taxes.^15,16,21,22,23,24,25^ The Suits index for tax progressivity was calculated based on previously established methods at the state level using ITEP data.^31,32^ The Suits index ranges from −1, corresponding to the most regressive tax policy, to 1, for the most progressive tax policy, and has been previously used to measure tax progressivity. For ease of interpretation, the Suits index was multiplied by a factor of 10 when reported in the current study, thus ranging between −10 and 10.^15,33,34^
The primary outcomes of interest included: (1) age-adjusted (2020 standard US population), state-level breast, colorectal, and cervical cancer screening rates; (2) state-level cancer mortality rates; and (3) state-level cancer mortality rates among cancers with guideline-recommended screening (ie, breast, cervical, and colorectal malignant neoplasms). Secondary outcomes included state-level cancer mortality for (1) White and (2) racial or ethnic minority only (ie, American Indian or Alaska Native, Asian or Pacific Islander, and Black or African American) populations.
Covariates
The covariates included in the model were selected based on the methodology used previously when evaluating the association of tax policy as an SDoH with public health indicators. Covariates included federal transfer revenue per capita, other revenue per capita, health spending per capita, gross domestic product per capita, percentage of Hispanic population, percentage of non-Hispanic Black population, percentage of population aged 25 years or older with a high-school degree, as well as an interaction term between Medicaid expansion (ME) status (ME vs non-ME states) and a binary time variable related to the pre-ME and post-ME time periods that approximated a difference-in-difference term (eMethods in Supplement 1).^15,35,36^ The US Department of Commerce price indexes were used to adjust for inflation all government revenue and median household income data (2020 US dollars).^27^
Statistical Analysis
The intraclass correlation and variance partition coefficient was 0.73 for colorectal cancer screening, 0.83 for breast cancer screening, 0.59 for cervical cancer screening, and 0.91 for cancer mortality outcomes, indicating that most of the variance was due to between-state rather than within-state differences. Generalized estimating equation (GEE) models were employed to account for clustering.^37^ The specific distribution and correlation structure were chosen based on the outcomes’ distributions and lower quasi-likelihood under the independence model criterion values among potential models (eMethods, eTable 1, and eFigure 2 in Supplement 1). Univariable and multivariable models were used to assess the association of the tax policy components—tax revenue and tax progressivity—and state-level cancer screening and cancer mortality. Results were reported as percentage estimates and incidence rate ratios (IRRs) with 95% CIs. The main analysis incorporated a 2-year lag representing the time required for the implementation and observed effects of tax policies (eMethods in Supplement 1).^15,38^ Multivariable models were adjusted for relevant economic and demographic variables, as well as a dummy variable for the year corresponding to the reported outcome. A Pearson correlation matrix was used to assess the associations among variables with a variance inflation factor threshold set at 5 (eFigure 3 in Supplement 1). A subanalysis was conducted using only state-years with available ITEP tax progressivity data, and sensitivity analyses were performed to assess different lag times, as well as state fixed effects (eTable 2 and eTable 3 in Supplement 1). Secondary analyses employed similar GEE models for cancer mortality, focusing on race- and ethnicity-specific cancer mortality rates. All tests were 2-tailed, and a P value of .05 was deemed significant. All statistical analyses were performed using R version 4.4.1 (R Foundation for Statistical Computing) and Python version 3.12.5 (Python Software Foundation)^39^ from September to January 2024.
Results
Descriptive Statistics
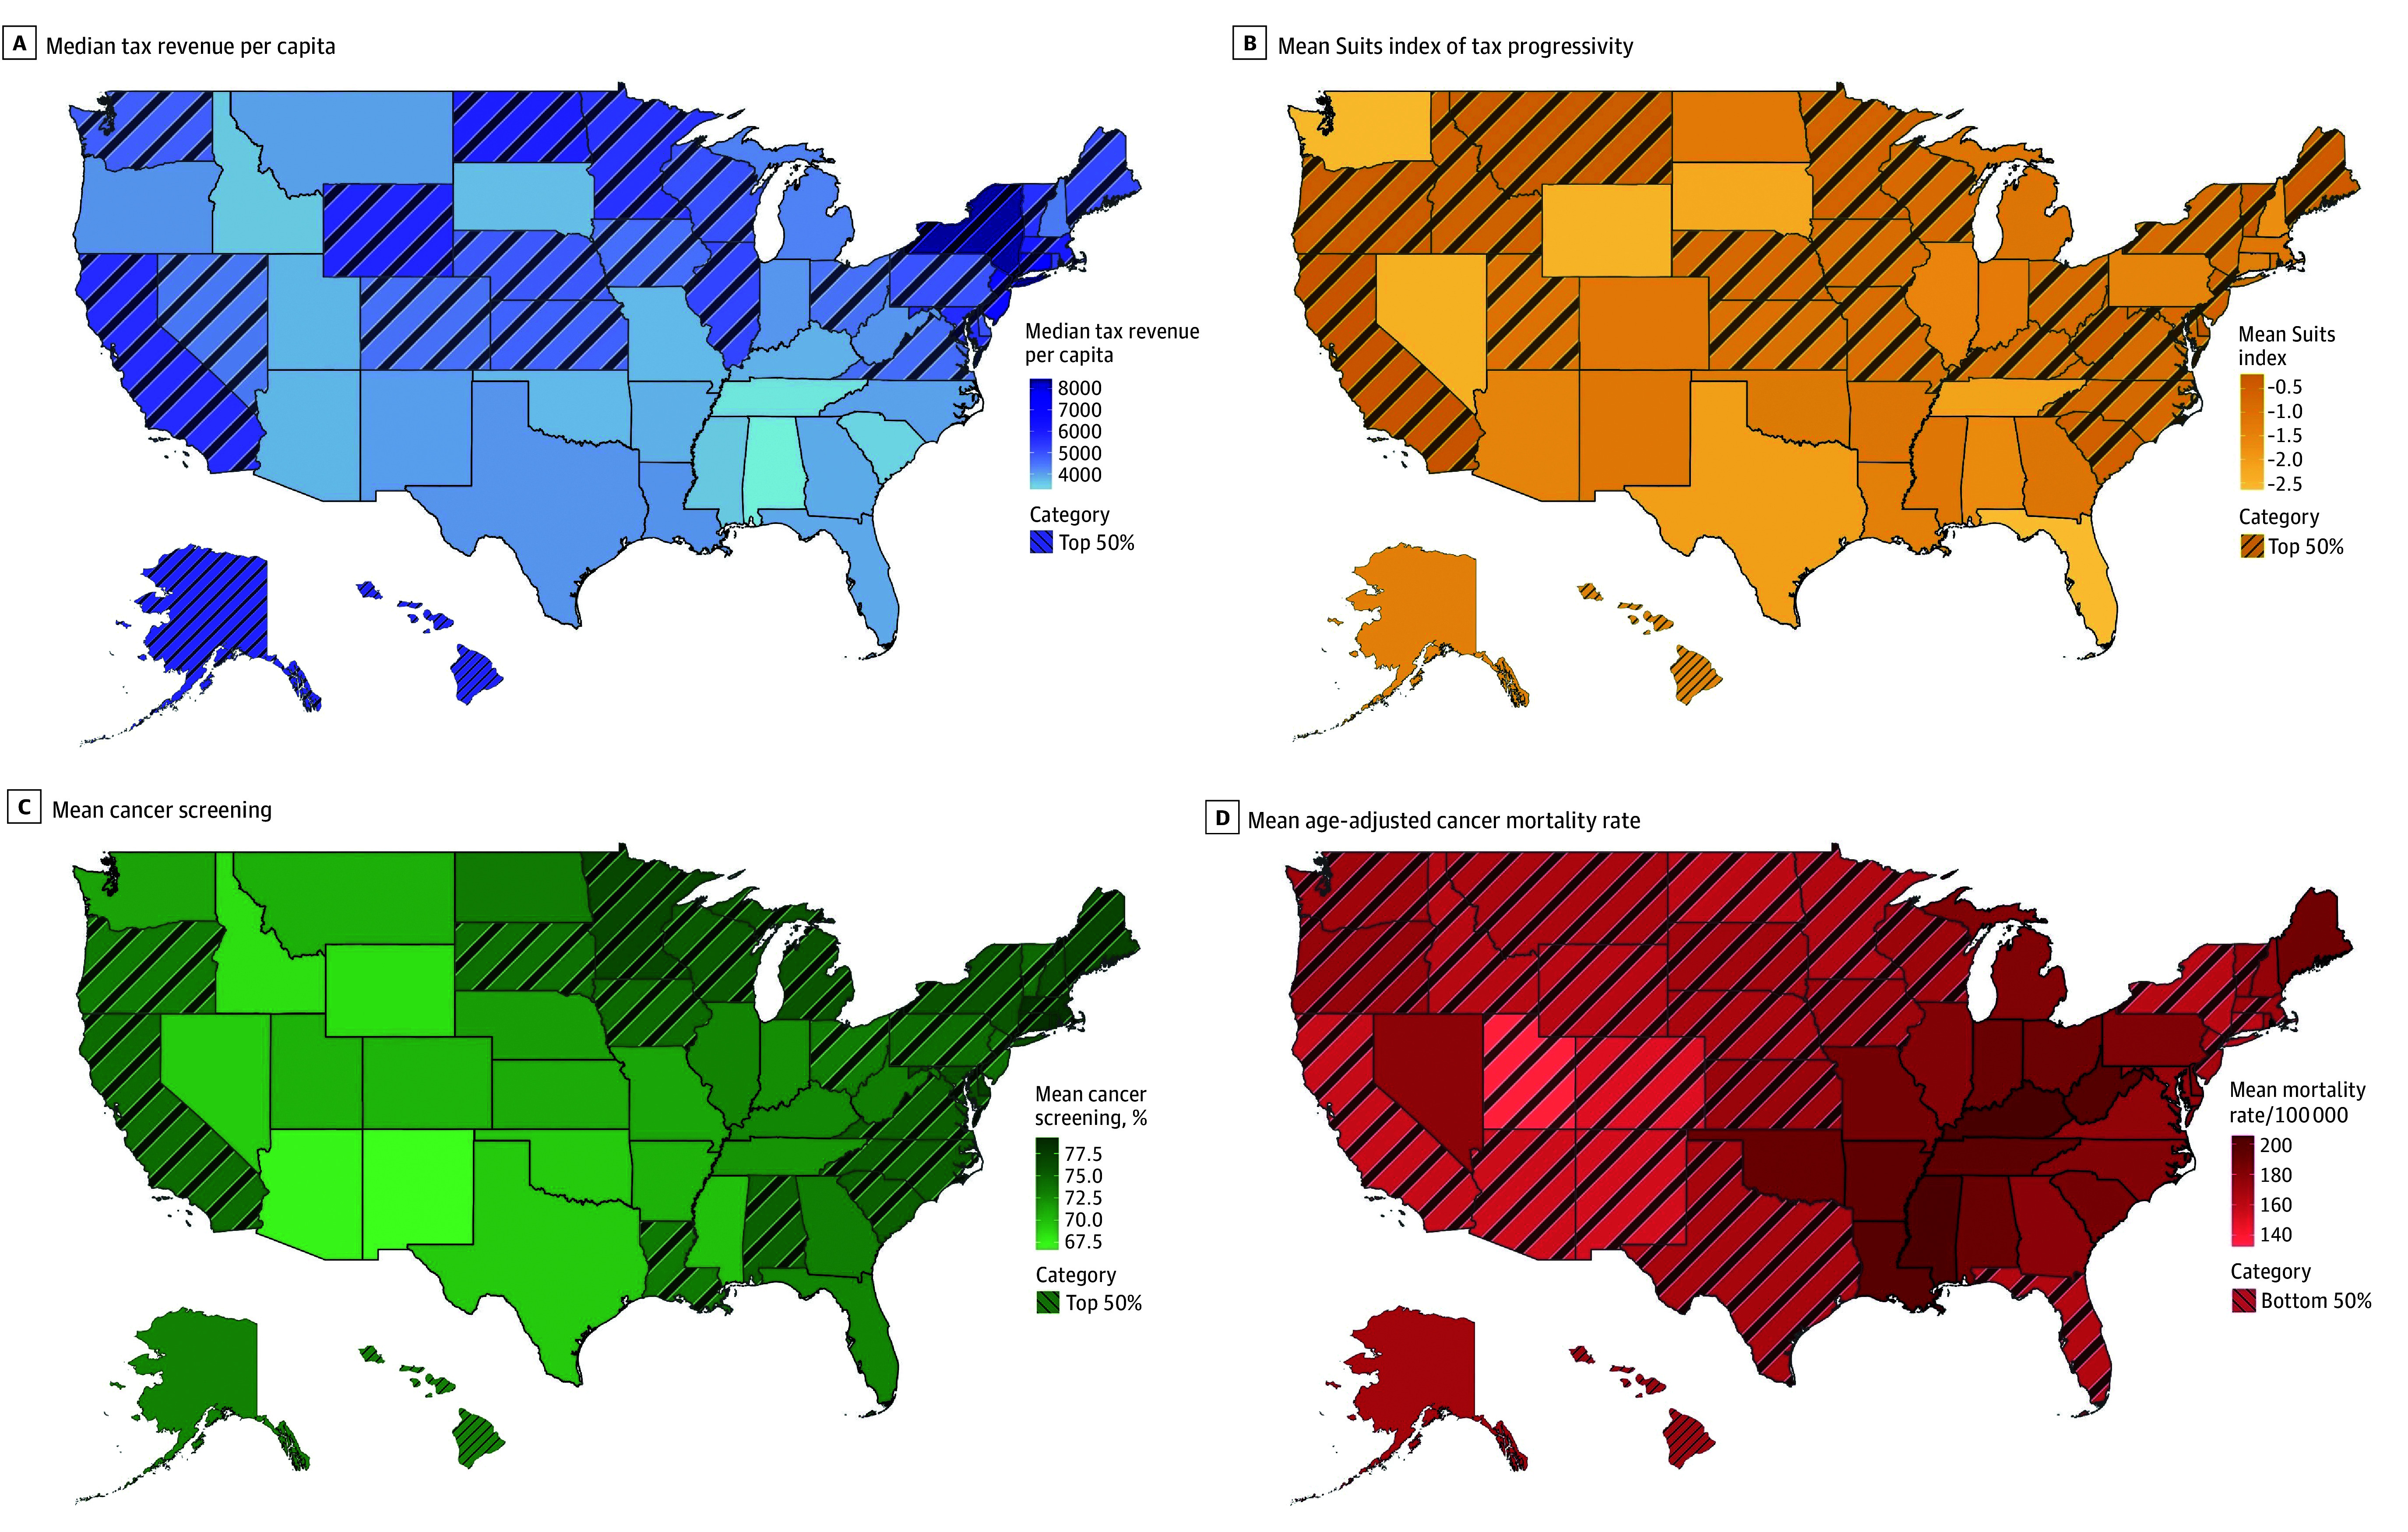
Overall, 1150 state-years consisting of tax revenue data for 23 years (1997-2019) and 50 states were included in the analysis (Figure, A-B). Among screening rates (100 state-years) for the years 2020 and 2022, the highest and mean (SD) prevalence of colon cancer screening was reported in Rhode Island (76.6% [4.7%]), while the lowest was reported in Alaska (60.3% [6.5%]). The highest mean (SD) prevalence for breast cancer screening was reported in Rhode Island (79.1% [2.4%]), with the lowest being in Alaska (63.1% [2.9%]); cervical cancer screening was most prevalent in Rhode Island (mean [SD] prevalence, 86.4% [1.0%]) and least prevalent in Arizona (mean [SD] prevalence, 79.0% [2.8%]). Of note, across the US in 2020, the median (IQR) prevalence was 64.8% (62.2%-67.2%) for colon cancer screening, 71.6% (68.8%-74.5%) for breast cancer screening, and 83.5% (82.5%-84.5%) for cervical cancer screening, while in 2022, the median (IQR) prevalence was 71.5% (68.8%-74.6%) for colon cancer screening, 71.2% (67.9%-73.7%) for breast cancer screening, and 81.4% (79.9%-82.5%) for cervical cancer screening (Figure, C).
Choropleth Maps of the US Illustrating State-Level VariabilityThe figure shows variability in median tax revenue per capita (1997-2019; A), mean Suits index of tax progressivity (2002, 2009, 2012, 2014, and 2018) multiplied by a factor of 10 for ease of interpretation (B), mean cancer screening percentage (2021) for breast, cervical, and colorectal cancer (C), and mean age-adjusted cancer mortality rate (1999-2021; D). States in the top 50% for median tax revenue per capita, mean Suits index of tax progressivity, and mean cancer screening percentage, as well as those in the bottom 50% for mean age-adjusted cancer mortality rate, are indicated with diagonal lines.
Across all 1150 state-years with tax revenue data, there was a total of 13 223 914 cancer-related deaths (median [IQR], 8341 [3150-13 585] cancer-related deaths) and an overall age-adjusted cancer mortality rate of 173.6 deaths per 100 000 population (Figure, D). The highest and lowest age-adjusted cancer mortality rates were 230.6 and 119.4 deaths per 100 000 population in Louisiana (1999) and Utah (2021), respectively. Kentucky was the state with the highest mean (SD) age-adjusted mortality rate, with 205.2 (16.2) deaths per 100 000 population, while Utah demonstrated the lowest mean (SD) age-adjusted mortality rate, with 132.7 (10.7) deaths per 100 000 population (Table 1). By race and ethnicity, the mean (SD) age-adjusted cancer mortality was 205.7 (39.8) per 100 000 non-Hispanic Black population, 174.9 (20.3) per 100 000 non-Hispanic White population, and 107.2 (32.2) per 100 000 Hispanic population.
Over 23 years and across 50 states, the median (IQR) tax revenue per capita was 3862-17 240), and the lowest in Alabama in 1998 (4449 (5351) and the mean (SD) Suits index was −1.12 (0.68). Interestingly, the vast majority of state-years (244 state-years [97.6%]) had regressive taxes, while the 5-year mean Suits index was negative in all US states (Table 1). Of note, only California in 2012, 2014, and 2018 as well as Delaware, Minnesota, and Vermont in 2018 had progressive tax policies according to the Suits index of tax progressivity.
Tax Policy and Cancer Screening
Regarding the association of tax policies with screening rates with a 2-year lag, univariable analysis found that each 1000 increase in tax revenue per capita was associated with a 1.61% (95%CI, 0.50%-2.73%) increase in prevalence of colorectal cancer screening, a 2.17% (95% CI, 1.39%-2.96%) increase in prevalence of breast cancer screening, and a 0.72% (95% CI, 0.34%-1.10%) increase in prevalence of cervical cancer screening (Table 2).
Tax Policy and Cancer Mortality
Among the entire 1150 state-years, univariable GEE analysis demonstrated an association of tax revenue per capita with cancer mortality (IRR, 0.96; 95% CI, 0.95-0.98). After adjusting for relevant tax-related and demographic variables, each 1000 increase in tax revenue remained associated with a 3% decrease in mortality rate among all cancers (aIRR, 0.97; 95% CI, 0.96-0.99), in addition to a 3% decrease in cancer mortality rate among White populations (aIRR, 0.97; 95% CI, 0.96-0.99), while there was no association with cancer mortality among minority populations (eTable 4 in Supplement 1).
Specifically, among cancers with guideline-recommended screening, each 1000 increase in tax-revenue per capita was associated with a 5% decrease in mortality among White populations (aIRR, 0.95; 95% CI, 0.93-0.98). In contrast, there was no association of tax revenue per capita with cancer mortality among racial and ethnic minority populations (aIRR, 0.99; 95% CI, 0.97-1.02) (Table 4). For some state-years, cancer mortality data for racial and ethnic minority populations were missing because deaths counts were suppressed for state-years reporting fewer than 16 deaths.
Discussion
To date, only a few studies have evaluated associations of tax policy with mortality in the US, with most reports focusing on infant and maternal mortality.^15,40,41,42,43,44^ Therefore, this cross-sectional study was important because we examined the association of state-level tax revenue per capita and the Suits index of tax progressivity with screening and cancer mortality rates throughout the US. Of note, there was a marked variation in the total revenue that state governments collected from taxes, fees, and charges, which reflected the diversity and federalist traditions in the US. Similarly, state-level spending on public goods and services, including health services, varied significantly.^36^ Although redistribution of wealth and privilege at the state level can be mediated by both spending and taxation, existing literature has predominantly evaluated the role of spending.^31,45^ The current study specifically evaluated tax policy and found that increased state-level tax revenue was associated with both increased colon, breast, and cervical cancer screening, as well as decreased cancer mortality. Of note, the observed associations varied among different racial and ethnic populations.
The conceptual framework linking tax policy to improved health outcomes is based on the potential of tax systems to enhance representation and promote democratic accountability.^46^ Tax payers contribute to the creation of public revenue, thus becoming responsible for holding governments accountable and demanding high quality goods and services, including health services.^47^ Moreover, state governments use tax revenue to finance equitable health care, helping to address some of the inherent inequalities of a privately financed health care system.^46^ Additionally, the revenue stream generated by taxation can fund public health care, as well as other public services that promote health-related goals. In fact, Barnes et al^45^ found that state-level public assistance was associated with improved survival among patients with cancer. Overall, investments in public services, infrastructure, environmental conditions, systems of transportation, education, and parks and recreation have been shown to improve health outcomes among the entire community, while being particularly beneficial to racial and ethnic minority populations and low-income individuals.^44,48^
Tax policy as an SDoH has been increasingly regarded as a vital, valid public health measure, allowing for the promotion of fairness and wealth redistribution within society.^46^ The association of tax policy with mortality was recently demonstrated by Junior et al,^15^ who reported that higher revenue and more progressive taxes were associated with decreased infant mortality rates. In the current study, state-level tax revenue per capita was associated with cancer screening and mortality rates. Specifically, incremental increases in tax revenue per capita were associated with corresponding increases in cancer screening rates and declines in the incidence of cancer mortality. These findings are in line with previous studies^43,49^ reporting that increased tax revenue and higher progressivity may lead to improved welfare and health care outcomes. Tax revenue may serve as funding that promotes the common good by ensuring access to safe, healthy environments and quality health care, while progressive taxes can substantially increase the disposable income of working-class households, thus enhancing their living standards and improving their health and cancer outcomes.^40,42^
Of note, inequities may persist even when there is an overall observed improvement toward a health goal, in which the improvement is not equitably distributed throughout the community.^8^ This finding was evident in the current study, in which increased tax revenue was associated with lower cancer mortality among White populations, yet this association was absent for racial and ethnic minority populations. Similarly, for cancers with guideline-recommended screening, higher tax revenue per capita was associated with cancer mortality in the overall study cohort and among White individuals; however, no such association was observed among racially and ethnically minoritized populations. Importantly, Black and Hispanic populations have historically faced discrimination and limited access to social resources, thus being exposed to worse environmental conditions, socioeconomic challenges, and limited educational and employment opportunities.^9^ SDoH represent obstacles to quality health care, with various studies demonstrating the impact of these factors on cancer prevention strategies.^2,9,45,50^ Furthermore, low income, low health literacy, and long distances to screening and treatment sites, as well as lack of health insurance, transportation means, or paid medical leave have been associated with decreased likelihood of undergoing timely screenings or receiving guideline-appropriate cancer care.^8,50^ To this end, findings of the current study highlight that although higher tax revenue may improve cancer-related outcomes, the benefit does not appear to affect racial and ethnic minority and disadvantaged populations. Importantly, because 97.6% of state-years in the current study had regressive tax policies, even high tax revenue may disproportionately burden racially and ethnically minoritized communities who are required to devote large percentages of their income to state and local taxes. Notably, the most regressive policies in the US were in Southern states, which have historically had higher concentrations of racial and ethnic minority populations compared with other regions (Figure, B).^51^ As such, while greater tax revenue may fund essential investments in housing, education, income, and transportation, the very populations that stand to benefit the most are also taxed at relatively higher rates, thus limiting their capacity to access these resources.^9,17,44,52^
Obstacles to accessing health care can lead to late diagnosis and worse prognosis, with Black populations demonstrating the highest overall cancer death rates. Black women present higher likelihood of death from breast cancer compared with White women, in addition to the highest cervical cancer death rates overall.^8^ Furthermore, screening rates are usually lower among racial and ethnic minority populations, uninsured individuals, and residents of rural areas.^53^ To this end, various cancer screening evidence-based programs have been designed and executed in recent years, partially funded by state governments, focusing on increasing screening rates specifically among racial and ethnic minority and low-income populations.^53^ For instance, the Community Cancer Screening Program aimed to increase colorectal cancer screening rates among low income, underinsured, or uninsured individuals in medically underserved, rural communities in Georgia, while the goal of the New Hampshire Colorectal Cancer Screening Program was to implement quality screening for low-income, uninsured, and underinsured patients.^53,54,55^ Of note, by prioritizing outreach to racial and ethnic minority and uninsured populations, the Delaware Cancer Consortium nearly eliminated disparities in screening, incidence, and advanced staged diagnosis of colorectal cancer among African American individuals within a 7-year period.^56^ Similarly, the Citywide Colon Cancer Control Coalition in New York initiated a colonoscopy screening campaign in 2003, reporting decreasing trends in both incidence and mortality among all racial and ethnic subgroups over the subsequent 13 years.^57^ In North Carolina, the North Carolina Breast Cancer Screening Program promoted awareness and ensured compliance among African American women, while the Forsyth County Cancer Screening Project increased breast and cervical cancer screening rates among low-income, Black women via the implementation of both clinic in-reach and community outreach strategies.^58,59^ In addition, Kukui Ahi (Light the Way) in Hawaii and the Targeting Cancer in Blacks program in Tennessee and Georgia successfully boosted overall screening rates for colorectal, cervical, breast and prostate cancer among Asian and Pacific Islander and Black adults, respectively.^60,61^ These evidence-based screening programs represent successful state-level initiatives and should highlight how government allocation of revenue can advance health care and cancer prevention goals.
Limitations
There are several limitations to consider when interpreting the results of the current study. The ecological profile of the study meant that we could not control for potential individual-level confounders, nor draw causal inferences. Furthermore, there may be potential measurement errors in the external, publicly available data used. Tax progressivity was not included in all years evaluated in the current study due to only 5 years of ITEP tax progressivity data being reported within the defined study period. The study was conducted at the state level due to tax policy data being available at that geographic level, thus potentially masking more granular variations. Future studies should aim to examine the association of taxation with cancer-related outcomes at more granular levels. The analysis did not account for potential nonlinear threshold effects, namely effects of tax policy on cancer screening or cancer mortality that occurred solely over or under a level of revenue or progressivity. Although the use of 2- and 4-year lags between tax policy and outcomes is based on existing literature, the actual time required for tax policy to impact health- and cancer-related outcomes remains unclear.^15,41,62^ Cancer screening rates were estimated based on data from self-reported questionnaires, potentially introducing bias to the reported estimates.
Conclusions
In conclusion, tax policy represents an SDoH that may impact cancer screening and cancer mortality rates in the US, based on the height of the tax revenue and the progressivity of the taxes. Therefore, designing tax systems based on high tax revenue and progressive policies may present one aspect of a multifactorial approach to improve cancer-related outcomes, thus mitigating persistent cancer health care inequalities in the US.
The reference list from the paper itself. Each links out to its DOI / PubMed record.
- 1Healthy People 2030. Reduce the overall cancer death rate—C-01. Office of Disease Prevention and Health Promotion. Accessed October 6, 2024. https://health.gov/healthypeople/objectives-and-data/browse-objectives/cancer/reduce-overall-cancer-death-rate-c-01
- 2Healthy People 2030. Cancer. Office of Disease Prevention and Health Promotion. Accessed October 6, 2024. https://health.gov/healthypeople/objectives-and-data/browse-objectives/cancer
- 3Healthy People 2030. Increase the proportion of females who get screened for breast cancer—C-05. Office of Disease Prevention and Health Promotion. Accessed October 6, 2024. https://health.gov/healthypeople/objectives-and-data/browse-objectives/cancer/increase-proportion-females-who-get-screened-breast-cancer-c-05
- 4Healthy People 2030. Increase the proportion of females who get screened for cervical cancer—C-09. Office of Disease Prevention and Health Promotion. Accessed October 6, 2024. https://health.gov/healthypeople/objectives-and-data/browse-objectives/cancer/increase-proportion-females-who-get-screened-cervical-cancer-c-09
- 5Healthy People 2030. Increase the proportion of adults who get screened for colorectal cancer—C-07. Office of Disease Prevention and Health Promotion. Accessed October 6, 2024. https://health.gov/healthypeople/objectives-and-data/browse-objectives/cancer/increase-proportion-adults-who-get-screened-colorectal-cancer-c-07
- 6Centers for Disease Control and Prevention. Leading cancer cases and deaths, all races and ethnicities, male and female, 2021. Published June 2024. Accessed October 7, 2024. https://gis.cdc.gov/Cancer/USCS/?CDC_AA_ref Val=https%3A%2F%2Fwww.cdc.gov%2Fcancer%2Fdataviz%2Findex.htm#/At A Glance/
- 7Ward EM, Sherman RL, Henley SJ, . Annual report to the nation on the status of cancer, featuring cancer in men and women age 20-49 years. J Natl Cancer Inst. 2019;111(12):1279-1297. doi:10.1093/jnci/djz 106 31145458 PMC 6910179 · doi ↗ · pubmed ↗
- 8National Cancer Institute. Cancer disparities. National Institutes of Health. Updated January 31, 2025. Accessed March 28, 2025. https://www.cancer.gov/about-cancer/understanding/disparities