Comparison of Propofol and Sevoflurane as Anesthesia Maintenance Agents in Relation to Postoperative Pain, Nausea and Vomiting During Endoscopic Retrograde Cholangio-Pancreatography: A Prospective, Single-Center, Randomized, Single-Blind Pilot Study
Mehdi Belhassane, Leo Jaubert

TL;DR
This pilot study compared propofol and sevoflurane for anesthesia during ERCP and found no significant differences in postoperative pain, nausea, or vomiting.
Contribution
The study is the first to compare these anesthetics in the specific context of endoscopic retrograde cholangio-pancreatography.
Findings
No significant difference in postoperative nausea and vomiting between the two groups.
No significant difference in postoperative pain or analgesic use between the groups.
Both anesthetics showed similar outcomes in the first 48 hours post-procedure.
Abstract
Introduction Halogen gas anesthesia is considered to be more conducive to postoperative nausea and vomiting (PONV) than total intravenous anesthesia. This difference has been demonstrated in surgery, but there have been no studies on postoperative pain (POP), nausea and vomiting based on anesthesia in the specific environment of endoscopy, to the best of our knowledge. Our aim was therefore to carry out a preliminary study to investigate a trend in POP, nausea and vomiting during endoscopic retrograde cholangio-pancreatography (ERCP), depending on the type of the maintenance anesthetic agent used. Methods This single-center, prospective, randomized, single-blind pilot study included 42 adult patients (American Society of Anesthesiologists classification score, ASA ≤ 3) benefiting from ERCP. They were randomized into two groups depending on the type of maintenance anesthetic used: the…
Genes, proteins, chemicals, diseases, species, mutations and cell lines named across the full text — each resolved to its canonical identifier and authoritative record.
Click any figure to enlarge with its caption.
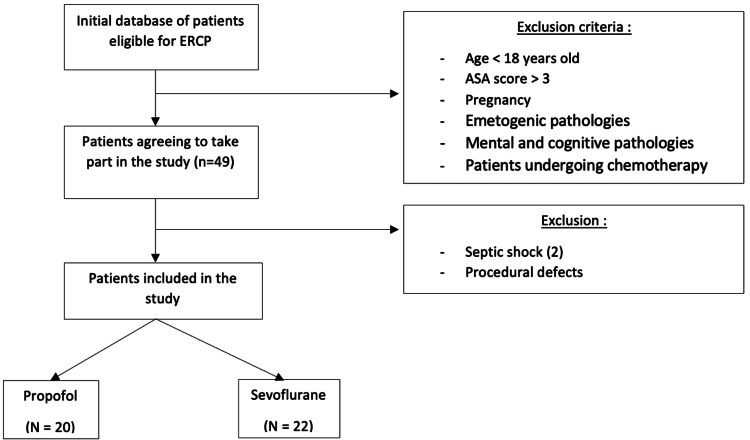 Figure 1
| Inclusion criteria | Exclusion criteria |
| Age >18 years | Contraindication to the anaesthetics used or mental and cognitive pathologies |
| ASA ≤3, eligible for ERCP | Pregnancy or emetogenic pathology except GERD and PUD, patients undergoing chemotherapy |
| Variables | |
| Demographic and medical variables | Age (years) |
| BMI (kg/m²) | |
| Gender (M/F) | |
| Oncopathology (yes/no) | |
| Diabetes (yes/no) | |
| GERD and/or PUD (yes/no) | |
| Anesthetic and operative variables | ASA score (1/2/3) |
| Apfel score (0/1/2/3/4) | |
| Operating time (min): time from anesthetic injection to patient extubation | |
| Follow-up variables postoperatively | Number of PONV episodes perceived by patients during the 48 h postoperatively |
| Number of antiemetics received by patients during the 48 postoperative hours | |
| Patients’ VAS scores during the five postoperative periods | |
| Type of analgesic received during the 48 h postoperatively | |
| Sevoflurane (N=22) | Propofol (N=20) | p | |
| Age (years) | 56.5 ± 19.9 – 58.5 (48.5-66) | 64.1 ± 16.1 – 65 (56-74.5) | 0.12 |
| Body mass index (kg/m²) | 25.7 ± 5.7 – 25.2 (21.8-28.5) | 25.4 ± 6.2 – 23.6 (21.3-27.0) | 0.57 |
| Gender (M/F), n (%) | 13 (59.1%)/9 (40.9%) | 10 (50%)/10 (50%) | 0.55 |
| Cancer (yes/no), n (%) | 15 (68.2%)/7 (31.8%) | 10 (50%)/10 (50%) | 0.23 |
| Diabetes (yes/no), n (%) | 5 (23%)/17 (77%) | 5 (25%)/15 (75%) | 0.86 |
| GERD and/or PUD (yes/no), n (%) | 4 (18%)/18 (82%) | 4 (20%)/16 (80%) | 0.88 |
| Sevoflurane (N=22) | Propofol (N=20) | p | |
| Intervention time (min) | 70.8 ± 29.1 – 65 (55.5-86.7) | 76.9 ± 38.3 – 69.5 (49.7-100) | 0.78 |
| ASA score | 0.65 | ||
| 1 | 1 (4.6%) | 1 (5%) | - |
| 2 | 13 (59.1%) | 9 (45%) | - |
| 3 | 8 (36.4%) | 10 (50%) | - |
| Apfel score | 0.63 | ||
| 0 | 7 (31.8%) | 5 (25%) | - |
| 1 | 10 (45.5%) | 9 (45%) | - |
| 2 | 4 (18.2%) | 6 (30%) | - |
| 3 | 1 (4.5%) | 0 (0%) | - |
| 4 | 0 (0%) | 0 (0%) | - |
| Sevoflurane (N=22) | Propofol (N=20) | p | |
| PONV | 0.66 | ||
| Yes | 8 (36.4%) | 6 (30%) | - |
| No | 16 (63.6%) | 14 (70%) | - |
| Sevoflurane (N=22) | Propofol (N=20) | p | |
| No. of emetic episodes at 48 h, whole group | 1 ± 1.9 – 0 (0-2) | 0.6 ± 1.2 – 0 (0-1) | 0.55 |
| No. of emetic episodes at 48 h, patients with PONV | 2.75 ± 2.3 – 2 (1.25-3.5) | 2 ± 1.5 – 1.5 (1-2.75) | 0.41 |
| No. of antiemetics administered, whole group | 0.36 ± 0.58 – 0 (0-1) | 0.20 ± 0.52 – 0 (0-0) | 0.23 |
| No. of antiemetics administered, patients with PONV | 1 ± 0.53 – 1 (1-1) | 0.67 ± 0.82 – 0.5 (0-1.25) | 0.31 |
| Apfel score | Sevoflurane (N=22) | Propofol (N=20) | p |
| 0 | 1.06 ± 0.53 | 0.08 ± 0.63 | 0.24 |
| 1 | 0.99 ± 0.34 | 0.57 ± 0.36 | 0.41 |
| 2 | 0.93 ± 0.56 | 1.06 ± 0.59 | 0.87 |
| 3 | 0.86 ± 0.93 | 1.56 ± 1.03 | 0.62 |
| Sevoflurane (N=22) | Propofol (N=20) | |
| Postop 1 h | 0.83 ± 1.88 – 0 (0-0.5) | 0.95 ± 2.18 – 0 (0-0) |
| Postop 6 h | 1.54 ± 2.04 – 0 (0-3.25) | 2.05 ± 2.94 – 0 (0-3) |
| Postop 12 h | 0.36 ± 0.84 – 0 (0-0) | 1.05 ± 1.98 – 0 (0-1.75) |
| Postop 24 h | 1.63 ± 2.32 – 0 (0-4) | 1.35 ± 1.87 – 0 (0-3) |
| Postop 48 h | 1.09 ± 1.35 – 0 (0-2.25) | 0.75 ± 1.77 – 0 (0-0) |
| Sevoflurane (N=22) | Propofol (N=20) | p | |
| Type of analgesic used | 0.80 | ||
| No treatment | 5 (22.7%) | 5 (25%) | - |
| Paracetamol or tramadol IV or PO | 15 (68.2%) | 12 (60%) | - |
| Strong opioid IV or PO | 2 (9.1%) | 3 (15%) | - |
| Type I error (α) | Test power (1-β) | Number of patients per group |
| 5% | 80% | 254 |
| 5% | 90% | 341 |
| 1% | 80% | 378 |
| 1% | 90% | 481 |
Peer Reviews
No public reviews on file for this paper yet. If you reviewed it on a platform where reviews are public (OpenReview, ICLR, NeurIPS, ICML), you can paste yours below so the community can read it here.
Videos
No videos yet. Explain this paper in a talk, walkthrough, or lecture? Add one.
Taxonomy
TopicsNausea and vomiting management · Anesthesia and Pain Management · Anesthesia and Sedative Agents
Introduction
The practice of anesthesia dates back to ancient times, and it was not until the mid-19th century that it entered its modern era, separating the surgical act from pain. Since then, there has been a succession of anaesthetics, each with its own set of more or less severe postoperative complications. Over time, however, anaesthetic products have become increasingly safe, despite the persistence of certain adverse effects [1,2].
Indeed, postoperative nausea and vomiting (PONV) and postoperative pain (POP), which can contribute to the increased incidence of PONV, are frequent and undesirable complications in patients undergoing procedures requiring general anesthesia. PONV affects 20% to 30% of patients, with the rates reaching as high as 80% when risk factors are present [2-5]. PONV can be severe in 0.1% of cases, and it may be complicated by electrolyte disorders, esophageal injury, inhalation pneumonitis, or wound dehiscence, which can lead to additional costs and prolonged hospitalization [6]. Inhaled anesthesia, which combines induction with propofol and maintenance with sevoflurane, has been shown to increase the incidence of PONV, compared to total intravenous anesthesia (TIVA) with propofol alone [4,6,7]. This difference is consistent with study findings on certain open and laparoscopic surgeries [6,8,9,10]. However, there are very few studies comparing these two types of anesthesia in relation to PONV, and to our knowledge, there have been no studies addressing the differences in the onset of PONV and POP depending on the type of anesthesia chosen in the specific setting of interventional gastroenterology. Interventional endoscopy encompasses a number of procedures. One of them is endoscopic retrograde cholangio-pancreatography (ERCP), a diagnostic and therapeutic procedure that enables minimally invasive management of pancreatic and biliary pathologies, with a complication rate of around 10%, which increases when risk factors are present [11,12]. ERCP utilizes the natural digestive tract, considerably limiting tissue damage and postoperative opioid use, and also requires shorter anesthesia times, which may contribute to a reduced incidence of PONV [5].
The main objective of this study was therefore to determine, in the specific setting of interventional endoscopy, whether there is a difference between sevoflurane and propofol as maintenance anesthetic agents in relation to the occurrence of postoperative pain, nausea, and vomiting during uncomplicated ERCP.
Materials and methods
Study design and sampling
This prospective, single-center, randomized, single-blind pilot study was approved by the Ethics Committee of our hospital (reference P2018/610/CCB B406201838158), and was carried out in the Anesthesia-Resuscitation Department of Hôpital Erasme between January and May 2020. Patients were assigned to two groups using randomization: “sevoflurane” group where induction was done with propofol and maintenance with sevoflurane 2%, and “propofol” group, where induction and maintenance were carried out using propofol via a target-controlled infusion (TCI) device. Patients were unaware of the anesthesia they were about to receive, as the operators were informed a few minutes before induction. Inclusion and exclusion criteria are listed in Table 1 (see, also, the Appendices).
Description of the final cohort
Of the 49 patients considered for the study, seven were excluded from this analysis. Two patients developed septic shock postoperatively requiring intensive care management and five patients had procedural errors (intraoperative injection of a product not authorized by the study). The cohort therefore comprised 42 patients: 22 in the sevoflurane group and 20 in the propofol group (Figure 1).
Flowchart showing the composition of the two groupsERCP, endoscopic retrograde cholangio-pancreatography; ASA, American Society of Anesthesiologists
Study protocol
The patient's informed consent was obtained during the preoperative consultation. Premedication was administered 30 minutes before the procedure with 0.5 mg of sublingual alprazolam. Standard anesthetic monitoring was established (three-lead ECG, pulse oximetry, and non-invasive blood pressure). A peripheral venous line was inserted, and Hartmann’s solution was infused at a rate of 10 mL/kg/h. Pre-oxygenation was performed with a face mask at an FiO₂ of 90% for three minutes.
Anesthesia was induced and maintained according to the previously assigned technique, with an injection of alfentanil 55 µg/kg followed by rocuronium 0.9 mg/kg IV. In the sevoflurane group, induction was achieved with a bolus of propofol at 1.5-2.5 mg/kg IV and maintenance was provided with sevoflurane. In the propofol group, both induction and maintenance were performed using IV propofol administered via TCI (Schnider model) at an effect-site concentration of 3-4 µg/mL.
Mechanical ventilation was adjusted to maintain an end-tidal CO₂ level between 35 and 40 mmHg. During the procedure, mean arterial pressure (MAP) was maintained above 70 mmHg using IV ephedrine or phenylephrine, depending on heart rate.
At the end of the procedure, sugammadex was administered to reverse the effects of rocuronium if necessary. As soon as the patient was extubated, they were transferred to the recovery room with continuous pulse oximetry and oxygen via nasal cannula at 3 L/min. No analgesic or antiemetic prophylaxis was administered preoperatively or intraoperatively.
During the postoperative 48 h, the patient was seen again at 1, 6, 12, 24 and 48 h to ask if they had experienced any nausea or vomiting, for pain assessment using a visual analogue scale (VAS), with the score ranging from 0 (no pain) to 10 (worst pain imaginable), and to collect information on any analgesics and antiemetics received, in accordance with the protocol (see the Appendices). The post-anesthesia care unit (PACU) and ward nurses and doctors were unaware of the anesthesia the patient had received. If the patient was discharged within 48 h, they were contacted to report the analgesics and antiemetics taken at home.
Statistical methodology
All data were collected using REDCap software (Research Electronic Data Capture v14.1.2; Vanderbilt University). The data set was exported to a Microsoft™ Excel™ spreadsheet (Microsoft Corporation, Redmond, USA). Statistical analysis was performed using the NCSS 19.0.3 statistical software (NCSS, LLC, Kaysville, USA). Data are reported as mean ± SD - median (interquartile range), or number of cases N (%), except for data derived from analysis of covariance, which are reported as least-squares mean (±SEM). Numerical data were compared between groups by the non-parametric Mann-Whitney test. Categorical (discrete) data were compared using a chi-square test. The total number of emetic episodes reported at 48 h post-intervention were compared between groups using analysis of covariance with the help of a general linear model, with each patient's Apfel score as a co-variable. A Tukey-Kramer test was used to compare each category of the Apfel score. Numerical pain assessment score values measured at 1, 6, 12, 24 and 48 h post-intervention were compared between groups by repeated measures analysis of variance using a general linear model. For all tests, a value of p<0.05 was considered statistically significant. The variables studied are described in Table 2.
Results
Demographic and medical data
Univariate analysis showed no significant difference between the two groups (Table 3).
Table 3: Comparison of demographic and medical variables between the two study groupsGERD, gastroesophageal reflux disease; PUD, peptic ulcer diseaseResults are presented as mean ± standard deviation – median (interquartile range).p<0.05 was considered statistically significant.
Anesthetic and operative data
Univariate analysis showed no significant difference between the two groups (Table 4).
Table 4: Comparison of anesthetic and operative variables between the two study groupsASA, American Society of AnesthesiologistsResults are presented as mean ± standard deviation – median (interquartile range).p<0.05 was considered statistically significant.
Postoperative follow-up variables
Univariate analysis showed no significant difference between the two groups in the occurrence of PONV (Table 5) or in the number of emetic episodes at 48 h postoperatively (Table 6). Analysis of covariance with the Apfel score as a cofactor showed no significant difference between the two anesthesia techniques regarding the occurrence of PONV (Table 7). The analysis showed no significant differences in postoperative pain and no effect of time on pain levels (Table 8). Also, there were no significant differences in the treatments received postoperatively (Table 9).
Table 6: Analysis of the effect of anesthesia on the number of postoperative nausea and vomiting (PONV) episodes and the consumption of antiemeticsResults are presented as mean ± standard deviation – median (interquartile range).p<0.05 was considered statistically significant.
Table 7: Analysis of the effect of anesthesia on postoperative nausea and vomiting (PONV) episodes during the 48-h postoperative period based on the Apfel scoreResults are presented as mean ± standard deviation.Effect of anesthesia, p = 0.24; effect of Apfel score, p = 0.51; anesthesia x Apfel score, p = 0.39. p<0.05 was considered statistically significant.
Table 8: Analysis of the effect of anesthesia on visual analog assessment as a function of timeResults are presented as mean ± standard deviation – median (interquartile range).Effect of anesthesia, p = 0.69; time effect, p = 0.051; anesthesia x time, p = 0.66. p<0.05 was considered statistically significant.
Table 9: Analysis of the effect of anesthesia on the type of analgesic used postoperativelyp<0.05 was considered statistically significant.
Power calculation
Based on the incidence of postoperative nausea and vomiting observed in the study, the required sample size for a larger study was determined according to the desired type I error rate and statistical power (Table 10).
Discussion
The composition of the two groups was homogeneous. There was no significant difference in terms of emetic pathologies accepted in the study. Furthermore, no significant differences were found in ASA scores or duration of surgery, both of which may influence the incidence of PONV [13]. This suggests that the two groups in this cohort are comparable and originate from the same general population.
Regarding PONV, the patients mostly had an Apfel score of 2 or lower, which means the probability of PONV occurrence is between 20% and 40% according to the scientific literature [2-5,14]. In the results presented above, the incidence of PONV was similar across the entire cohort as well as within each of the two separate groups. This demonstrates that PONV remains a frequent problem, even in the specific setting of interventional endoscopy, even though ERCPs were performed by skilled operators to limit intervention time. However, it is possible that intra-duodenal CO_2_ insufflation may have played a role in the incidence of PONV [15,16].
On the other hand, this study did not demonstrate a significant difference between TIVA and inhaled anesthesia in terms of PONV incidence or the number of emetic episodes at 48 h postoperatively. Additionally, the same result was found for the use of postoperative antiemetics. These results contradict what is described in the scientific literature, which indicates that the use of volatile anesthetics is associated with an increased incidence of PONV [17] and propofol reduces it through an effect on dopaminergic receptors [18]. However, these studies were conducted on surgical interventions, raising doubt about the applicability of this difference to interventional endoscopy. Moreover, the analysis of covariance showed no significant effect of the Apfel score on the occurrence of PONV, which is surprising because patient-related risk factors should be represented in the sample if it reflects the general population. Therefore, we would expect to find that the higher the Apfel score, the higher the incidence of PONV. As a result, we can conclude that the statistical analysis may lack power due to the small number of patients studied. This preliminary study allows to highlight a slightly lower trend in the TIVA group, but without a significant difference.
Regarding POP, the analysis of the VAS during the 48 h postoperatively showed no significant difference between the two groups. The trend indicated generally mild pain with a non-significant time effect. Furthermore, there was no significant difference in the use of analgesics postoperatively. These results show that the groups were treated similarly for pain and that there was no significant over- or underuse of opioids, which could generate PONV in one group and not the other. This result is interesting because it is found that halogenated agents may have an anti-nociceptive effect with or without second gas effect [19,20]. Nevertheless, in clinical practice, this difference is not found [21]. It should be noted that the studies were conducted on open or laparoscopic surgeries, but never on endoscopic procedures, which are generally shorter and less invasive.
Limitations
This study was not without limitations. First, this was a monocentric study with a small sample size. Moreover, the Apfel score, which plays a major role in the incidence of PONV [22], was relatively low in the population studied, limiting the appearance of differences between the two groups. Hence, a study with a larger sample size is required to confirm the results. Sample size calculation for a larger follow-up study was carried out according to the alpha level and the desired power of the study (Table 10).
Conclusions
This study therefore clearly shows that, at this stage, there are no differences between inhaled anesthesia and TIVA for interventional gastroenterology procedures, with regard to PONV and POP. However, the results of this study are preliminary and still need to be confirmed by subsequent studies with much larger sample sizes.
The reference list from the paper itself. Each links out to its DOI / PubMed record.
- 1Historical development of modern anesthesia J Invest Surg Robinson DH Toledo AH 1411492520122258300910.3109/08941939.2012.690328 · doi ↗ · pubmed ↗
- 2Which clinical anesthesia outcomes are important to avoid? The perspective of patients Anesth Analg Macario A Weinger M Carney S Kim A 6526588919991047529910.1097/00000539-199909000-00022 · doi ↗ · pubmed ↗
- 3Surgical and patient factors involved in postoperative nausea and vomiting Br J Anaesth Lerman J 243269199210.1093/bja/69.supplement_1.24s 1486011 · doi ↗ · pubmed ↗
- 4Evidence-based management of postoperative nausea and vomiting: a review Can J Anaesth Habib AS Gan TJ 3263415120041506426110.1007/BF 03018236 · doi ↗ · pubmed ↗
- 5Pathophysiological and neurochemical mechanisms of postoperative nausea and vomiting Eur J Pharmacol Horn CC Wallisch WJ Homanics GE Williams JP 556672220142449541910.1016/j.ejphar.2013.10.037PMC 3915298 · doi ↗ · pubmed ↗
- 6An update on the management of postoperative nausea and vomiting J Anesth Cao X White PF Ma H 6176263120172845559910.1007/s 00540-017-2363-x · doi ↗ · pubmed ↗
- 7Postoperative nausea and vomiting. Its etiology, treatment, and prevention Anesthesiology Watcha MF White PF 162184771992160999010.1097/00000542-199207000-00023 · doi ↗ · pubmed ↗
- 8A meta-analysis of nausea and vomiting following maintenance of anaesthesia with propofol or inhalational agents Eur J Anaesthesiol Sneyd JR Carr A Byrom WD Bilski AJ 433445151998969910110.1046/j.1365-2346.1998.00319.x · doi ↗ · pubmed ↗