Multi-Index Quantitative Analysis of Pharyngiyan Tablet Characteristics by Screening Different Quality Control Components
Huan Cao, Liang Zhang, Xiaoning Zhan, Nan Hu, Xueyan Bi, Yanhong Wang

TL;DR
This study improves quality control of Pharyngiyan tablets by identifying key chemical markers and analyzing variations across manufacturers.
Contribution
A multi-index quality assessment method was developed using specific chemical markers for Pharyngiyan tablets.
Findings
131 chemical constituents were identified in Pharyngiyan tablets using UPLC–Q–TOF–MS/MS.
Five key compounds were selected as quality control indexes based on effectiveness and stability.
Significant variation in ingredient content was observed across manufacturers and batches.
Abstract
Pharyngiyan tablet is a traditional Chinese medicine (TCM) renowned for its efficacy in moisturizing the lungs, clearing the throat. However, it exhibits quality variations due to discrepancies in regulatory standards and challenges in comprehensive evaluation. In this study, ultra-performance liquid chromatography–quadrupole time-of-flight tandem mass spectrometry (UPLC–Q–TOF–MS/MS) was used to qualitatively analyze the chemical composition of pharyngiyan tablets. Full composition analysis detected 131 chemical constituents. Gallic acid, paeoniflorin, rutin, baicalin, and harpagoside were identified as quality control (QC) indexes through rational screening. These indexes were selected based on their effectiveness in demonstrating differences, stability after processing, specificity, and cost-effectiveness in measurement. For the multimetric quality assessment of the five screening…
Genes, proteins, chemicals, diseases, species, mutations and cell lines named across the full text — each resolved to its canonical identifier and authoritative record.
Click any figure to enlarge with its caption.
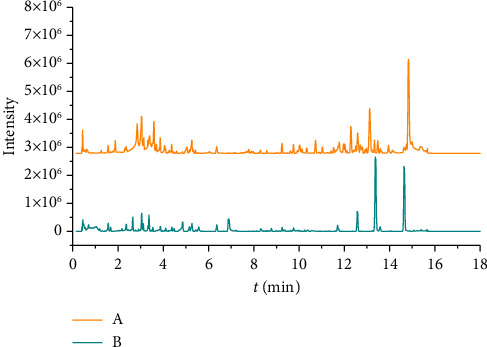 Figure 1
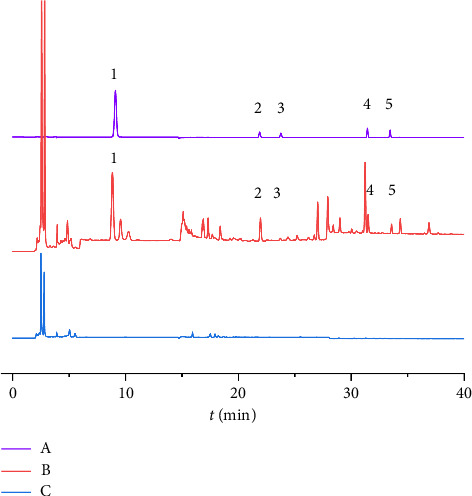 Figure 2
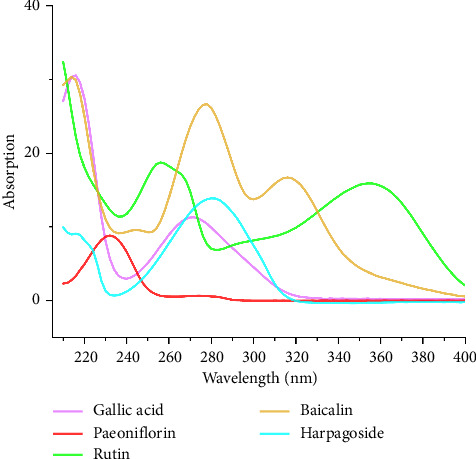 Figure 3
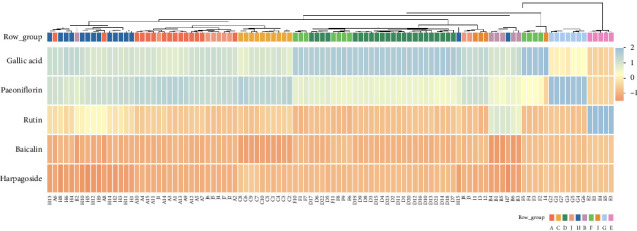 Figure 4
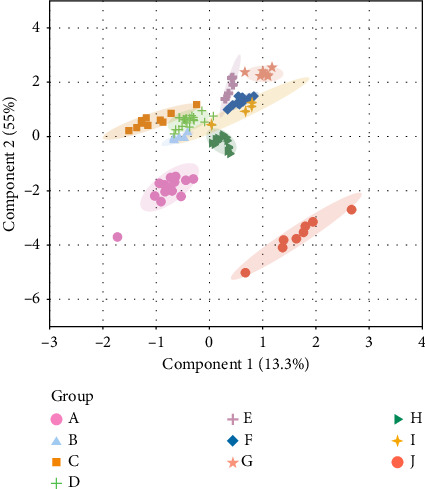 Figure 5
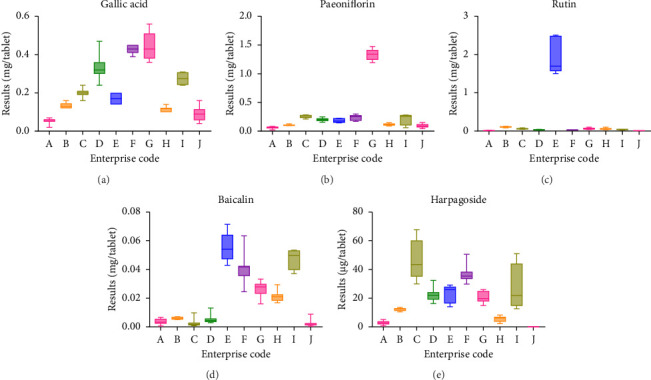 Figure 6
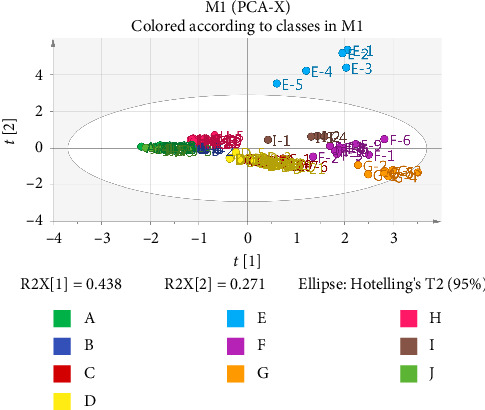 Figure 7
- —National Drug Sampling
Peer Reviews
No public reviews on file for this paper yet. If you reviewed it on a platform where reviews are public (OpenReview, ICLR, NeurIPS, ICML), you can paste yours below so the community can read it here.
Videos
No videos yet. Explain this paper in a talk, walkthrough, or lecture? Add one.
Taxonomy
TopicsFlavonoids in Medical Research · Phytochemicals and Antioxidant Activities · Natural product bioactivities and synthesis
1. Introduction
Traditional Chinese medicine (TCM) is pivotal in global traditional medicine owing to its holistic perspective, offering distinct advantages in treating complex chronic diseases [1–3]. Pharyngiyan tablets effectively nourish Yin and moisturize the lungs while clearing the throat, suppressing cough, and relieving itching. The formula of these tablets comprises 12 Chinese herbal medicines, including Scrophularia ningpoensis Hemsl, Moutan Cortex, and Canarii Fructus.
The existing benchmark is outlined in the guidelines established by the Ministry of Medicine, Book 2 [4], covering the description, identification, inspection criteria, and assay deficiencies. A comparison of enterprise registration standards [5–11] indicates discrepancies in quantitative indexes, limits, and testing methods for similar herbs. Therefore, conducting a comprehensive evaluation of pharyngiyan tablet quality across enterprises remains challenging. Notably, to determine the pharyngitis tablet contents, the researchers selected different indicators [12, 13] without providing a sufficiently detailed and clear explanation for the selection criteria of choosing the given indicators.
The essence of Chinese medicine regulatory science relies on integrating traditional attributes with innovative research methods, tools, and standards through cross-border integration. Establishing quality control (QC) standards using quality markers for identification has gained industry recognition. QC, crucial for internal enterprise management, requires selecting indicators for drug quality assessment beyond the mere identification of quality marker components. It necessitates active ingredients with traceable quantitative values from raw material drugs to finished products, stability in the composition of preparation processing technology, reasonable detection costs, and addressing other elements. These measurements collectively aim to achieve comprehensive QC across the entire industrial chain [14–16].
In selecting a QC index for pharyngiyan tablets, integrating comprehensive component analysis and research findings on active ingredients is essential. Pharyngiyan tablets primarily contain flavonoids, terpenes and their glycosides, and organic acids [17], known for their anti-inflammatory and analgesic efficacy in treating pharyngitis. The TCM effector mechanism results from the collective effect of various components. Screening the three main quality-differentiating compounds aims at identifying key quality attributes within the overall composition, aligning with the TCM characteristics that involve multiple components, targets, and medicinal efficacy attributes [18]. Compounds such as baicalin, the active ingredient in rutin, and other flavonoids can effectively alleviate pathogenic infections, reducing heat, detoxifying toxins, inhibiting bacteria, and providing anti-inflammatory effects [19–21]. Polyphenols, such as gallic and ellagic acids, are suggestibly the key to “clearing heat and improving the throat” [22, 23]. Terpenoids, such as harpagoside, exert inhibitory effects on inflammatory factor release in human bronchial epithelial cells [24, 25]. Screening compounds with a stable production process is crucial for identifying measurable and controllable substances throughout extraction and processing at each stage. Screening low-cost measurable compounds involves utilizing controlled substances from the National Institutes for Food and Drug Control (NIFDC), known for their high purity, to reduce testing costs.
In the present study, we aimed to establish a high-performance liquid chromatography with diode array detector (HPLC–DAD) wavelength–switching multi-indicator method to assess the quality of pharyngiyan tablets by screening indicator substances. Consequently, we achieved the cost-effective, efficient, comprehensive, and scientifically sound QC of pharyngiyan tablets.
2. Materials and Methods
2.1. Materials, Chemicals, and Reagents
Overall, 104 sample batches from 10 manufacturers were sourced from the national sampling and testing link. The manufacturers were denoted by the letters A–J, with 15 batches from manufacturer A, 6 from B, 10 from C, 23 from D, 5 from enterprise E, 11 from F, 7 from G, 15 from H, 4 from I, and 8 from J.
Gallic acid (batch no. 110831–201906, purity: 91.5%), paeoniflorin (batch no. 110736–202145, purity: 94.6%), rutin (batch no. 100080–202012, purity: 91.6%), baicalin (batch no. 110715–202122, purity: 94.2%), and harpagoside (batch no. 111730–202110, purity: 96.8%) were procured from the NIFDC. We used methanol, acetonitrile, and formic acid of mass spectrometry grade, chromatographic-grade phosphoric acid, and distilled water (Watsons).
2.2. Compositional Analysis via Ultra-Performance Liquid Chromatography–Quadrupole Time-of-Flight Tandem Mass Spectrometry (UPLC–Q–TOF–MS/MS)
2.2.1. Preparation of the Test Solution
Ten pharyngiyan tablets were taken, and their coatings were removed; the tablets were then ground, and approximately 2.0 g of the powder was transferred to a stoppered conical flask. Subsequently, 25 mL of methanol was added, followed by ultrasonic treatment for 30 min. The mixture was then cooled and centrifuged at 12,000 rpm for 10 min. The supernatant was collected, obtaining the desired extract.
2.2.2. Preparation of the QC Sample Solution
One sample was taken from each of the 10 enterprises, i.e., 10 samples according to the method described in Subsection “2.2.1.” to prepare the test solutions. Next, 1 mL was taken from each of the 10 samples and mixed well.
2.2.3. UPLC Conditions
The instruments used in this study included the ACQUITY™ UPLC (Waters Corporation, United States of America). The samples were subjected to separation on an ACQUITY™ UPLC BEH C_18_ column (2.1 × 50 mm, 1.7 μm) at 35°C. The mobile phase consisted of 0.1% formic acid aqueous solution (A) and acetonitrile (B), utilizing a gradient elution (0–15 min, 95%–5% A) at a flow rate of 0.4 mL min^−1^. Importantly, reversed-phase chromatographic systems commonly use acetonitrile–water systems [26]. Formic acid was added to the samples to increase their ionization. The temperature of the experimental room was maintained at 4°C, and the injection volume was 4 μL.
2.2.4. Mass Spectrometry Conditions
MSE data were collected using an electrospray ionization (ESI) for both positive and negative ions. The ion source temperature was maintained at 110°C with a cone-pore sampling voltage of 40 V. In the positive ion mode, the capillary voltage was set at 3.0 kV, desolvation at 650 L/h, and desolvation temperature at 350°C, with a cone hole gas flow rate of 50 L/h. In the negative ion mode, the capillary voltage was set at 2.5 kV, desolvation at 800 L/h, desolvation temperature at 450°C, and the cone-pore gas flow at 100 L/h. The scanning mode applied was a full scan, with a mass data acquisition range of m/z 50–1200, utilizing the centroid acquisition mode. Figure 1 illustrates the QC chromatogram under the specified chromatographic and mass spectrometric conditions.
2.2.5. Component Analysis and Attribution
Based on the method described, the chromatogram of the pharyngiyan tablets' QC sample was imported into the UNIFI analysis platform. Subsequently, automated data processing and database searching were conducted. The analysis revealed multiple candidates matching the quasimolecular ions at low collision energies with an accurate mass error of < 5 mDa. Further analysis involved exploring the structure of each secondary fragment corresponding to the parent ions at high collision energies in the diagram to determine accuracy. If the cleavage appeared reasonable, the structure could be initially concluded to be correct, thus confirming the compound. Identification of the composition relied on UNIFI autoidentification, literature reports, and comparison with online and offline mass spectrometry databases.
2.3. Establishment of the Multi-Indicator Content Determination Method
In this study, we investigated conditions including wavelength, elution gradient, and extraction method of the test solution. The wavelength variation range was determined based on the ultraviolet (UV) absorption maximum of the target components. Subsequently, the optimal wavelength for each phase was determined, considering factors such as peak response value, shape, and impurity interference. Gradient changes in the mobile phase were examined using an acetonitrile–0.1% phosphoric acid aqueous solution over time. Conditions were selected to achieve good peak shape and high separation, leading to the choice of gradient elution with acetonitrile–0.1% phosphoric acid aqueous solution as the mobile phase. We also assessed factors such as the test solution extraction solvent, method (ultrasonic and reflux), and time. Ultimately, the decision was made to use methanol as the extraction agent and to conduct ultrasonic extraction for 60 min.
2.3.1. Reference Solution
Gallic acid, paeoniflorin, rutin, baicalin, and harpagoside were weighed at 102.60, 20.78, 20.18, 10.08, and 10.46 mg; dissolved in methanol; and fixed in a 100-mL volumetric flask to prepare the reference solutions. To obtain the final concentration, the reference solution was diluted 10-fold.
2.3.2. Test Solution
Twenty pharyngiyan tablets were taken, and their coatings were removed. Subsequently, we precisely weighed and finely ground the tablets into a powder. Approximately 2.0 g of the powder was precisely weighed and placed into a stoppered conical flask. Thereafter, 25 mL of methanol was added, and the flask was tightly closed and weighed. The mixture underwent ultrasonic treatment (power: 250 W and frequency: 35 kHz) for 60 min, followed by cooling and reweighing. Methanol was added to compensate for any weight loss, and the mixture was shaken before filtration. Finally, the filtrate was obtained, constituting the desired extract.
2.3.3. Control Solution
We prepared the negative samples except for Canarii Fructus, Moutan Cortex, Farfarae Flos, Oroxyli Semen, and Scrophulariae Radix following the prescription process for each and prepared a control solution following the procedure outlined in Section 2.3.2.
2.3.4. Chromatographic Conditions and System Adaptability
The chromatographic conditions applied an Agilent 1100 HPLC (Agilent) with a Kromasil-100-5-C_18_ (4.6 mm × 250 mm, 5 μm) column. The mobile phase consisted of acetonitrile (A) and 0.1% aqueous phosphoric acid (B), applying gradient elution (0–10 min, 3% A; 10–11 min, 3% A ⟶ 15% A; 11–20 min, 15% A ⟶ 20% A; 20–50 min, 20% A ⟶ 60% A; 50 min, 20% A ⟶ 60% A). Detection wavelengths were set at 210 nm for 0–6 min, 272 nm for gallic acid for 6–13 min, 245 nm for 13–18 min, 230 nm for paeoniflorin for 18–22.5 min, 320 nm for rutin for 22.5–28 min, and 278 nm for baicalin and harpagoside for 28–50 min. The flow rate was maintained at 1.0 mL/min with a column temperature of 30°C. The injection volume was 5 μL.
2.4. Method Validation
2.4.1. Linear Relationship
A series of concentrations of the mixed solutions were prepared by dissolving the accurately weighed and appropriate amounts of each reference in methanol. The mixed solutions contained gallic acid (4.14, 8.28, 16.56, 33.12, and 165.62 μg/mL), paeoniflorin (5.39, 10.78, 21.57, 43.14, and 215.69 μg/mL), rutin (5.47, 10.95, 21.89, 43.78, and 218.92 μg/mL), baicalin (7.04, 14.08, 28.17, 56.33, and 281.66 μg/mL), and harpagoside (5.35, 10.70, 21.39, 42.79, 213.93 μg/mL). A sample volume of 5 μL was taken for the measurements and unitary linear regression was used for the analysis with correlation coefficient values above 0.9990. The results met the requirements of the standard drug quality analysis method of the Chinese Pharmacopoeia. Table 1 presents the results of the linear equation.
2.4.2. Precision Test
Appropriate quantities of gallic acid, paeoniflorin, rutin, baicalin, and harpagoside control were prepared, yielding concentrations of 100.65, 19.658, 18.485, 9.4954, and 10.125 μg/mL, respectively, and consecutively injected into the sample six times following the method outlined in Section 2.3.4. The results indicated good instrument precision.
2.4.3. Repeatability Test
We prepared six samples individually from the same batch of pharyngiyan tablets following the method outlined in Section 2.3.2. The chromatographic conditions specified in Section 2.3.4 were applied to determine the average contents of gallic acid, paeoniflorin, rutin, baicalin, and harpagoside, which were 1.738, 1.063, 0.1077, 0.2487, and 0.1561 mg/g, respectively, with RSDs ≤ 2.0%, indicating good reproducibility of the method.
2.4.4. Stability Test
The pharyngiyan tablet samples from the same batch were utilized to prepare the test solution following the procedure outlined in Section 2.3.2. Chromatographic conditions specified in Section 2.3.4 were applied to determine the peak areas at 0, 3, 12, 23, 30, and 37 h. The results demonstrated that the stability of the test solution remained satisfactory within 37 h.
2.4.5. Recovery Rate Test
We collected approximately 1 g of the pharyngiyan tablets powder with a known amount of the five ingredients. In total, six portions were collected. A known quantity of reference solution was added following the parallel preparation method of the test solution outlined in Section 2.3.2 and according to the chromatographic conditions for determination described in Section 2.3.4. Reference substances with known purity were used for the determination of the recovery of the added sample. The recovery ratio was calculated by the margin of the determined value and the amount of the examined substance divided by the amount of the added reference substance. Table 2 presents the results, including the calculated recovery.
2.4.6. Specificity Test
The reference, test, and control solutions were prepared according to the chromatographic conditions outlined in Section 2.3.4. A chromatogram and absorption spectra were recorded for each solution. Figure 2 displays the chromatogram of each solution, and Figure 3 presents the spectral results of the control, demonstrating the absence of interference from the control solution.
2.4.7. Sample Analysis
A total of 104 batches of pharyngiyan tablet samples were individually prepared into test solutions following the method outlined in Section 2.3.2. The samples were determined under the conditions specified in Section 2.3.4, applying the external standard method to calculate the content of each tablet. The content was calculated based on the number of indicator components present in each tablet.
3. Results and Discussion
3.1. UPLC–TOF–MS/MS Compositional Analysis Results
UPLC–Q–TOF–MS/MS was applied to analyze samples from each enterprise, detecting 131 chemical components in the QC samples. These components included 31 flavonoids, 28 terpenoids and their glycosides, 13 organic acids, 11 volatile oils, 8 alkaloids, 8 saponins, 5 glycosides, 3 acetophenones, 3 amino acids, 3 tannins, 3 triterpenoids, 3 fatty acids, 3 saccharides, 2 vitamins, 2 quinones, 1 furan, 1 indole, 1 organic ester, 1 phenylpropanoid, and 1 stilbene. Table 3 summarizes the results.
3.2. Selection of QC Indicator Components for Pharyngiyan Tablets
The screening process involved selecting 31 flavonoids, 28 terpenes and their glycosides, and 13 organic acids from the entire component analysis of QC samples. The results of these three component types from samples of each enterprise were analyzed, considering variations in process parameters. Common components stable and measurable across different enterprises were identified based on their response intensity. Subsequently, the three common component types (10 flavonoids, 11 terpenes, their glycosides, and 6 organic acids) were analyzed using orthogonal partial least squares discriminant analysis (OPLS–DA) data. Components with a variable importance in projection (VIP) value > 1 were selected as the primary components to differentiate the quality difference between enterprises. Ingredients were screened for simultaneous fulfillment of the following conditions: attributability, uniqueness, low production process impact, high measurability, and low control costs. Ultimately, five index components, gallic acid, paeoniflorin, rutin, baicalin, and harpagoside, were selected based on the conditions above.
3.3. Analysis of the Multi-Indicator Content Determination Results
The hierarchical cluster analysis (HCA) results showed that the samples used were divided into two categories, one corresponding to enterprise E and the other for the remaining enterprises (Figure 4). The OPLS–DA results showed well-defined clustering of the firms, forming elongated oval shapes (Figure 5). This finding suggested that the differences between groups were greater than the variation between batches in groups. Results are represented using a boxplot generated with GraphPad (Figure 6). The content of the same ingredient varied significantly across enterprises. Specifically, the quantity of paeoniflorin was higher in Enterprise G, while the amount of rutin was unusually high in Enterprise E. The multi-indicator data were subjected to principal component analysis (PCA) using SIMCA software. Figure 7 shows the results. The increased and more distant dispersion observed between different color groups showed more significant quality disparities among samples from various manufacturers. The scores of each batch of Enterprise E were clear outliers, warranting a focus on the quality of its products. Variations among results from batches of the same enterprise were minimal, demonstrating minimal differences between batches and a stable enterprise process.
From the results of multi-indicator content determination, the variations in content indicators among samples from different manufacturers were significant (Figure 6). For instance, the rutin components in E enterprises were nearly 100 times higher than those in other manufacturers. In addition, the total flavonoids in the samples of the enterprise originated from the rutin component rather than the cumulative total of its flavonoid components, as demonstrated by the results of previous experiments of the group. This result indicated a potential risk of Enterprise E illegally adding rutin monomers to pass standard tests. The harpagoside content of Enterprise J was 0 μg, but comprehensive ingredient analysis detected the characteristic components of Scrophulariae Radix, confirming its presence in the product. Other values of Enterprise J were generally lower than those of other enterprises, and its effective components were thus potentially insufficient. This result could stem from inferior-quality raw materials, deviation from the prescribed amount of ingredients, or excessive destruction of active ingredients due to high-temperature steam concentration processes. Variations among enterprises may also arise from differences in extraction methods, equipment, crushing techniques, and other conditions. Therefore, relevant departments should urge manufacturers to control the quality of raw materials, conduct rigorous inspections, and adhere to standardized feeding practices.
Different from previous assays, in this study, we achieved high expression of different compound classes using whole-component analysis, rational selection of QC indicators, and a combination of wavelength-switching technology. In the case of the constituent (harpagoside) of the monarch drug Scrophularia ningpoensis Hemsl, for example, a comparison of the measurement results with previous data indicated a similar range of results, despite certain differences in the values, presumably caused by differences in the measurement method and the sample sources [12, 13].
4. Conclusions
In this study, we screened the QC indexes of pharyngitis tablets based on the concept of the holistic TCM view [27, 28] and the results of a whole-component analysis of Chinese patent medicine. We established an HPLC–DAD wavelength–switching method for the online determination of multi-indicator and multicategory components. When comparing the results of this study with those of previous publications [12, 13], it is important to point out that the present study overcomes the limitation of previous single-wavelength differences in the absorption degree of different substances and responds to the differences in quality of proprietary Chinese medicines by enlarging the sample size. This method allows for the rapid, economical, efficient, and comprehensive control and product quality evaluation of pharyngitis tablets at each enterprise and provides technical support for scientific research. However, unfortunately, ways to achieve consistency in Chinese patent medicine quality through this route should be urgently addressed.
The reference list from the paper itself. Each links out to its DOI / PubMed record.
- 1Zhou C. He M. Peng C. Pharmacokinetic and Lipidomic Assessment of the In Vivo Effects of Parishin A-Isorhynchophylline in Rat Migraine Models Journal of Analytical Methods in Chemistry 2020202011110.1155/2020/9101598 PMC 736228432695549 · doi ↗ · pubmed ↗
- 2Nan G. Guangli Y. Hui S. Version Updating of Strategy for Drug Discovery Based on Effective Constituents of Traditional Chinese Acupuncture and Herbal Medicine 20233158179
- 3Tan Y. Tan L. Huang S. Lu J. Yu L. Content Determination of Active Component in Huangqi Yinyanghuo Group and its Effects on h TERT and Bcl-2 Protein in Osteosarcoma Journal of Analytical Methods in Chemistry 201420141610.1155/2014/7693502-s 2.0-84908318691 PMC 421117525371846 · doi ↗ · pubmed ↗
- 4Chinese Pharmacopeia Commission Drug Specifications Promulgated by Ministry of Public Health, P R China (Chinese Materia Medica Preparation, Volume 02)[S] 1998
- 5YBZ The State Food and Drug Administration National Drug Standard
- 6YBZ The State Food and Drug Administration National Drug Standard
- 7YBZ The State Food and Drug Administration National Drug Standard
- 8WS The State Food and Drug Administration National Drug Standard