Do positions in individual-based ectoparasite-small mammal networks differ between female and male hosts?
Boris R. Krasnov, Maxim V. Vinarski, Natalia P. Korallo-Vinarskaya, Michal Stanko

TL;DR
This study explores how the positions of female and male hosts differ in host-parasite networks and how these differences affect network structure.
Contribution
The study reveals sex-based differences in host positions within individual-based host-parasite networks despite similar infestation levels.
Findings
Female and male hosts often differ in their positions in host-parasite networks.
Sex-based differences affect the structure of host-flea but not host-mite networks.
Differences vary between host species, parasite types, and regions.
Abstract
We investigated the contributions of female and male hosts to the structure of individual-based host-parasite networks, using 21 species of small mammals from two regions (West Siberia and eastern Slovakia) and two taxa of ectoparasitic arthropods (fleas and gamasid mites). We asked whether (a) the values of individual host position indices (individual strength, nested rank, the degree of individual specialization, and the eigenvector centrality) and individual host roles differed between female and male hosts in each network and (if yes) were associated with differences in the infestation levels, (b) differences between sexes (if any) were further translated into differences in the network structure (nestedness and network specificity), and (c) differences between female and male hosts in their positions and roles and the effect of these differences on the network structure differed…
Genes, proteins, chemicals, diseases, species, mutations and cell lines named across the full text — each resolved to its canonical identifier and authoritative record.
Click any figure to enlarge with its caption.
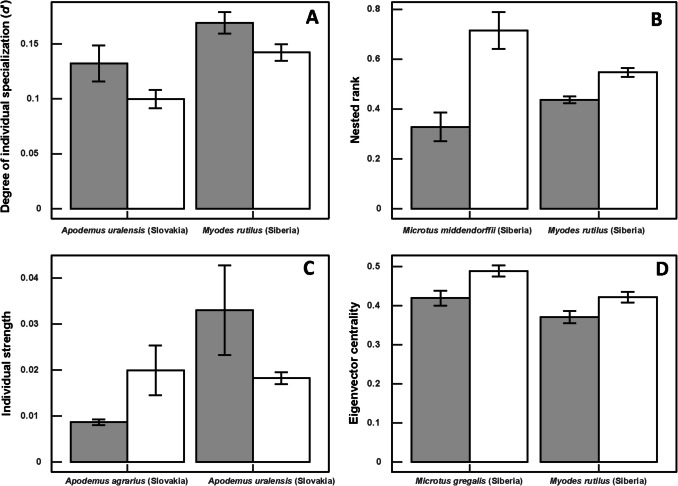 Figure 1
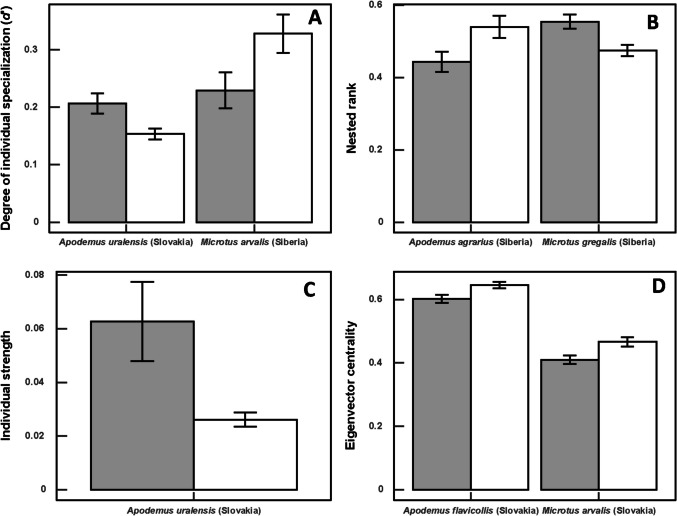 Figure 2
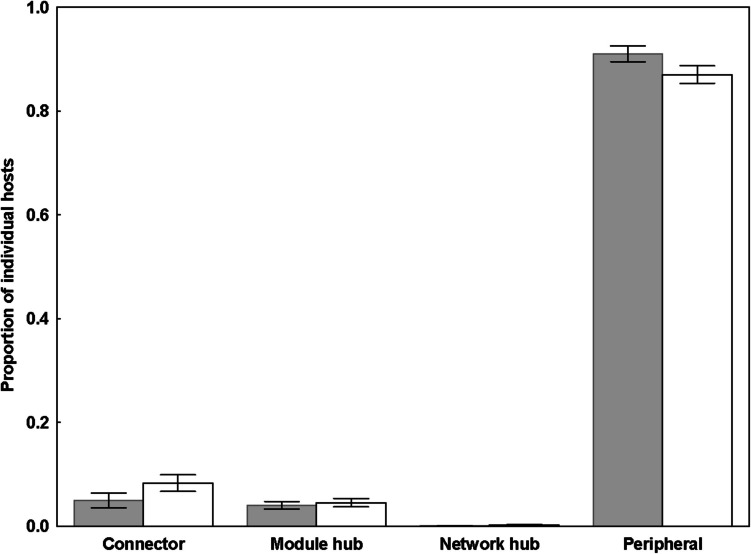 Figure 3
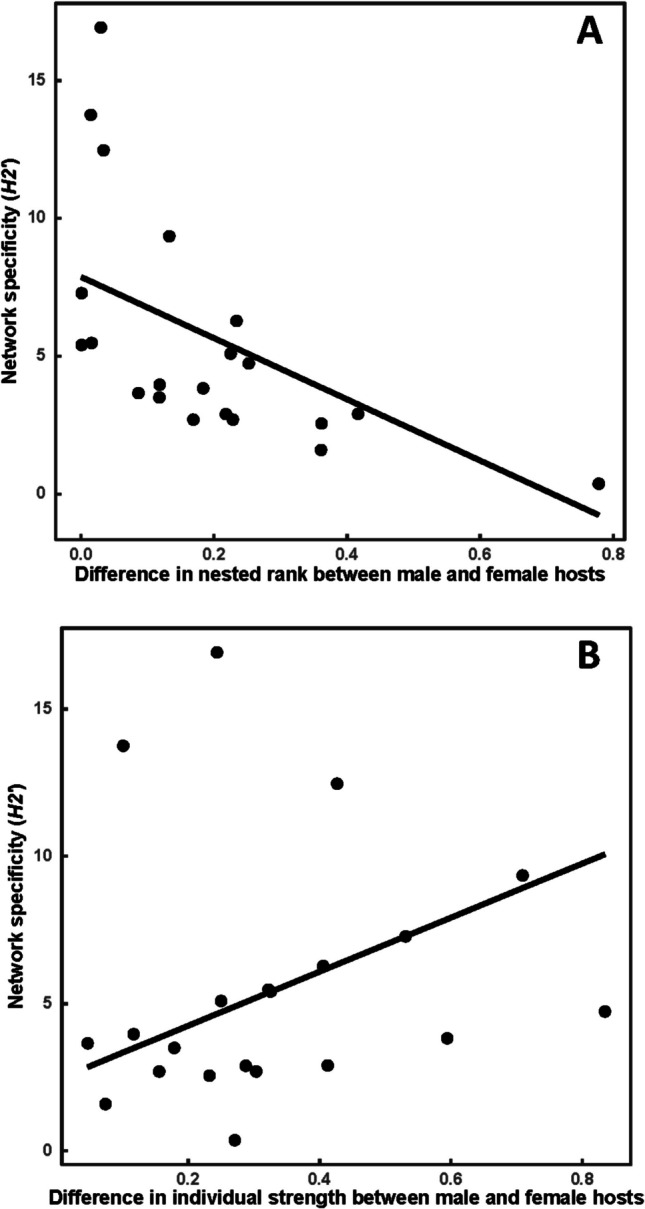 Figure 4
- —https://doi.org/10.13039/501100003977Israel Science Foundation
- —Slovak Research and Development Agency
- —Ben-Gurion University
Peer Reviews
No public reviews on file for this paper yet. If you reviewed it on a platform where reviews are public (OpenReview, ICLR, NeurIPS, ICML), you can paste yours below so the community can read it here.
Videos
No videos yet. Explain this paper in a talk, walkthrough, or lecture? Add one.
Taxonomy
TopicsPlant and animal studies · Insect and Pesticide Research · Animal Behavior and Reproduction
Introduction
Sex-biased parasitism is one of the most common parasitological phenomena (Zuk and McKean 1996; Poulin 1996a, b; Perkins et al. 2008; Krasnov et al. 2012; Cozzarolo et al. 2019; Rosso et al. 2020). The term “sex-biased” parasitism is often synonymised with “male-biased” parasitism (e.g., Matthee et al. 2009; Stephenson et al. 2016). This is because, in many host-parasite associations, especially small mammals, males are more heavily parasitized than females in terms of parasite abundance, prevalence, and/or species richness (Behnke et al. 1999; Moore and Wilson 2002; Morand et al. 2004; Krasnov et al. 2005). The proposed mechanisms for this are (a) the greater androgen levels in males, which suppress the immune function (the so-called immunological handicap hypothesis), thus making males more vulnerable to parasites (Folstad and Karter 1992; Zuk 1996; Zuk and McKean 1996), (b) the greater mobility of males (particularly, in mammals), which increases their chances of encountering parasites (Krasnov et al. 2005), and (c) the larger male body size in many species, causing males to be larger targets for parasites and to trade off energy expenditure for growth and immunity (Morand et al. 2004; Kiffner et al. 2011). These mechanisms likely act together rather than separately (Krasnov et al. 2012). However, male-biased parasitism, albeit frequently observed, is not universal. In fact, in bat-batfly and bat-mite associations, females are often more heavily parasitized than males (Dick et al. 2003; Christe et al. 2007). Moreover, manifestations of male- or female-biased parasitism can vary between parasite taxa in the same host species (Hillegass et al. 2008; Matthee et al. 2009) or in the same host-parasite association, depending on environmental factors (Krasnov and Matthee 2010).
Sex-biased parasitism has important consequences for host and parasite individuals (Christe et al. 2007; Córdoba-Aguilar and Munguía-Steyer 2013), populations (Ferrari et al. 2004), and communities (Krasnov et al. 2011). For example, Krasnov et al. (2011) reported that the non-randomness of Palearctic rodents’ flea infracommunities was expressed more strongly in male than in female hosts, suggesting that males were the main drivers of this structural pattern. Sex-biased parasitism has been reported to be accompanied by differential roles played by male and female hosts in parasite transmission (e.g., Grear et al. 2009, 2012). This suggests that male and female hosts may take different positions and/or play different roles in individual-based host-parasite networks (Godfray 2013; Xu et al. 2022). As a result, male and female hosts may not be equally important in the processes acting in the networks (Delmas et al. 2019). Consequently, differences in the positions of male and female hosts in individual-based networks may affect the network’s structure. To the best of our knowledge, this has never been studied in host-parasite networks.
Here, we attempted to fill this gap by investigating the contributions of female and male hosts to the structure of individual-based host-parasite networks, using 21 species of small mammals from two regions (West Siberia and eastern Slovakia) and two taxa of ectoparasitic arthropods (fleas and gamasid mites) as model associations. We characterized individual host positions using four indices (individual strength, nested rank, the degree of individual-level interaction specialization, and the eigenvector centrality; see definitions in the “Materials and Methods” section). Bipartite ecological networks (such as host-parasite networks) are characterized by a greater or lesser degree of modularity (i.e., the degree of network subdivision into separate subsets of frequently interacting species) (Bascompte and Jordano 2013). Host individual roles within a network were classified based on the interactions of each host individual with parasite species within its module and its interactions with parasites from other modules (Guimerà and Amaral 2005). We described the structure of each network using two indices (nestedness and network specificity). A nested network consists of a core group of generalist species interacting with each other and with strict specialist species that only interact with generalists (Nielsen and Bascompte 2007). The degree of specificity of a host-parasite network depends on and highly correlates with the level of parasite host specificity (Blüthgen et al. 2006). We asked whether (a) the values of individual host position indices and individual host roles differed between female and male hosts in each network and (if yes) were associated with differences in the infestation levels, (b) differences in the network positions between sexes (if any) were further translated into differences in the network structure, and (c) differences between female and male hosts in their positions and roles and the effect of these differences on the network structure differed between host-flea and host-mite networks.
Materials and methods
Data on flea and gamasid mite distributions across host individuals
Data on flea and gamasid mite distributions across individual hosts were taken from surveys of ectoparasites of rodents and shrews carried out in 1960–2013 in West Siberia (compiled from the database of the Omsk Research Institute of Natural Foci Infections (Omsk, Russian Federation) by NPKV) and in 1986–2000 in eastern Slovakia. For mites, we took into account only obligatory and facultatively haematophagous species collected from host bodies. Details on sampling design and methods of ectoparasite collection and identification can be found in Krasnov et al. (2019) for Siberia and Stanko et al. (2002) for Slovakia. In Siberia and Slovakia, sampling was carried out across 108 and 13 sampling sites, respectively. For further analyses, we selected host species in which at least 20 male and 20 female individuals, from the same sampling site across all sampling periods, were found to be parasitized by at least one flea or one gamasid mite species. This resulted in the selection of 15 host species from Siberia and six host species from Slovakia (Tables S1–S2 in the Electronic Supplementary Material). Siberian host species were Apodemus agrarius, Arvicola amphibius, Craseomys rufocanus, Microtus agrestis, Microtus arvalis, Microtus gregalis, Microtus middendorffii, Microtus oeconomus, Myodes glareolus, Myodes rutilus, Sicista betulina, Sorex araneus, Sorex isodon, Sorex minutus, and Sorex tundrensis. Slovakian species were A. agrarius, Apodemus flavicollis, Apodemus uralensis, M. arvalis, M. glareolus, and S. araneus. These hosts were parasitized by 29 flea and 38 mite species in Siberia and by 26 flea and 17 gamasid mite species in Slovakia (TablesS3–S4 in the Electronic Supplementary Material).
Individual host infestation levels and positions in networks
For each host and either flea or mite species, we constructed an interaction network, i.e., a matrix of interactions, with parasite species in columns and host individuals in rows and with entries being the numbers of individual parasites of a given species recorded on a given individual host. For host species that occurred in both Siberia and Slovakia, this was done separately for each region. For each host individual in each network, we calculated the numbers of flea or mite individuals and species. Then, we calculated an individual host position in a network using four indices, namely species strength, nested rank, the degree of species-level interaction specialization d′, and the eigenvector centrality. Species strength (= individual host strength, in our case) (Jordano 1987; Bascompte et al. 2006) is a quantitative measure of a given resource’s relevance (i.e., an individual host) for a consumer community (all parasite species). It is calculated as the sum of the dependencies (the relative frequency of interactions) of all parasite species on that individual host. A host individual’s nested rank is the rank of this individual in a network matrix re-arranged for maximal nestedness (Alarcon et al. 2008). In our case, a perfectly (i.e., maximally) nested interaction matrix is a matrix in which specialist individual hosts interact with parasite species that represent perfect subsets of parasites with which generalist individual hosts interact. The degree of species-level (individual-level, in our case) specialization (d′) (further referred to as the degree of specialization) (Blüthgen et al. 2006, 2007; Blüthgen 2010) compares the frequency distribution of an individual host’s interactions with a null distribution when this host interacts with the random parasite sets, thus describing the deviation from a neutral configuration of associations. All the abovementioned indices were calculated using the “specieslevel” function of the “bipartite” (ver. 2.21) package (Dormann 2011; Dormann et al. 2008) with the option level = “lower” (i.e., for hosts and not for parasites) and nested.normalise = TRUE. The latter option divides the nested rank − 1 by the number of species − 1, so that the nested rank ranges between 0 (most generalist) and 1 (most specialized). The eigenvector centrality is a measure of a species’ influence in a network that takes into account the importance of its neighbors (Bonacich 1987; Jordán and Scheuring 2004; Allesina and Pascual 2009; Delmas et al. 2019). Each network (bipartite, by definition) was projected to a unipartite network and transformed into the network graph object, using the “projecting_tm” and “tnet_igraph” functions, respectively, of the R package “tnet” (ver. 3.0.16) (Opsahl 2009). Then, the eigenvector centrality was calculated using the “evcent” function of the package “igraph” (ver.1.5.1) (Csardi and Nepusz 2006; Csárdi et al. 2023) implemented in the R (ver. 4.4.2) statisticalenvironment (R Core Team 2024).
Individual host roles in networks
To define the roles of each individual host (sensu Stouffer et al. 2012), we computed modules for each network (groups of nodes that are more connected to each other than to other nodes), using the “computeModules” function of the “bipartite” package. Then, the role of an individual host was identified according to its location in a two-dimensional space of within-module degree z and between-module connectivity c (= participation coefficient P of Guimerà and Amaral (2005)). Species characterized by (a) low z and c were considered as peripherals, (b) low z and high c as connectors, (c) high z and low c as module hubs, and (d) high z and high c as network hubs. Critical values of z and c were calculated based on the distribution of the data as 95 percentiles, separately for each network. Then, z and c values for each host individual were calculated using the “czvalues” function of the “bipartite” package.
Network structures
We characterized the structure of each network using two indices, namely nestedness and network specificity (H2′). Nestedness was calculated as the NODF index (nestedness based on paired overlap and decreasing fill; Almeida-Neto et al. 2008). Network specificity (H2′) is a network-level degree of specialization ranging between zero and unity (complete specialization), calculated in comparison to no specializations (Blüthgen et al. 2006). These indices were computed with the “networklevel” function of the “bipartite” package. Because networks differed in the numbers of host individuals, parasite species, and interactions, we standardized the indices using null models (with the “vaznull” function of the “bipartite” package, constructing 1000 reshuffled matrices) and Z-scores.
Data analyses
To test for the within-network difference between female and male hosts in the numbers of ectoparasite individuals, we applied negative binomial regression using the R package “MASS” (ver. 7.3–65) (Venables and Ripley 2002). The difference between sexes in the number of parasite species was tested with generalized linear models using the R package “stats” with the option “family = poisson.” Then, we tested for the differences between male and female hosts in their network positions (separately for each host-flea and host-mite network), represented by a combination of the four abovementioned indices, applying distance-based multivariate analyses of variance (db_MANOVAs), implemented in the R package “PERMANOVA” (ver. 0.2.0) (Vicente-Gonzalez and Vicente-Villardon 2021). Db_MANOVA is a non-parametric multivariate generalization of a traditional ANOVA that allows comparing the within-group and the between-group dissimilarities (Anderson 2001) and, thus, testing for the differences between two or more groups. Pairwise dissimilarities, in the combination of the position indices between female and male hosts of the same species, were calculated using the Pythagorean coefficient, and the p-values were obtained by 10,000 random permutations. However, db-MANOVA did not provide information on which specific position index contributes the most to female-male differences (if any) in their network positions. Therefore, we further tested for significant differences between female and male positions, described by each of the position indices, by applying univariate permutational ANOVAs with 10,000 random permutations of host individuals between sexes. This was carried out using the R package “RRPP” (ver. 2.1.2) (Collyer and Adams 2018).
For the across-network analyses, we calculated the proportions of individual female or male hosts playing one of the four network roles for each network. Then, we compared the proportions of individual hosts playing a given role between females and males across all host species, using generalized linear mixed models (GLMM), with species as a random factor and the beta distribution implemented in the R package “glmmTMB” (ver. 1.11.11) (Brooks et al. 2017). Because the beta distribution considers the distribution of the variable ranging from 0 to 1 and not attaining these extreme values, prior to analyses, we added 0.0000001 to all 0 s and subtracted 0.0000001 from all 1 s.
We tested whether network structure, represented by nestedness and network specificity, is affected by differences between female and male positions. We calculated sex differences in each position index, in each network, as the natural logarithm of the mean male-to-female or female-to-male ratio (depending on whether the mean value of an index was greater in males or females). Because our data represented values for different species, we applied phylogenetic generalized linear models (PGLS; Freckleton et al. 2002), with NODF or H2′ as a response variable and the four position indices as explanatory variables. This was done separately for host-flea and host-mite networks. A host phylogenetic tree (topologies and branch lengths) was constructed from a subset of 1000 trees, taken randomly from Upham et al.’s (2019) 10,000 species-level birth–death tip-dated completed trees for 5911 mammal species (https://vertlife.org/). From this subset, a consensus tree was built using the “consensus.edge” function of the R package “phytools” (ver. 2.4–4) (Revell 2012). The host species that occurred in both Siberia and Slovakia were considered sister species, and thus, a length of 1 was assigned to all branches. PGLSs were run using the R package “mmodely” (ver. 0.2.5) (Schruth 2023). First, we compiled a list of models with all possible combinations of the explanatory variables, using the “get.model.combos” function. Then, we ran all these models with the “pgls.iter” function and selected the best model based on Akaike information criterion, using the “select.best.models” function. Finally, we ran the best model separately for each of the two indices of the network structure and for host-flea and host-mite networks.
We intentionally did not apply the adjustment of the alpha level for multiple comparisons (e.g., Bonferroni corrections). Although this can easily be done, this procedure has been strongly criticized by both statisticians and ecologists because it can inflate the rate of type II errors (Rothman 1990; Perneger 1998; Moran 2003; Garcia 2004; Nakagawa 2004).
Results
Median values with interquartile ranges of the numbers of flea and mite individuals and species collected from each individual female or male host are presented in Supplementary Tables S5–S8. Significant differences between female and male hosts in counts of ectoparasite individuals were detected in a few host species only. For fleas, they were Siberian M. agrestis and M. gregalis and Slovakian A. flavicollis (z = 3.11–4.62, respectively, p < 0.001 for all). For mites, significant difference between sexes were found in three Siberian hosts (A. agrarius, M. gregalis, and M. rutilus; z = − 2.15–7.69, p < 0.03 for all) and three Slovakian hosts (A. uralensus, M. arvalis, and M. glareolus; z = − 4.95–7.68, p < 0.00q for all). Whenever the difference between female and male hosts was significant, the counts of fleas were greater in males than in female hosts, whereas the counts of mites were greater in males of M. gregalis, M. arvalis, and M. glareolus, but in females of the remaining three host species. Significant differences in ectoparasite species richness were detected in one Siberian and one Slovakian host for fleas (M. gregalis and A. flavicollis, respectively; z = 1.99–2.16, p < 0.05 for both) and one Siberian host for mites (M. gregalis; z = 2.61,* p* = 0.01). In all three species, male hosts harbored a greater number of ectoparasite species.
The results of the db_MANOVAs demonstrated that individual host positions, measured as a combination of the four position indices, differed significantly between female and male hosts (a) in nine of 15 Siberian hosts and three of six Slovakian hosts in host-flea networks (Table 1) and (b) in seven of 15 Siberian hosts and five of six Slovakian hosts (Table 2) in host-mite networks. In the same host species occurring in both regions, a difference between females and males in their network position was detected either in both regions (e.g., A. agrarius in host-flea networks; Table 1) or in one of the two regions only (e.g., M. arvalis in host-mite networks; Table 2). Table 1. Summary of distance-based multivariate analyses of variance (db-MANOVAs) testing for differences between male and female hosts in their network properties (degree of species specialization, nested rank, individual strength, and the eigenvector centrality) in the individual-based host-flea networks from two regionsRegionSpeciesPseudo-F**pSiberiaA. agrarius16.09 < 0.001A. amphibius0.450.64C. rufocanus1.180.29M. agrestis3.780.02M. arvalis0.500.60M. gregalis3.360.04M. middendorffii3.320.03M. oeconomus1.120.31M. glareolus0.660.53M. rutilus12.82 < 0.001S. betulina4.950.01S. araneus11.12 < 0.001S. isodon3.250.03S. minutus3.610.04S. tundrensis0.650.55SlovakiaA. agrarius20.07 < 0.001A. flavicollis0.240.82A. uralensis4.510.02M. arvalis3.760.03M. glareolus1.050.30S. araneus0.800.44Table 2Summary of distance-based multivariate analyses of variance (db-MANOVAs) testing for differences between male and female hosts in their network properties (degree of species specialization, nested rank, individual strength, and the eigenvector centrality) in the individual-based host-mite networks from two regionsRegionSpeciesPseudo-F**pSiberiaA. agrarius2.890.04A. amphibius0.560.58C. rufocanus1.190.32M. agrestis0.890.40M. arvalis1.140.35M. gregalis8.44 < 0.001M. middendorffii0.550.58M. oeconomus1.600.15M. glareolus3.630.04M. rutilus12.51 < 0.001S. betulina2.900.04S. araneus2.900.04S. isodon4.030.02S. minutus0.370.72S. tundrensis0.660.51SlovakiaA. agrarius7.24 < 0.001A. flavicollis3.440.04A. uralensis6.78 < 0.001M. arvalis3.620.04M. glareolus2.720.06S. araneus3.330.03
In all hosts for which a significant difference between sexes in combined position indices was detected, these differences between females and males were found in one to all four separate indices (Tables 3, 4). In host-flea networks, values of the degree of specialization differed significantly between females and males in two species (being greater in male hosts; see illustrative example in Fig. 1A), values of nested rank in 10 species (greater in female hosts; Fig. 1B), values of individual strength in two species (greater in either female or male hosts; Fig. 1C), and values of eigenvector centrality in four species (greater in male hosts, Fig. 1D) (Table 3). Table 3. Mean (± S.E.) values of the network position indices of female (Fl) and male (Ml) hosts in the individual-based host-flea networks from two regions. The results are shown only for hosts and indices for which significant differences between males and females were detected. Indices are as follows: NR, nested rank; d′, the degree of specialization; IS, individual strength; EC, the eigenvector centralityRegionSpeciesIndexFlMlF**pSiberiaA. agrariusNR0.43 ± 0.030.54 ± 0.036.060.02M. agrestisEC0.40 ± 0.030.51 ± 0.035.700.02M. gregalisEC0.42 ± 0.020.51 ± 0.017.940.004M. middendorffiiNR0.33 ± 0.060.71 ± 0.0717.45 < 0.001M. rutilus**d′0.17 ± 0.010.14 ± 0.014.990.02NR0.44 ± 0.010.55 ± 0.0220.45 < 0.001EC0.32 ± 0.020.42 ± 0.015.820.01S. betulinaNR0.36 ± 0.030.55 ± 0.0312.16 < 0.001S. araneusNR0.40 ± 0.020.58 ± 0.0323.26 < 0.001S. isodonNR0.44 ± 0.040.56 ± 0.044.95 < 0.001S. minutusNR0.40 ± 0.030.58 ± 0.049.33 < 0.001SlovakiaA. agrariusNR0.43 ± 0.010.55 ± 0.0224.70 < 0.001IS0.01 ± 0.00060.02 ± 0.013.350.04A. uralensis**d′0.13 ± 0.020.10 ± 0.00083.840.04NR0.44 ± 0.020.53 ± 0.034.630.04IS0.03 ± 0.010.018 ± 0.0014.120.03EC0.39 ± 0.030.46 ± 0.024.490.04M. arvalisNR0.47 ± 0.020.54 ± 0.035.230.02Table 4Mean (± S.E.) values of the network position indices of female (Fl) and male (Ml) hosts in the individual-based host-mite networks from two regions. The results are shown only for hosts and indices for which significant differences between males and females were detected. Indices are as follows: NR, nested rank; d′, the degree of specialization; IS, individual strength; EC, the eigenvector centralityRegionSpeciesIndexFlMlF**pSiberiaA. agrariusNR0.44 ± 0.030.54 ± 0.034.880.02M. arvalis**d′0.23 ± 0.030.33 ± 0.033.740.04M. gregalisNR0.55 ± 0.020.47 ± 0.028.58 < 0.001EC0.45 ± 0.020.52 ± 0.0114.54 < 0.001M. oeconomusNR0.44 ± 0.030.55 ± 0.043.500.02M. glareolusNR0.41 ± 0.030.59 ± 0.058.22 < 0.001M. rutilusNR0.39 ± 0.020.57 ± 0.0234.58 < 0.001S. betulinaNR0.30 ± 0.030.55 ± 0.0312.20 < 0.001S. araneusNR0.46 ± 0.020.54 ± 0.034.940.02S. isodon**d′0.30 ± 0.060.13 ± 0.045.130.03EC0.49 ± 0.090.76 ± 0.076.100.01SlovakiaA. agrariusNR0.46 ± 0.010.53 ± 0.0213.01 < 0.001A. flavicollisd′0.21 ± 0.020.15 ± 0.018.38 < 0.001NR0.44 ± 0.020.54 ± 0.028.65 < 0.001IS0.06 ± 0.010.03 ± 0.000210.11 < 0.001EC0.60 ± 0.010.65 ± 0.017.220.01M. arvalisd′0.17 ± 0.010.14 ± 0.016.910.01EC0.41 ± 0.010.47 ± 0.018.180.004M. glareolusEC0.36 ± 0.030.44 ± 0.025.800.02S. araneusNR0.27 ± 0.030.62 ± 0.0618.96 < 0.001Fig. 1Illustrative examples demonstrating mean (± S.E.) values of A the degree of specialization d′; B nested rank; C individual strength; and D the eigenvector centrality of female (white bars) and male (gray bars) host individuals in host-flea networks from two regions
In host-mite networks, values of the degree of specialization differed significantly between sexes in four species (greater in male hosts in three of them; see illustrative example in Fig. 2A), values of nested rank in 10 species (greater in male hosts in nine of them; Fig. 2B), values of individual strength in one species (Slovakian A. uralensis, greater in female hosts; Fig. 2C), and values of eigenvector centrality in five species (Fig. 2D) (Table 4).Fig. 2. Illustrative examples demonstrating mean (± S.E.) values of A the degree of specialization d′; B nested rank; C individual strength; and D the eigenvector centrality of female (gray bars) and male (white bars) host individuals in host-mite networks from two regions
The proportion of individual hosts playing different roles did not differ between females and males in host-flea networks (GLMM, z = 0.38, p = 0.70). On the contrary, these proportions differed significantly between sexes in host-mite networks (GLMM, z = 3.20, p = 0.001). Proportions of the connector and peripheral males were greater and lesser (albeit not substantially), respectively, than those of the connector and peripheral females (Fig. 3).Fig. 3. Proportions of female (gray bars) and male (white bars) host individuals playing different roles in host-mite networks
The best models explaining the effects of the differences between female and male hosts in their position index values on the network structure are presented in Table 5. The degree of nestedness in host-flea networks was not affected by differences between female and male hosts in any position index. However, larger differences between the sexes in nested rank and individual strength corresponded to lesser and greater degrees of network specificity, respectively (Fig. 4). In host-mite networks, no effect of female-male differences in their positions was detected for either nestedness or network specificity. Table 5. The best models of the effects of female-male differences in the values of position indices on the indices of the structure of individual-based host-flea and host-mite networks. NODF, the degree of nestedness; H2′, network specificity; dEC, difference in the eigenvector centrality; dSS, difference between sexes in mean individual strength; dNR, difference between sexes in mean nested rank. Coefficients and their statistics are only shown for significant predictors; pc,* p*-value for a coefficient; pm,* p*-value for the whole modelParasiteIndex of structureEquationt**pcR^2^F**p_m_FleasNODFdEC + dSS0.283.100.07H2′ − 9.35dNR + 7.37dSS − 3.07, 2.640.01, 0.020.5610.220.01MitesNODFdSS0.122.140.13*H2′*dSS0.091.650.21Fig. 4Relationships (partial regression fits; see Table 5) between the specificity of individual-based host-flea networks (H2′) and the differences between female and male individuals in nested rank (A) and individual strength (B)
Discussion
We found that in the majority of individual-based host-ectoparasite networks, female and male hosts differed in their positions despite a general lack of differences in infestation levels, although the distribution of the roles played in a network mostly did not differ between the sexes. The extent of position differences between the sexes affected the structure of host-flea, but not host-mite, networks, in terms of the network specificity. In addition, the occurrence and the direction (i.e., the greater value of the position index in either female or male hosts) often differed (a) in the same host between host-flea and host-mite networks, (b) between host species within host-flea and host-mite networks, and (c) in the same host’s host-flea or host-mite networks between the two regions.
Among the indices of individual host position in a network, differences between sexes were most often found in the network rank of an individual host, with this rank being, in general, greater in males. Given the definition and the method of calculating this index (see above), this demonstrated that male hosts were more specialized in terms of interactions with the parasites than female hosts. In many hosts, these differences were not revealed when the mere numbers of ectoparasite individuals and species were compared between sexes. This is because the nested rank of each individual host considers not only the number of its links with parasites but also depends on the interactions by all other individuals in a network. The greater nested rank of male hosts suggests that they tended to be exploited by a subset of parasites exploiting female hosts (Bascompte et al. 2003). This could be because some parasite species likely prefer to exploit female rather than male hosts, whereas other parasites do not demonstrate any preference for host sex. For example, in experiments with the mite Spinturnix andegavinus and the bat Myotis daubentoni, mites preferentially selected female hosts (Christe et al. 2007). In contrast, the selection of male over female hosts has been demonstrated in experiments for the flea Xenopsylla ramesis and the gerbil Meriones crassus (Khokhlova et al. 2011). However, this discrimination was characteristic only for female and not male fleas.
In five of the six host-ectoparasite networks in which a significant difference in the degree of specialization between female and male hosts was detected, the mean value of this index was greater in females. Although the greater nested rank of male hosts demonstrates that they are more specialized than females in terms of their role in the nestedness pattern, females appeared to be more specialized in terms of the diversity of partners and their availability, as indicated by the degree of specialization values (Blüthgen et al. 2006). This contradiction suggests that nested rank and d′ capture different facets of specialization (Dormann 2011). In the same host-parasite network, males could be more specialized than females in the network context (nested rank), but more specialized than females, being exploited by a greater diversity (not necessarily a greater number) of parasite species (given that d′, in our case, simultaneously considers the number parasite species and their abundances). This could be the case, for example, for the host-flea networks of M. rutilus from Siberia and A. uralensis from Slovakia (Table 3). On the one hand, the lesser specialization of female hosts, expressed as nested rank (i.e., concerning pure numbers of parasite species), may be associated with the long time periods they spend in their burrows/nests (especially during their reproductive period when most of the sampling was carried out). These burrows or nests are the main places where nidicolous ectoparasites, such as fleas and mites, reside (Dowling 2006; Krasnov 2008). On the other hand, males are characterized by greater mobility, larger home ranges, and short-term visits to the burrows of other conspecific and heterospecific hosts (Krasnov 2008). This may facilitate their repetitive encounters with various parasites, resulting in high parasite diversity in terms of their relative abundances.
Significant differences between sexes in individual strength were only detected in two host-flea networks and one host-mite network. Strength reflects the dependence of parasites on each host individual (Dormann 2011). Therefore, the females and males of most of the host species considered in our study are equally relevant for all parasite species exploiting this host species. However, the eigenvector centrality values were consistently greater in male than in female hosts (at least, in the networks in which significant differences between sexes were detected). This indicates that males could be more influential than females in these networks, via their contribution to network stability and by sharing parasites mainly with host individuals that, in turn, share many parasites with many other host individuals (Anderson and Sukhdeo 2011; Dallas et al. 2019). The most likely reason behind this is the abovementioned high mobility and large home ranges of males that lead to frequent contacts with other hosts and visits to their burrows.
The extent of the differences between female and male hosts in their network positions was further translated into variation in the entire network structure, in terms of the network specificity, but not in the degree of nestedness, and only for host-flea, but not host-mite, networks. Furthermore, variation in the host-flea network specificity was associated with sex difference variation in the nested rank and species strength, but not in the eigenvector centrality and the degree of specialization. The greater network specificity was detected in networks with lesser levels of female-male differences in their nested ranks and greater levels of differences in their strength. In host-parasite networks, network specificity is positively correlated with the parasite’s level of host-specificity, decreasing competition between them (Blüthgen et al. 2006; de Angeli Dutra and Poulin 2024). Therefore, greater levels of differences between the sexes in their strength are expected to be mainly characteristic for the networks with many host-specific flea species. Network specificity has also been reported to cause a decrease in the degree of nestedness (de Angeli Dutra and Poulin 2024). Consequently, smaller differences between female and male hosts in their nested ranks observed in the highly specific networks suggest that greater differences in nested ranks should be found in highly nested networks. However, we did not find any association between differences in nested ranks and the degree of the network nestedness, although there was a negative correlation between network specificity and the degree of nestedness (Spearman r = − 0.81, p < 0.05). We recognize that these explanations are highly speculative and warrant further investigations.
An important finding of this study is that differences in the network positions between female and male hosts were detected (a) in some, but not other, host species; (b) in either the host-flea or the host-mite networks (but not both) of the same host species within a region; and (c) in either the host-flea or the host-mite networks of the same host species but only in either Siberia or Slovakia. This variation likely results from multiple differences between hosts and their interactions with fleas or mites in different environments. For example, Apodemus mice are mostly solitary (e.g., Stradiotto et al. 2009), whereas many Microtus voles are social (e.g., Dobly and Rozenfeld 2000), which might cause a greater frequency of ectoparasite exchange between females and males of the latter than of the former. Sex differences in spatial behavior may or may not occur in the same species in different localities, depending on environmental factors (e.g., Bowers et al. 1996). Sex differences in immunocompetence that may affect the position of a female or a male in a host-parasite network are expressed differently depending on environmental factors and population density (Beldomenico et al. 2008). Environmental factors may also affect the structure of ectoparasite infracommunities (i.e., parasite assemblages on host individuals) (Krasnov et al. 2019). This may lead to differential network structure patterns in the same host-parasite associations but from different localities (Junker et al. 2022). The combined effect of the environment on sex differences in spatial behavior or immunity and ectoparasite infracommunity structure could thus explain why the network positions differ between female and male hosts in some, but not other, environments. In addition, the pattern of parasitism differs substantially between fleas and mites, with fleas being obligatory haematophagous, whereas many gamasid mite species only facultatively feed on host blood (Radovsky 1985). This results in different structural patterns of host-flea and host-mite networks, including (but not limited to; see Krasnov et al. 2019) the effect of individual host sex on its network position.
In conclusion, the answer to the question “do positions in the individual-based host-ectoparasite networks differ between female and male hosts?” is not straightforward. These positions may or may not differ depending on a complex interplay of host-associated, parasite-associated, and environmental factors.
Supplementary Information
Below is the link to the electronic supplementary material.Supplementary file1 (DOCX 38 KB)
The reference list from the paper itself. Each links out to its DOI / PubMed record.
- 1Cozzarolo CS, Sironi N, Glaizot O, Pigeault R, Christe P (2019) Sex-biased parasitism in vector-borne disease: vector preference? P Lo S ONE 14. 10.1371/journal.pone.021636010.1371/journal.pone.0216360 PMC 649728331048933 · doi ↗ · pubmed ↗
- 2Csardi G, Nepusz T (2006) The igraph software package for complex network research. Inter J Complex Sys 1695. https://igraph.org
- 3Csárdi G, Nepusz T, Traag V, Horvát Sz, Zanini F, Noom D, Müller K (2023) igraph: network analysis and visualization in R. 10.5281/zenodo.7682609, R package version 1.5.1, https://CRAN.R-project.org/package=igraph
- 4R Core Team (2024) R: a language and environment for statistical computing. R Foundation for Statistical Computing, Vienna. https://www.R-project.org
- 5Schruth DM (2023) mmodely: modeling multivariate origins determinants - evolutionary lineages in ecology. R package version 0.2.5. https://CRAN.R-project.org/package=mmodely
- 6Vicente-Gonzalez L, Vicente-Villardon JL (2021) PERMANOVA: multivariate analysis of variance based on distances and permutations. R package version 0.2.0. https://CRAN.R-project.org/package=PERMANOVA