Search for Mutations Connected With Non‐Response to Anti‐EGFR Therapy in mCRC in the Morphologically Defined Regions of Primary Tumours
Martina Čarnogurská, Valeriia Serhiivna Vasylieva, Táňa Macháčková, Marie Boudná, Lucie Pifková, Jana Orlíčková, Tina Catela Ivkovic, Ondrej Slabý, Beatrix Bencsiková, Vlad Popovici, Eva Budinská

TL;DR
This study shows that analyzing specific tumor regions can reveal mutations linked to poor response to anti-EGFR therapy in colorectal cancer.
Contribution
The study introduces a method to connect tumor morphology with mutation patterns to predict therapy response in CRC.
Findings
Mutations in BRAF and KRAS were uniquely found in non-responders and linked to specific tumor morphologies.
Morphology-based mutation analysis provided more detailed insights than whole-tumor analysis.
Serrated and mucinous morphologies were associated with BRAF mutations, while mucinous and desmoplastic morphologies were linked to KRAS mutations.
Abstract
Emerging evidence suggests that tumour morphological heterogeneity may influence mutational profiles relevant to therapy response. In this pilot study, we aimed to assess whether mutations identified within specific morphological patterns or at the invasion front correlate with shorter time to progression after anti‐EGFR therapy, as compared to whole‐tissue analysis. We investigated genetic mutations in 142 samples from primary tumours of 39 KRAS wild‐type metastatic colorectal cancer (CRC) patients receiving anti‐EGFR therapy. Deep next‐generation sequencing was performed on whole‐tumour sections and six morphology‐defined tumour regions. Mutations in genes linked to anti‐EGFR therapy response (KRAS, BRAF, NRAS, PTEN and PI3KCA) were found uniquely in the non‐responder group, with substantial variability across morphological sub‐regions. BRAF mutations were aligned with serrated and…
Genes, proteins, chemicals, diseases, species, mutations and cell lines named across the full text — each resolved to its canonical identifier and authoritative record.
Click any figure to enlarge with its caption.
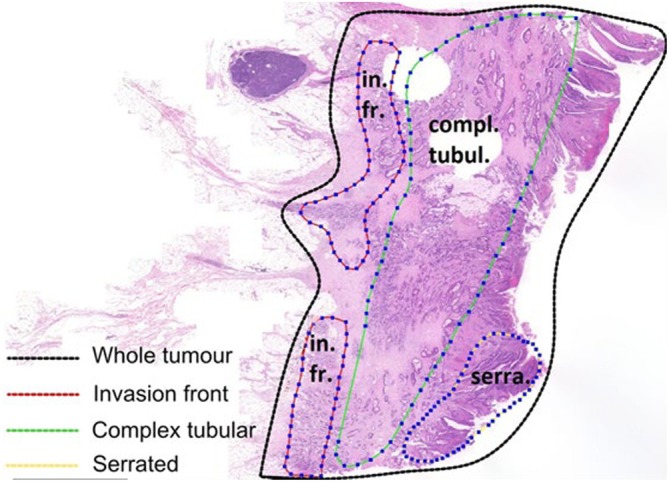 FIGURE 1
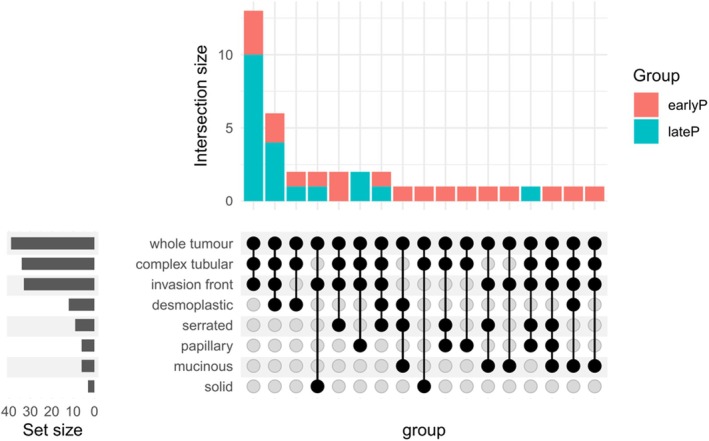 FIGURE 2
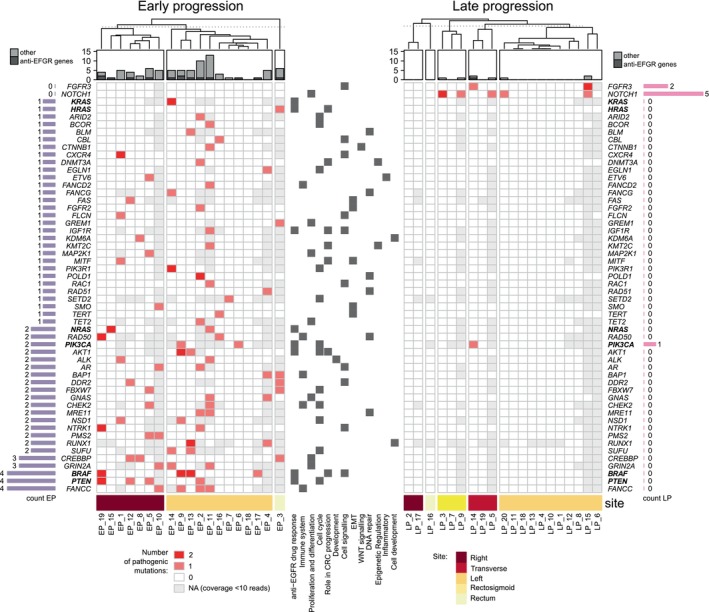 FIGURE 3
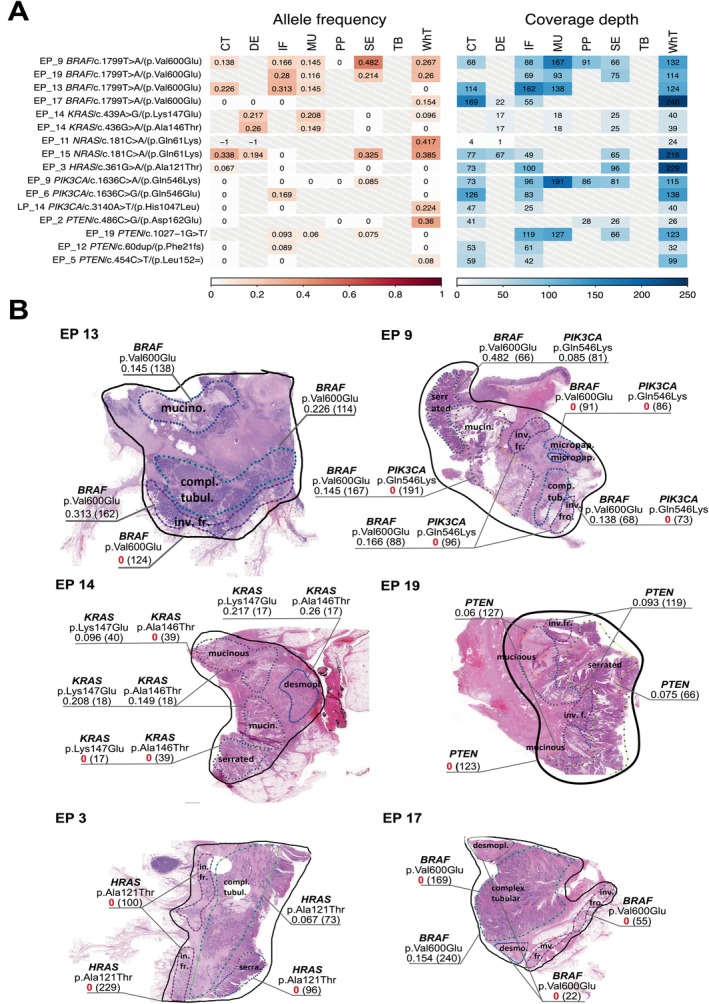 FIGURE 4
| Variable | Categories | Early progression (EP) (< 6 months) | Late progression (LP) (> 12 months) |
| Sum |
|---|---|---|---|---|---|
| Region type | Whole tumour | 19 | 20 | NA | 39 |
| Invasion front | 14 | 19 | 0.092 | 33 | |
| Complex tubular | 15 | 19 | 0.182 | 34 | |
| Desmoplastic | 6 | 6 | 1 | 12 | |
| Mucinous | 6 | 0 | 0.008 | 6 | |
| Papillary | 3 | 3 | 1 | 6 | |
| Serrated | 7 | 2 | 0.064 | 9 | |
| Solid/trabecular | 2 | 1 | 0.605 | 3 | |
| All | 72 | 70 | 142 | ||
| Number of profiled regions per tumour |
# Regions: # Tumours |
3 regs: 8 4 regs: 8 5 regs: 2 6 regs: 1 |
3 regs: 12 4 regs: 6 5 regs: 2 6 regs: 0 |
| Early progression (< 6 months) | Late progression (> 12 months) |
| Test | |
|---|---|---|---|---|
|
| 19 | 20 | ||
| Gender = M (%) | 11 (57.9) | 15 (75.0) | 0.320 | Fisher's exact test |
| Age (mean (SD)) | 59.16 (7.97) | 60.45 (10.99) | 0.678 | Student's |
| Grade (%) | ||||
| 1 | 3 (15.8) | 2 (10.0) | 0.731 | Fisher's exact test |
| 2 | 12 (63.2) | 16 (80.0) | ||
| 3 | 3 (15.8) | 1 (5.0) | ||
| 9 | 1 (5.3) | 1 (5.0) | ||
| T‐stage (%) | ||||
| T2 | 2 (10.5) | 0 (0.0) | 0.483 | Fisher's exact test |
| T3 | 13 (68.4) | 13 (65.0) | ||
| T4 | 4 (21.1) | 6 (30.0) | ||
| Tx | 0 (0.0) | 1 (5.0) | ||
| N‐stage (%) | ||||
| N0 | 3 (15.8) | 5 (25.0) | 0.065 | Fisher's exact test |
| N1 | 6 (31.6) | 11 (55.0) | ||
| N2 | 10 (52.6) | 3 (15.0) | ||
| Nx | 0 (0.0) | 1 (5.0) | ||
| Synchronous metastases = M1 (%) | 16 (84.2) | 15 (75.0) | 1.000 | Fisher's exact test |
| AJCC stage (%) | ||||
| II | 2 (10.5) | 1 (5.0) | 0.492 | Fisher's exact test |
| III | 1 (5.3) | 4 (20.0) | ||
| IV | 16 (84.2) | 15 (75.0) | ||
| Site | ||||
| Right | 7 (36.8) | 2 (10.0) | 0.039 | Fisher's exact test |
| Transverse | 0 (0.0) | 3 (15.0) | ||
| Left | 11 (57.9) | 11 (55.0) | ||
| Rectosigmoid | 0 (0.0) | 3 (15.0) | ||
| Rectum | 1 (5.3) | 1 (5.0) | ||
| Histology | ||||
| Adenocarcinoma | 17 | 20 | 0.231 | Fisher's exact test |
| Mucinous adenocarcinoma | 1 | 0 | ||
| Signet‐ring cell carcinoma | 1 | 0 | ||
| Number of unique variants per tumour, median (IQR) | 297 (109.5) | 242.5 (58.5) | 0.028 | Wilcoxon rank sum test |
| Number of unique pathogenic variants per tumour, median (IQR) | 17 (12.5) | 5 (6.75) | 0.002 | Wilcoxon rank sum test |
- —Horizon 2020 Framework Programme 10.13039/100010661
- —Ministerstvo Zdravotnictví Ceské Republiky 10.13039/501100003243
Peer Reviews
No public reviews on file for this paper yet. If you reviewed it on a platform where reviews are public (OpenReview, ICLR, NeurIPS, ICML), you can paste yours below so the community can read it here.
Videos
No videos yet. Explain this paper in a talk, walkthrough, or lecture? Add one.
Taxonomy
TopicsColorectal Cancer Treatments and Studies · Cancer Genomics and Diagnostics · Lung Cancer Treatments and Mutations
Introduction
1
Colorectal cancer is a major contributor to global cancer cases and mortality, ranking third in incidence but second in mortality [1, 2]. Metastatic colorectal cancer has a poor prognosis, with a 5‐year relative survival rate below 15%. While EGFR‐targeted therapy has improved survival for RAS wild‐type mCRC patients, its efficacy is limited, typically lasting only 8–10 months in responsive individuals [3, 4]. As therapeutic interventions continue, approximately 80% of initial responders develop resistance [5]. Identifying additional markers for treatment guidance and prognostic stratification remains crucial. The heterogeneity of tumours represents a challenge for targeted therapies. Baisse et al. found intratumoural heterogeneity (ITH) in 67% of advanced CRCs, highlighting the importance of examining gene alterations across multiple regions [6]. Subsequent research found that analysing a single tumour block resulted in inaccurate KRAS and BRAF status in 10%–30% of cases, requiring multi‐region analysis [7, 8, 9]. Büttner et al. [10] emphasised the need to include all tumour components for molecular assessment to detect drug resistance‐related alterations. Reggiani‐Bonetti et al. [11] supported this, linking CRC molecular ITH to tumour differentiation. Normanno et al. addressed the heterogeneity of the mutations predicting the resistance to anti‐EGFR treatment (KRAS, NRAS, BRAF and/or PIK3CA) in the primary CRC tumours in the context of the proportion of neoplastic cells [12]. Unfortunately, generally, tumour molecular profiling is performed from only one formalin‐fixed paraffin‐embedded (FFPE) block, ignoring the intrinsic ITH [13]. While FFPE allows selective material choice for molecular analysis, less common fresh frozen samples [14, 15] may undergo analysis without histopathological evaluation. Many studies omit a detailed tissue map during formalin fixation and paraffin embedding, leaving the heterogeneity among specific tumour locations largely unexplored. Consequently, established guidelines for assessing tissue sampling adequacy to accurately represent the molecular characteristics of the entire tumour are lacking. This presents a challenge, especially when treatment decisions before surgery rely on small biopsies from the tumour's surface, potentially leading to misguided decisions due to incomplete information. An alternative approach to identify all mutant subpopulations involves analysing multiple samples from various morphological tumour components. Our focus on the morphological basis for molecular phenotyping stems from previous observations correlating six morphological patterns with CRC molecular subtypes [16]. These morphological patterns were later confirmed to have specific molecular features, resulting in contradictory results of prognostic signatures [17]. Additionally, our analysis of four different FFPE blocks per tumour revealed that CRC tumours show high ITH with respect to these morphotypes, regardless of stage [18].
Here, in a pilot study, we aim to address the pivotal question of whether the previously described morphological patterns or the invasive front harbor specific mutations that could potentially be associated with shorter time‐to‐progression after the anti‐EGFR treatment (regardless of line of treatment), as compared to the analysis of whole sections. The morphological patterns by definition are defined by regions with low and high neoplastic cell content and can help guide the slide selection, enriching the samples in more homogeneous cells.
For this, we performed deep targeted sequencing of six different morphological regions and the invasion front of primary tumours from early‐ and late‐progressing patients. We compared the resulting profiles with those obtained from whole‐tumour sections, with the ultimate goal of refining the sampling process for better identification of patients more likely to experience early progression.
Methods
2
Sample Collection
2.1
Fully resected primary tumour FFPE samples from 39 KRAS wild‐type colon cancer patients treated with anti‐EGFR (cetuximab or panitumumab) + − chemotherapy (FOLFIRI or FOLFOX) were retrospectively selected from the Masaryk Memorial Cancer Institute's biobank. These included 19 early progressors (< 6 months post‐treatment) and 20 late progressors (> 12 months post‐treatment), regardless of the line of therapy, marked as EP and LP, respectively. The primary tumour samples spanned the years 2002–2020, while the anti‐EGFR treatments were administered between 2005 and 2020. The study assessed the effectiveness of anti‐EGFR therapy using median progression‐free survival (PFS). PFS was measured from the onset of treatment to disease progression or intolerable toxicity, confirmed through radiological imaging (CT or MRI) according to RECIST version 1.1 criteria. Time‐to‐progression after anti‐EGFR treatment was selected as a variable to define responders versus non‐responders, to minimise the influence of previous and subsequent treatment lines.
The study was approved by the Research Ethics Committee of Masaryk University (approval code EKV‐2018‐052, 5 April 2019). All patients provided written informed consent. The study adhered to the EU's ethical principles (2000/C364/01) and the Declaration of Helsinki (2013).
Biobanking Protocol
2.2
The biobanking protocol for FFPE slides adhered to ISO 23187 standards. The age of the FFPE blocks can affect DNA quality, potentially increasing mutational load in older blocks. In this dataset, no statistically significant difference was observed in FFPE block age between the compared groups (p > 0.05, T‐test). Additional mutation testing included BRAF (p.Val600Glu) and NRAS codons 12, 13 and 61, as per clinical guidelines.
Morphology Assessment, Sample Preparation and DNA Extraction
2.3
Tumour characteristics, determined by an expert pathologist per the 2019 WHO classification (5th ed.), included T‐stage, grade (G), localization, lymph node status and the presence of synchronous distant metastases. Patients with neoadjuvant treatment, multiple tumours or KRAS gene mutations in codons 12, 13, 61 and 146 were excluded. The FFPE blocks containing tumour tissue were then examined by an expert pathologist to identify morphological regions of interest. Blocks were sectioned in 3 μm serial sections. Morphological regions (as previously defined in [17]) were digitally marked in scanned whole slide images (at 20× magnification), see Figure 1. The invasion front was recognised in HE images as the spot where highly developed tumour cells infiltrate a stroma full of immune cells. A total of 142 samples (Table 1, Figure 2) were macrodissected, including regions of interest and whole‐tumour sections (macrodissected from the adjacent second section).
Schematic representation of the annotation of morphologically homogeneous regions on the FFPE slide.
Distribution of the extracted regions across samples, stratified by group.
The DNA extraction was performed from FFPE histopathological slides using AllPrep DNA/RNA Kits (Qiagen) according to their specific manufacturer's instructions.
Library Preparation and Sequencing
2.4
Genomic DNA isolated from FFPE tissue was analysed by QIAseq DNA QuantiMIZE Assay Kit (Qiagen) to determine the quantity and quality of isolated samples. The sample input for library preparation was determined based on the DNA quality. According to the manufacturer's recommendation, 100 ng of DNA was used for high‐quality samples and 250 ng was used for low‐quality samples. Libraries were prepared using QIAseq Targeted Human Comprehensive Cancer Panel (Qiagen). In brief, genomic DNA samples were first fragmented, end‐repaired and A‐tailed. The prepared fragments were then ligated with an UMI‐containing (unique molecular identifier) adapter and sample index using QIAseq combinatorial dual indices 12‐Index I (for Illumina platform, Qiagen). Target enrichment was performed by PCR using a region‐specific primer and a universal primer complementary to the adapter, followed by a universal PCR for amplification of the libraries and addition of Illumina‐specific adapter sequences. Final libraries were quantified by a qPCR‐based method using QIAseq Library Quant Assay Kit (Qiagen). The libraries were pooled based on the manufacturer's recommendations and sequenced using NextSeq 500/550 Mid Output Kit v2.5 (300 Cycles, Illumina) with QIAseq custom sequencing primer for Read 1 (QIAseq A Read 1 Primer I) on NextSeq 500 NGS system (Illumina). Targeted sequencing was performed using QIAGEN Human Comprehensive Cancer QIASeq DNA Panel and 150 bp paired‐end reads at Illumina NextSeq 500.
Bioinformatics Processing, Variant Calling and Statistical Analysis
2.5
Quality of the raw fastq files was checked using fastqc (v. 0.11.9) and multiqc (v. 1.14). All the adapters (Nextera Transposase Adaptors sequence was taken from Trimmomatic collection) were trimmed (min length = 75 bp) and poor‐quality reads (min base quality = 25) were removed using cutadapt (v. 4.2). Mapping of the reads was performed by Burrows‐Wheeler Aligner (v. 0.7.17.) to the GRCH38.p14 human reference genome indexed by samtools (v. 1.11). UMI extraction and UMI‐based deduplication of the samples were done using UMI‐tools (v. 1.0.0).
For variant calling and annotation of samples formatted as BAM files, we employed the nf‐core/sarek pipeline (v.3.4.0). The variant calling was performed using Mutect2 (v.4.4.0). For annotation, we incorporated both SnpEff (v. 5.1d) and VEP (v.110), aligning these processes with the GRCh38 reference genome with the database for annotation ClinVar (v.202301).
To determine the coverage of the selected variants, we utilised BCFtools (v.1.14), ensuring precise and reliable coverage assessment. Only variants with FILTER values of PASS, germline, or panel_of_normals and annotated in the ClinVar database with a gene symbol assigned were considered in the analysis. This resulted in a dataset with 3126 variants. The coverage of positions of the 3126 variants was obtained also for samples without the variants called. If a coverage at the variant position was < 10, the information on the variant was considered “not available.” A variant was considered “pathogenic,” when it was annotated in the ClinVar database as pathogenic, likely pathogenic, or with conflicting interpretations of pathogenicity.
Differences in the distribution of continuous and categorical variables between the EP and LP groups were tested using the Wilcoxon rank sum test or Fisher's exact test, respectively. The differences in age were tested using a two‐sided two‐sample T‐test. We considered results significant at α < 0.05. All statistical analyses were performed in R 4.2.1 [19].
Results
3
We analysed 142 samples from 39 KRAS wild‐type fully resected primary tumours of metastatic CRC patients undergoing anti‐EGFR therapy (in first‐, second‐ or third‐line treatment), covering the entire tumour, invasion front and six morphological regions. 75% and 80% of patients in the LP and EP group (respectively) presented at diagnosis as stage IV.
The whole‐tumour section was profiled in all tumours. Invasion front was profiled in 14 and 19 tumours of the EP and LP groups, respectively. The number of profiled regions per tumour ranged from 3 to 6 (based on availability), with most tumours having 3 or 4 regions (20 and 14 cases, respectively) (Table 1). Some combinations of morphologies were not observed, such as TB with MU, DE, SE or PP and DE with PP (Figure 2).
All tumours were classified as adenocarcinoma except for one case of mucinous adenocarcinoma and one case of signet‐ring cell carcinoma (both in EP group). Interestingly, all six tumours with mucinous regions belonged to the EP group, and this group was also enriched in serrated morphologies (7 compared to 2) (Table 1).
We did not reject the hypothesis of similar distribution between the two compared groups for all clinical variables but site and the line of anti‐EGFR treatment (Table 2). 40% of tumours from the EP group were from the right side of the colon, while 80% of right‐sided tumours belonged to the EP group. At the same time, the EP group underwent anti‐EGFR therapy more often in the second or third line treatment.
There were 395 pathogenic variants, distributed across 119 genes. Of these, the most frequently mutated (in terms of number of patients with more than 10 pathogenic variants in that gene) were HNF1A (31), BRCA2 (15), TP53 (12), PTCH1 (11), BRCA1 (11) and PDGFRA (10).
The number of detected variants per region ranged between 48 and 231 (median 152), while the number of detected pathogenic variants per region ranged between 0 and 18 (median 4). The number of detected variants per primary tumour (regardless of the type of region sampled) ranged between 155 and 465 (median 252), and the number of detected pathogenic variants per tumour ranged between 1 and 39 (median 10). The genes with the largest number (≥ 10) of unique variants found across all samples were BRCA2 (39), TSC2 (14), TP53 (13), PTCH1 (14), BRCA1 (13), NF1 (11), MLH1 (11), APC (11) and KMT2D (11).
Variants Between Early and Late Progression Group
3.1
With respect to response to therapy, we first examined unique pathogenic variants per tumour (regardless of the region of origin). Tumours from the EP group showed higher mutational burden compared to the LP group either when assessing all variants (median 297 for EP vs. 242.5 for LP, p = 0.028) or pathogenic variants (median 17 vs. 5, p = 0.002) (Table 2).
We then focused on genes with at least one pathogenic variant specific to the EP or LP group (Figure 3). Again, tumours from the EP group harboured more specific genes with pathogenic variants than tumours from the LP group (54 vs. 2). Only one tumour from the EP group showed none of the EP‐specific pathogenic variants, while as much as 70% (14/20) tumours in the LP group showed none of the LP‐specific pathogenic variants.
Presence of any pathogenic mutations in genes known for their role in anti‐EGFR therapy response and in other genes specific for the early‐ or late‐progressing group.
The most frequently mutated specific genes in the EP group were BRAF, PTEN and FANCC and NOTCH1 in the LP group.
In the EP group, 12 tumours had pathogenic mutations in key genes associated with response to anti‐EGFR therapy (1 × in BRAF + PTEN, 1 × in BRAF + PIK3CA, 2 × in BRAF, 3 × in PTEN, 2 × in NRAS, 1 × in KRAS, 1 × in HRAS and 1 × in PIK3CA). BRAF p.Val600Glu mutations were found in three left‐sided and 1 right‐sided tumour, NRAS p.Gln61Lys in 1 right and 1 left‐sided tumour, KRAS p.Lys147Glu and p.Ala146Thr in one left‐sided tumour, and HRAS p.Ala121Thr in the tumour of the rectum. PTEN p.Asp162Glu, p.Phe21fs, and PTEN 1027‐1G > T mutations were found in three right‐sided and one left‐sided tumour, and PIK3CA p.Gln546Lys and p.Gln546Glu mutations in two left‐sided tumours.
Other mutations specific to the EP group were associated with crucial biological processes as shown in Figure 3.
Morphology‐Specific Mutations and Within‐Tumour Case Studies
3.2
The within‐tumour profile similarity, computed on a full set of 3126 variants (Table S1) and based on Manhattan distance, was higher than the between‐tumour similarity (average similarity 0.63 vs. 0.41). However, when restricting the similarity to pathogenic mutations only, the between‐tumour similarity was almost equal to the within‐tumour (average 0.74 vs. 0.81) and, for 10 cases, was even higher.
We then restricted the analysis to the distribution of pathogenic mutations within the tumour regions (Figure S1). We did not seek pathogenic mutations that would be specific to a certain type of morphology (the design of the experiment does not allow for such an exercise), but we did observe distinctive traits in the tumour fractions. We detected both previously reported (HNF1, SUFU) and unreported (BRCA2, GRIN2A) alterations associated with mucinous adenocarcinoma. Further, at the invasion front, we observed mutations in genes such as RAD50, SMAD4, MSH2 and PTCH1 which may contribute to increased invasiveness, metastasis, and treatment resistance, highlighting the dynamic nature of the invasion front. Other mutations, such as BRAF, were most often detected in all sampled regions of the tumour.
Interestingly, the whole‐tumour sections never comprised complete mutational profiles as found in tumour's subsampled regions, especially those characterised by lower cell counts, such as mucinous or desmoplastic. Also, the whole‐tumour sample often inadequately reflected the molecular profile of the invasion front. Inspection of variants in genes linked to anti‐EGFR therapy (KRAS, BRAF, NRAS, PTEN and PIK3CA) revealed variability across tumours and fractions (Figure 4A). PIK3CA was considered alongside PTEN due to their uncertain associations with anti‐EGFR therapy response. BRAF mutations correlated with serrated and mucinous morphologies, KRAS mutations with mucinous and desmoplastic morphologies. Below, we depict six cases showing variant differences between morphological sites. Patient EP13 exemplifies this complexity as the BRAF p.Val600Glu was tested negative in the whole‐tumour sample but positive in mucinous, complex tubular and invasion front regions. This patient also tested BRAF p.Val600Glu positive in the clinical testing. In contrast, patient EP17, BRAF p.Val600Glu negative in clinical testing, exhibited positivity solely in the whole‐tumour section, including both the selected regions and interstitial regions not associated with a specific morphological type. The occurrence of Ras mutations (KRAS and HRAS) exhibited variability across distinct morphological regions as well. Specifically, in patient EP14, while we did not find any of the clinically tested KRAS mutations, we observed two additional KRAS mutations: KRAS p.Lys147Glu and KRAS p.ALA146THR. The KRAS p.Lys147Glu was negative in the serrated region, and KRAS p.ALA146THR was negative both in the serrated and the whole‐tumour section. In patient EP3, HRAS p.Ala121Thr was exclusively detected in the complex tubular region, but not in the serrated fraction, nor on the invasion front, nor in the whole tumour. Patient EP9 (in clinical testing positive for BRAF p.Val600Glu) exhibited disparities in the detection of BRAF p.Val600Glu and PIK3CA p.Gln546Lys mutations. Notably, differences in this patient were observed in the serrated region, which exclusively tested positive for the PIK3CA p.Gln546Lys mutation among all other regions, and the micropapillary region, which conversely tested negative for the BRAF p.Val600Glu mutation. Also, the detection of PTEN 1027‐1G > T in patient EP19 was inconclusive, while it tested positive in the dissections of morphological regions but negative for the dissected whole tumour.
Variability of selected mutations across the morphological regions. (A) All pathogenic mutations of selected genes involved in response to anti‐EGFR therapy and tumours in which they were found (in any of the regions). Heatmaps show allele frequencies (left) and coverage depths (right) for each variant. Each row represents a patient and the position at which the variant occurred. (B) Annotated FFPE scans of selected tumours with allele frequencies and coverage depths of selected pathogenic mutations in genes implicated in anti‐EGFR therapy response.
In patients EP9 and EP19, who both tested positive for BRAF p.Val600Glu in clinical testing, we found this mutation in all the regions. Similarly, patient EP15 (not tested for NRAS in the clinical testing) showed NRAS p.Gln61Lys mutation in all the regions. Another patient EP11, which was also not tested for NRAS in the clinical testing, tested positive for NRAS p.Gln61Lys in the whole tumour only, due to lack of coverage of this variant in other regions.
Discussion
4
Despite the substantial impact of anti‐EGFR monoclonal antibodies (anti‐EGFR mAbs) combined with chemotherapy on mCRC, their therapeutic efficacy is constrained by the development of drug resistance. Moreover, the duration of clinical benefit among responders to anti‐EGFR mAbs therapy is limited [3, 4]. In our study and motivated by our previous research [17], we linked histological morphology and molecular pathology in anti‐EGFR treatment by analysing mutational profiles of tumour regions (consisting of selected morphotypes, invasion front and whole‐tumour sections) of the early‐ and late‐progressing patients.
The analysis of unique pathogenic variants per tumour, irrespective of their region of origin, revealed higher mutational burden in the EP group compared to the LP group, both with all variants and only the pathogenic ones. This may reflect the underlying genetic complexity and aggressive nature of these tumours, contributing to their early progression [20]. The within‐tumoural similarity of pathogenic mutational profiles was less prominent than that of full mutational profiles, indicating that pathogenic mutations represented known oncogenic processes with added tumour region‐specificity. Most importantly, we observed that the whole tumour's mutational profile did not represent the sum of constituent regions.
Mutations in the EP group revealed complex genetic interplay in cancer development. Notably, 12/19 EP patients had pathogenic mutations in one or several genes linked to poor anti‐EGFR therapy response: KRAS, BRAF, NRAS, HRAS, PTEN and PIK3CA. The most frequently mutated genes were BRAF, PTEN and FANCC.
Several mutations of KRAS and other RAS genes were already linked to poor response to anti‐EGFR treatment [21, 22, 23, 24, 25, 26, 27, 28]. While mutations in the KRAS gene are frequent (~45% of CRC), the tested regions for treatment selection are limited to exon 2 at codons 12 and 13. Similarly, NRAS mutations (~1% of CRC [29]) tested cover the codons 12, 13 and 61. Still, oncogenic mutations outside these commonly tested loci have been identified [30, 31, 32] and we also found this to be the case in one patient who harboured two other variants (p.Lys147Glu, p.Ala146Thr). Mutations of the BRAF gene are a negative predictor for anti‐EGFR treatment response and indicators of poor prognosis in metastatic colorectal cancer (mCRC). They affect 8%–12% of cases, with V600 amino acid alterations being the most common [21, 33]. We identified this mutation in 4/19 EP patients, with one testing positive despite negative previous clinical tests. Previous research has demonstrated that analysing DNA from a single block can erroneously classify the KRAS and BRAF status as wild type in up to 30% of patients [7, 9, 34]. PIK3CA mutations and loss of PTEN were proposed as prognostic or predictive biomarkers for anti‐EGFR mAb in mCRC patients with wild‐type RAS [35, 36, 37]. We identified mutations in these genes in six patients triple‐negative for NRAS, KRAS and HRAS. In two patients, PTEN or PIK3CA mutations coincided with a BRAF mutation. Notably, positivity of these mutations varied significantly across morphological regions in all six cases. Our findings on RAS/RAF mutations reveal disparities across tumour regions, with heterogeneous distribution observed in certain studies [38, 39, 40] but inconsistently replicated in others [41, 42]. This significant heterogeneity within tumours regarding specific mutations could impact therapeutic strategies, as tumours with molecular alterations in only a subset of cells may show reduced sensitivity to targeted therapies, as seen in our findings, where patients tested negative overall but positive in specific tumour regions or vice versa.
BRAF mutations were associated with serrated and mucinous morphologies. In contrast, KRAS mutations, specifically the variants p.Lys147Glu and p.Ala146Thr, which are not typically included in standard clinical testing panels, were associated with mucinous and desmoplastic morphologies.
Our findings extend the current literature by demonstrating that not only the selection of an inappropriate tumour block but also the ITH within each block can compromise the accurate identification of RAS/RAF mutations [7, 8, 9]. PIK3CA exon 20 mutations may reduce anti‐EGFR mAb responsiveness, but clinical applicability is uncertain due to small sample sizes and potential confounding factors. Similarly, PTEN status association with treatment response remains inconclusive due to challenges in assessment.
The co‐occurrence of PIK3CA and PTEN alterations with KRAS or BRAF mutations further complicates their evaluation [21, 43, 44, 45]. The role of PIK3CA mutation and PTEN status in mediating EGFR‐directed therapy resistance in colorectal cancer is still unclear [21, 43, 46, 47, 48]. The detection of mutations in PTEN and PIK3CA appeared to be very sensitive to the sampled regions, suggesting not only the need for a more detailed sampling, but also raising the question of whether their prevalence is underestimated.
Our analysis revealed that 40% of EP group tumours were right‐sided, and, reciprocally, eight out of 10 right‐sided tumours were in the EP group. It was shown that right‐sided tumours exhibit lower responsiveness to anti‐EGFR treatment [49] and higher mutation rates in genes like BRAF, PIK3CA, and KRAS [50], suggesting potential underlying reasons for this association. In our data, these also comprised 3 EP tumours without any of the mutations involved in the resistance to the anti‐EGFR treatment. The mutations of the remaining four EP patients were not linked to anti‐EGFR therapy resistance until now, suggesting that early progression could be influenced by rare events beyond the detection power of relatively small sample size sets or detection thresholds used in most studies.
In the LP group, specific genes were found in only 6/20 patients: FGFR3 (2/20) and NOTCH1 (5/20). This might be due to Notch signalling's role in tumour recurrence and progression [51, 52]. However, our attempts to define up to 14 patients as belonging to the LP group based on mutation similarity proved unsuccessful. While EP mutations suggest faster progression, in the LP group, it appears that correct treatment was initiated, indicating that other factors likely contributed to the later progression.
Our findings show that when sampling the tumour for molecular pathology analysis, it is prudent to take into account the anticipated presence or absence of mutations in the context of intratumoral morphological heterogeneity. This has implications in both research and clinical practice. Research‐wise, the identification of additional relevant mutations in non‐responders to anti‐EGFR therapy might be possible only when focused on morphological regions, as exemplified by our finding of KRAS (p.Lys147Glu and p.Ala146Thr) mutations in mucinous and desmoplastic, but not serrated regions of a tumour, despite the latter having a larger proportion of neoplastic cells. Additionally, our findings indicate that mutation frequencies, such as those of PIK3CA and PTEN, may be underestimated due to the non‐specificity of the regions examined (in our case these were present in very specific regions of the tumour such as IF, etc.). From a clinical perspective, for instance, we observed that BRAF mutations occurred in tumours with serrated morphology. Hence, in the case of a negative BRAF result when using a classical (and widely heterogenous) sampling approach, the presence of serrated morphology could indicate focal sample acquisition from this region for further testing. These insights should be carefully considered when procuring samples. These observations are even more important with respect to our previous results (https://www.biorxiv.org/content/10.1101/2024.04.10.588907v1.full), that clearly show that serrated and desmoplastic regions rarely co‐occur and that there is a statistically significant increase in desmoplastic region proportion in the primary tumours of stage IV CRC.
Looking ahead, ctDNA has the potential to enhance diagnostic precision by capturing tumour heterogeneity in cases where tissue biopsies are insufficient or unavailable. However, its current limitations, including lower sensitivity compared to tissue‐based NGS, emphasise the need for technological advancements and validation to integrate ctDNA effectively into clinical practice [53, 54].
Indeed, intratumoral heterogeneity complicates biomarker detection and treatment decisions. Studies [55, 56] show that genetic subclonal dynamics play a key role in tumour evolution and resistance to therapy, which suggests that multi‐regional sequencing combined with AI‐assisted histopathology is the future in precision diagnostics. Moreover, combining ctDNA analysis with spatially resolved tumour profiling may even further improve biomarker detection and optimise targeted treatments.
Our preliminary investigation has some limitations. The study was retrospective with a restricted sample size, possibly introducing selection bias or confounding variables. Specifically, the variation in treatment lines and concurrent chemotherapy could have influenced the observed differences, emphasising the exploratory nature of these findings. Larger cohorts are needed to estimate the prevalence of cases affected by this variability. Still, our results clearly expose the challenges in accurately characterising the mutational landscape of the tumours, with a direct impact on treatment decisions. Whether morphological assessment by a pathologist or other means (such as AI based image analysis) is used as a basis for tumour sampling remains an open question, but the message is that multiple sites per tumour need to be interrogated to better capture its features. Furthermore, we acknowledge that validation in an independent dataset would significantly enhance the robustness of our findings. Currently, access to an equivalent dataset with similar morphology‐resolved molecular data is unavailable, limiting our ability to perform external validation. Future studies should focus on larger and more diverse patient cohorts or develop collaborative data‐sharing initiatives to validate and extend our findings, ultimately improving their translational relevance.
Conclusions
5
Overall, our study supports the notion that morphological patterns can guide minimal tumour sampling coverage to identify relevant mutations relevant for prediction of response to anti‐EGFR therapy. This prompts a reassessment of sampling practices and provides insights for diagnostics and profiling strategies. The selected morphological patterns are relatively easy to recognise by the pathologists (or an AI‐trained model), have been shown to be connected with molecular characteristics of the tumours and hence they can provide a guidance for a minimal tumour sampling coverage to identify relevant mutations. This approach can improve the accuracy of mutation detection and potentially provide better prognostic information, ultimately informing treatment strategies for metastatic colorectal cancer (mCRC) patients.
Author Contributions
Martina Čarnogurská: conceptualization (equal), data curation (equal), investigation (equal), methodology (equal), visualization (equal), writing – original draft (lead), writing – review and editing (equal). Valeriia Serhiivna Vasylieva: formal analysis (equal), writing – original draft (equal). Táňa Macháčková: methodology (equal), writing – original draft (equal). Marie Boudná: methodology (equal), writing – original draft (equal). Lucie Pifková: methodology (equal), writing – original draft (equal). Jana Orlíčková: methodology (equal), writing – original draft (equal). Tina Catela Ivkovic: methodology (equal), writing – original draft (equal). Ondrej Slabý: conceptualization (equal), methodology (equal), project administration (equal), supervision (equal), writing – original draft (equal). Beatrix Bencsiková: conceptualization (equal), project administration (equal), resources (equal), writing – original draft (equal). Vlad Popovici: conceptualization (lead), data curation (equal), formal analysis (equal), investigation (equal), methodology (equal), project administration (equal), resources (equal), supervision (equal), writing – original draft (equal). Eva Budinská: conceptualization (equal), data curation (equal), investigation (equal), project administration (equal), resources (equal), supervision (equal), visualization (equal), writing – original draft (lead).
Conflicts of Interest
The authors declare no conflicts of interest.
Supporting information
Figure S1. Distribution of pathogenic variants in whole tumour, invasion front and across the morphological regions. Each row represents sample, each column represent mutations. Higlighted (bold) are mutations associated with non‐response to anti‐EGFR therapy.
File S1.
Table S1. List of all 3126 variants selected for analysis, annotated by ClinVar with available GeneSymbol.
The reference list from the paper itself. Each links out to its DOI / PubMed record.
- 1H. Sung , J. Ferlay , R. L. Siegel , et al., “Global Cancer Statistics 2020: GLOBOCAN Estimates of Incidence and Mortality Worldwide for 36 Cancers in 185 Countries,” CA: A Cancer Journal for Clinicians 71, no. 3 (2021): 209–249.33538338 10.3322/caac.21660 · doi ↗ · pubmed ↗
- 2R. L. Siegel , K. D. Miller , H. E. Fuchs , and A. Jemal , “Cancer Statistics, 2022,” CA: A Cancer Journal for Clinicians 72, no. 1 (2022): 7–33.35020204 10.3322/caac.21708 · doi ↗ · pubmed ↗
- 3J. Tabernero , E. Van Cutsem , E. Díaz‐Rubio , et al., “Phase II Trial of Cetuximab in Combination With Fluorouracil, Leucovorin, and Oxaliplatin in the First‐Line Treatment of Metastatic Colorectal Cancer,” Journal of Clinical Oncology 25, no. 33 (2007): 5225–5232.18024868 10.1200/JCO.2007.13.2183 · doi ↗ · pubmed ↗
- 4M. Borner , D. Koeberle , R. Von Moos , et al., “Adding Cetuximab to Capecitabine Plus Oxaliplatin (XELOX) in First‐Line Treatment of Metastatic Colorectal Cancer: A Randomized Phase II Trial of the Swiss Group for Clinical Cancer Research SAKK,” Annals of Oncology 19, no. 7 (2008): 1288–1292.18349029 10.1093/annonc/mdn 058 · doi ↗ · pubmed ↗
- 5A. Bardelli and S. Siena , “Molecular Mechanisms of Resistance to Cetuximab and Panitumumab in Colorectal Cancer,” Journal of Clinical Oncology 28, no. 7 (2010): 1254–1261.20100961 10.1200/JCO.2009.24.6116 · doi ↗ · pubmed ↗
- 6B. Baisse , H. Bouzourene , E. P. Saraga , F. T. Bosman , and J. Benhattar , “Intratumor Genetic Heterogeneity in Advanced Human Colorectal Adenocarcinoma,” International Journal of Cancer 93, no. 3 (2001): 346–352, 10.1002/ijc.1343.11433398 · doi ↗ · pubmed ↗
- 7L. Farber , E. Efrati , H. Elkin , et al., “Molecular Morphometric Analysis Shows Relative Intra‐Tumoural Homogeneity for KRAS Mutations in Colorectal Cancer,” Virchows Archiv 459, no. 5 (2011): 487–493.22016105 10.1007/s 00428-011-1158-y · doi ↗ · pubmed ↗
- 8M. Jeantet , D. Tougeron , G. Tachon , et al., “High Intra‐ and Inter‐Tumoral Heterogeneity of RAS Mutations in Colorectal Cancer,” International Journal of Molecular Sciences 17, no. 12 (2016): 2015.27916952 10.3390/ijms 17122015 PMC 5187815 · doi ↗ · pubmed ↗