Fibrothecoma of the Ovary; Clinical and Imaging Characteristics
Gehad Ahmad Saleh, Omar Hamdy, Dina Ragab, Bassante Farouk, Mennatalla Mahmoud Allam, Rawan Abo Asy, Fatmaelzahraa A. Denewar, Mohamed Ezat

TL;DR
This study analyzes the clinical and imaging features of ovarian fibrothecoma, a rare benign tumor, to better understand its characteristics and correlations with tumor size and markers.
Contribution
The study provides new insights into the imaging and clinical correlations of fibrothecoma, particularly the relationship between tumor size and imaging features.
Findings
Largest tumor diameter correlates with CA 125 levels, ascites, and DWI signal intensity.
Smaller tumors are more likely to appear hypoechoic on ultrasound.
MRI shows larger tumors have mixed-hyperintense T2 signal intensity.
Abstract
Ovarian fibrothecoma is a rare benign sex cord-stromal ovarian tumor sorted under the thecoma-fibroma group. We present an analysis of clinical and laboratory findings and the radiological characteristic features of pathologically proven fibrothecomas in variable imaging modalities. A retrospective analysis was done for 88 patients with 90 pathologically proven ovarian fibrothecoma between January 2011 and December 2023 from our center’s prospectively maintained database. All the patients underwent preoperative ultrasonography, computed tomography (CT), and magnetic resonance imaging (MRI) scans, clinical examinations, basic laboratory tests, and tumor markers. The results of Spearman’s correlation revealed a statistically significant positive correlation between the largest tumor diameter and serum level. CA 125, the degree of ascites, and diffusion weighted imaging (DWI) signal…
Genes, proteins, chemicals, diseases, species, mutations and cell lines named across the full text — each resolved to its canonical identifier and authoritative record.
Click any figure to enlarge with its caption.
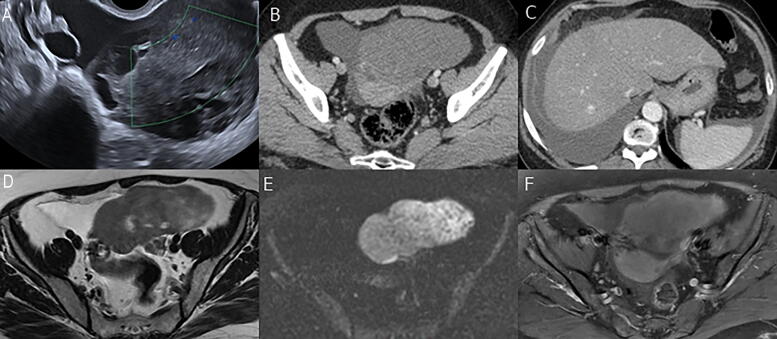 FIG. 1
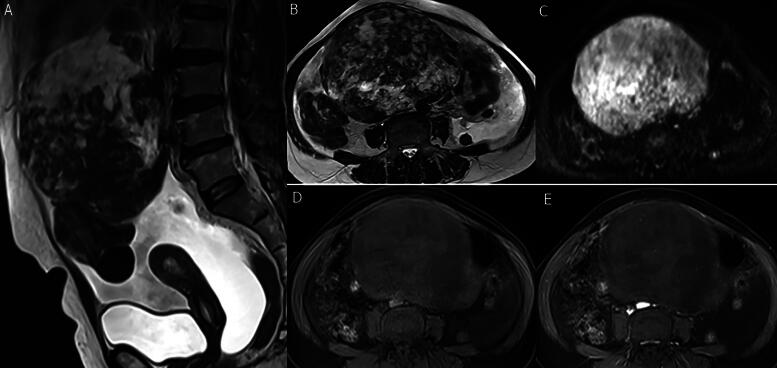 FIG. 2
| Characteristic |
| % |
|---|---|---|
| Presence of ascites | 59 | 67 |
| Degree of ascites | ||
| Mild | 46 | 78 |
| Moderate | 9 | 15.25 |
| Marked | 4 | 6.75 |
| Associated adenomyosis | 4 | 4.5 |
| Associated atrophic endometrium | 2 | 2.3 |
| Associated endometrial hyperplasia | 10 | 11.4 |
| Associated uterine leiomyoma | 2 | 2.3 |
| Border | ||
| Smooth (regular) | 75 | 85.2 |
| Lobulated | 13 | 14.8 |
| Clinical presentation | ||
| Abdominal enlargement | 6 | 6.8 |
| Abnormal uterine bleeding | 1 | 1.1 |
| Asymptomatic (accidentally discovered) | 3 | 3.4 |
| Pelvic-abdominal pain | 79 | 89.8 |
| Abdominal | 19 | 21.6 |
| Pelvic | 60 | 68.2 |
| Cystic changes | 57 | 64.8 |
| Echogenicity by US ( | ||
| Hypoechoic | 41 | 47.7 |
| Isoechoic | 32 | 37.2 |
| Mixed hyperechoic | 13 | 15.1 |
| Vascularity by US | ||
| No | 25 | 28.4 |
| Mild | 59 | 67 |
| Moderate | 3 | 3.4 |
| Marked | 1 | 1.1 |
| CT enhancement | 61 | 69.3 |
| Mild | 60 | 98.4 |
| Moderate | 1 | 1.6 |
| MRI T2 signal intensity ( | ||
| Hypointense | 10 | 27 |
| Intermediate/isointense | 20 | 54.1 |
| Mixed hyperintense | 7 | 18.9 |
| MR postcontrast enhancement ( | ||
| Mild | 35 | 94.6 |
| Moderate | 1 | 2.7 |
| Marked | 1 | 2.7 |
| DWI signal intensity ( | ||
| Low | 8 | 21.6 |
| Intermediate | 27 | 73 |
| High | 2 | 5.4 |
| Laterality | ||
| Right | 53 | 60.2 |
| Left | 33 | 37.5 |
| Bilateral | 2 | 2.3 |
| Surgery type | ||
| Salpingo-oophorectomy | 52 | 59.1 |
| Total abdominal hysterectomy & bilateral salpingo-oophrectomy | 36 | 40.9 |
| Surgical approach | ||
| Open | 83 | 94.3 |
| Laparoscopic | 5 | 5.7 |
| Parameter | Correlation coefficient | Sig. |
|---|---|---|
| Spearman’s correlation | ||
| Age (years) | 0.064 | 0.551 |
| CA 125 | 0.434 |
|
| CA 19-9 | 0.157 | 0.333 |
| CEA | 0.069 | 0.677 |
| Vascularity (US) | 0.121 | 0.261 |
| MR postcontrast enhancement ( | −0.065 | 0.702 |
| DWI signal intensity ( | 0.457 |
|
| CT enhancement | 0.137 | 0.203 |
| Degree of ascites | 0.314 |
|
| Point biserial correlation | ||
| Presence of ascites | 0.328 |
|
| Presence of cystic changes | 0.338 |
|
| Presence of pelvic-abdominal pain | 0.019 | 0.858 |
| Presence of abdominal enlargement | 0.304 |
|
| Asymptomatic presentation | −0.205 | 0.056 |
| Border | 0.659 |
|
| Surgery type | −0.257 |
|
| Surgical approach | 0.083 | 0.444 |
| Associated endometrial hyperplasia | 0.141 | 0.192 |
| Associated uterine leiomyoma | 0.137 | 0.202 |
| Associated adenomyosis | 0.040 | 0.713 |
| Associated atrophic endometrium | −0.031 | 0.773 |
| Parameter | Tumor group | Sig. | |||
|---|---|---|---|---|---|
| Smaller | Larger | ||||
| Categorical |
| % |
| % | |
| Presence of ascites | 12 | 41.4 | 47 | 79.7 |
|
| Lateralitya | 1.00 | ||||
| Right | 17 | 58.6 | 36 | 61 | |
| Left | 11 | 37.9 | 22 | 37.3 | |
| Bilateral | 1 | 3.4 | 1 | 1.7 | |
| Cystic changes | 14 | 48.3 | 43 | 72.9 |
|
| Borderb |
| ||||
| Regular smooth | 29 | 100 | 46 | 78 | |
| Lobulated | 0 | 0 | 13 | 22 | |
| Echogenicity (US)a |
| ||||
| Hypoechoic | 21 | 72.4 | 20 | 35.1 | |
| Isoechoic | 7 | 24.1 | 25 | 43.9 | |
| Mixed hyperechoic | 1 | 3.4 | 12 | 21.1 | |
| Vascularity (US)a | 0.461 | ||||
| No | 11 | 37.9 | 14 | 23.7 | |
| Mild | 17 | 58.6 | 42 | 71.2 | |
| Moderate | 1 | 3.4 | 2 | 3.4 | |
| Marked | 0 | 0 | 1 | 1.7 | |
| MRI T2 signal intensitya ( | 0.074 | ||||
| Hypointense | 5 | 35.7 | 5 | 21.7 | |
| Intermediate/isointense | 9 | 64.3 | 11 | 47.8 | |
| Mixed hyperintense | 0 | 0 | 7 | 30.4 | |
| MRI postcontrast enhancementa ( | 0.620 | ||||
| Mild | 13 | 92.9 | 22 | 95.7 | |
| Moderate | 1 | 7.1 | 0 | 0 | |
| Marked | 0 | 0 | 1 | 4.3 | |
| DWI signal intensitya ( |
| ||||
| Low | 6 | 42.9 | 2 | 8.7 | |
| Intermediate | 8 | 57.1 | 19 | 82.6 | |
| High | 0 | 0 | 2 | 8.7 | |
| CT enhancementa | 0.207 | ||||
| No | 12 | 41.4 | 15 | 25.4 | |
| Mild | 17 | 58.6 | 43 | 72.9 | |
| Moderate | 0 | 0 | 1 | 1.7 | |
| Clinical presentation | |||||
| Abdominal enlargementb | 0 | 0 | 6 | 10.2 | 0.172 |
| Abnormal uterine bleedingb | 1 | 3.4 | 0 | 0 | 0.330 |
| Asymptomaticb | 3 | 10.3 | 0 | 0 |
|
| Pelvic-abdominal painb | 25 | 86.2 | 54 | 91.5 | 0.469 |
| Abdominal | 8 | 32 | 11 | 20.4 | 0.272 |
| Pelvic | 17 | 68 | 43 | 79.6 | |
| Surgical technique |
| ||||
| Open | 25 | 86.2 | 58 | 98.3 | |
| Laparoscopic | 4 | 13.8 | 1 | 1.7 | |
| Surgery type | 0.075 | ||||
| Salpingo-oophorectomy | 21 | 72.4 | 31 | 52.5 | |
| TAH/BSO | 8 | 27.6 | 28 | 47.5 | |
| Associated endometrial hyperplasiab | 2 | 6.9 | 8 | 13.6 | 0.487 |
| Associated uterine leiomyomab | 0 | 0 | 2 | 3.4 | 1.00 |
| Associated adenomyosisb | 0 | 0 | 4 | 6.8 | 0.298 |
| Associated atrophic endometriumb | 1 | 3.4 | 1 | 1.7 | 1.00 |
|
| Largest tumor diameter | Sig. | ||
|---|---|---|---|---|
| Median | Q1–Q3 | |||
| MR signal intensity | ||||
| Hypointense | 10 | 10 | 7–16 |
|
| Intermediate/isointense | 20 | 11 | 9.25–12 | |
| Mixed hyperintense | 7 | 16 | 16–20 | |
| Echogenicity (US) | ||||
| Hypoechoic | 41 | 10 | 8–13 |
|
| Isoechoic | 32 | 14 | 11.25–15.75 | |
| Mixed hyperechoic | 13 | 16 | 12–19.5 | |
| DWI signal intensity | ||||
| Low | 8 | 8.5 | 7.25–11.5 |
|
| Intermediate | 27 | 12 | 10–16 | |
| High | 2 | 18 | 16–NA | |
Peer Reviews
No public reviews on file for this paper yet. If you reviewed it on a platform where reviews are public (OpenReview, ICLR, NeurIPS, ICML), you can paste yours below so the community can read it here.
Videos
No videos yet. Explain this paper in a talk, walkthrough, or lecture? Add one.
Taxonomy
TopicsOvarian cancer diagnosis and treatment · Uterine Myomas and Treatments · Sarcoma Diagnosis and Treatment
Introduction
Ovarian fibrothecoma is a rare benign sex cord-stromal ovarian tumor sorted under the thecoma-fibroma group, that accounts for 4% of all ovarian cancers.^1^ The thecoma-fibroma group is composed of variable amounts of two components (theca cells and fibroblasts) and allocated into three subcategories fibromas, fibrothecomas, and thecomas, according to the proportion of the histological two-component.^2,3^ Fibromas rise from nonfunctioning fibroblast spindle cells of the ovarian stroma and, are frequently asymptomatic and encountered incidentally.^4^ Thecomas arise from theca cells and account only for 1% of all primary ovarian tumors. Thecomas may show signs of hyperestrogenism incorporating endometrial hyperplasia in 15% of cases.^5^ The term “fibrothecoma” refers to rare tumors with overlapping histological features and mixed spindle cells with lipid-rich cytoplasm (theca-like cells).^6–8^
Fibrothecoma typically is manifested unilaterally, but bilaterality could also occur.^9^ It can be presented with diverse clinical symptoms, and significant variations in tumor size, and internal components.^10^ It frequently occurs in perimenopausal and postmenopausal patients but can occur in younger women, with mean ages in the fifth and sixth decades.^3^ Fibrothecomas are most reported as solid masses, infrequently containing cystic components.^11^ Ovarian fibrothecomas may present with pleural effusions or ascites, known as Meigs’ syndrome.^12^
Common diagnostic means for this group include ultrasonography (US), computed tomography (CT), and magnetic resonance imaging (MRI).^2^ US is the first-line imaging tool for detecting ovarian abnormalities. However, sonographic characteristics of fibrothecoma are often unspecific.^5^ Despite the rise of CT utilization recently, ovarian tumors are frequently misdiagnosed due to their variable CT appearances and associated variable increased serum cancer antigen 125 (CA 125) levels as many tumors can be presented with large mass, cystic changes, and ascites.^13^ MRI has better soft tissue resolution and superiority in showing the distinct appearances of ovarian tumors.^14^ Diffusion weighted imaging (DWI) is a functional MRI sequence that helps adnexal lesion characterization and provides information about the tissue microenvironment.^14^ However, previous studies concerning MRI features of fibrothecoma had a small number of included cases.^15^
Due to the rarity of fibrothecoma, the previous studies on imaging features in the literature had relatively small sample sizes.^1,2,5,16^ Therefore, throughout this study, we present an analysis of clinical and laboratory findings, and the radiological characteristic features of pathologically proven fibrothecomas in variable imaging modalities aiming for reliable preoperative diagnosis to address this void.
Patients and Methods
Study population
The institutional review board granted this retrospective study, and a waiver of informed consent was received. This cohort study included patients diagnosed with pathologically proven fibrothecoma between January 2011 and December 2023 from our center’s prospectively maintained database. One hundred three females were initially evaluated for inclusion. The patients were referred to our center for preoperative assessment. Tumor characteristics were confirmed from the medical records after pathological examination. We excluded 15 patients with missed clinical and pathological data, the final study cohort consisted of 88 consecutive patients who underwent CT or MRI of the abdomen and pelvis within 2–3 weeks before surgery.
Clinical and laboratory data
All the included patients underwent preoperative clinical examination, and basic laboratory tests (complete blood count, kidney and liver function test, coagulation profile, and virology screening and tumor markers: CA 125, carcinoembryonic antigen and CA 19-9. A pelvic ultrasound was performed as well as an anesthesia team consultation.
Sonographic examination
Routine ultrasound examinations were performed with conventional transabdominal and transvaginal techniques. Also, doppler imaging was done with optimized parameters.
CT technique
Contrast-enhanced CT scan was performed on a 128 multidetector CT scanner (GE Revolution). Scanning started from the level of the diaphragm to the symphysis pubis with the following CT scan acquisition parameters: 120 KVp, 220–400 mAs, a pitch of 1, section thickness of 5 mm, matrix 512 × 512, window width 400 and 0.5-seconds gantry rotation. Nonionic contrast medium (Omnipaque 350, GE Healthcare) was given at a 1.5 ml/kg dose with an injection rate of 3–4 mL/s. Image acquisition was attained with a delay of 70 second postcontrast injection. CT image raw data were then transferred onto a GE workstation for processing and reconstruction with a reconstruction slice thickness of 3 mm.
MRI technique
MRI was performed using a 1.5-T MR scanner (Philips Ingenia, Best, Netherlands). Patients fasted for 4–6 hours before imaging. The scan range was from the umbilicus to the symphysis pubis. Imaging started with routine imaging sequences including T2 weight images (T2-WI) in the axial and sagittal planes with and without fat suppression, T1WI in the axial and sagittal plane with and without fat suppression. Diffusion-weighted images were acquired before contrast administration using an axial single-shot echo-planar sequence with b values (0, 500, 1000 s/mm^2^). The postcontrast images (three dimensional gradient echo sequence with fat saturation, THRIVE, Philips) were acquired after IV administration of Gadoterate meglumine (0.1–0.2 mmol/kg) by automatic injector followed by 10 ml saline infusion. MRI images were processed on an extended MR Workspace 2.6.3.5, Philips Medical Systems.
Image interpretation
Image analysis was conducted by a consultant radiologist with 13 years of experience interpreting gynecological imaging. The images were assessed for the following features for each lesion: (1) the size (the maximum diameter in three orthogonal planes), (2) the location (right, left, or bilateral), (3) the tumor borders (smooth regular, lobulated or irregular), (4) presence of cystic changes, (5) US echogenicity (hypoechoic, isoechoic, mixed hyper-echoic), (6) US doppler vascularity, (7) MRI signal intensity characteristics on T2WI compared to the adjacent pelvic muscles (hypointense, isointense/intermediate, mixed hyper-intense), (8) DWI signal intensity was qualitatively assessed as low, intermediate or high signal similar for the pelvic bone, myometrium, and endometrium respectively. Corresponded apparent diffusion coefficient (ADC) maps were applicable using a Phillips Advantage Windows workstation to confirm restricted diffusion and differentiate it from the T2 Shine-Through Effect, (9) The degree of solid component enhancement was visually assessed on CT and MRI as mild (less than), moderate (equal) and marked (greater than) compared with the uterine myometrium enhancement, (10) functional estrogenic effect signs (endometrial thickening, uterine morphological changes), (11) degree of ascites (mild, moderate or marked), (12) other radiological signs (pleural effusion, and peritoneal disease).
Surgical procedures
The multidisciplinary team assessed the patients and decided on the treatment plan according to imaging findings, and performance status. All the patients underwent surgical intervention through an open or laparoscopic approach. This was followed by either salpingo-oophorectomy or total abdominal hysterectomy and bilateral salpingo-oophorectomy according to the previous decision. The patients underwent routine postoperative care and were discharged once being fit for discharge.
Pathological examination
The microscopic examination of the tumor was performed by expert pathologists, focusing on the tumor’s cellularity, fibrous component, and cystic degeneration. Routine hematoxylin and eosin staining was performed for every case and an immunohistochemical (IHC) examination was performed once indicated. Antibodies to smooth muscle actin, CD34, a-inhibin, vimentin, calretinin, and S-100 protein were used on need basis.
Statistical analysis
Data were entered and analyzed using IBM-SPSS software (IBM Corp. Released 2020. IBM SPSS Statistics for Windows, Version 27.0. Armonk, NY: IBM Corp). Quantitative data were initially tested for normality using Shapiro-Wilk’s test with data being normally distributed if p > 0.050. The presence of significant outliers was tested by inspecting boxplots. Quantitative data were expressed as median and interquartile range. Categorical data for two groups were compared by chi-square test, Fisher’s exact test, and Fisher-Freeman-Halton exact test. Numerical data for two and multiple groups were compared by Mann-Whitney U test, and Kruskal-Wallis H test, respectively. Spearman’s correlation was used to assess the direction and strength of association between two numerical variables while point biserial correlation was used to assess the association between a numerical variable with a dichotomous variable. For any of the used tests, results were considered statistically significant if p-value ≤0.050. Appropriate charts were used to graphically present the results.
Results
This study included 88 females with 90 ovarian fibrothecomas out of 1754 patients with ovarian tumors operated in this period. The clinical and radiological characteristics of the included patients are summarized in Table 1.
These characteristics were correlated with the maximum tumor diameter as described in Table 2 which shows the results of Spearman’s correlation revealing a statistically significant positive correlation of the largest tumor diameter with serum level of CA 125, the degree of ascites, and DWI signal intensity. It also shows the results of point biserial correlation which revealed a statistically significant correlation of the largest tumor diameter with ascites, cystic changes, abdominal enlargement, surgery type, and border type. There were no cases with cystic predominant fibrothecoma. The median of the largest tumor diameter was 13 cm versus 10 in those with and without ascites, 14 cm versus 11 in those with and without cystic changes, 19 cm versus 12 in those with and without abdominal enlargement, 12 cm versus 9 in open versus laparoscopic approach, and 20 cm versus 12 in those with lobulated versus smooth regular border.
There was a statistically significantly higher proportion of ascites in the larger versus smaller tumor group as shown in Table 3. All the 12 cases in the smaller tumor group had mild ascites. Most of the larger tumor group have mild ascites (34, 72.3%), 9 (19.1%) have moderate, and 4 (8.5%) have marked ascites. There was also a statistically significantly higher incidence of cystic changes, lobulated tumor borders, elevated CA 125 levels, and open versus laparoscopic surgery in the larger versus smaller tumor group.
A statistically significant difference in US echogenicity and DWI signal intensity (p = 0.003 and 0.043 respectively). So, dummy variables were created to compare each category versus the other two categories by performing multiple 2 × 2 Fisher’s exact tests with acceptance of statistical significance at p < 0.0167. This revealed statistically significantly higher hypoechoic lesions in the smaller tumor group (p = 0.001) but not for isoechoic (p = 0.099) and mixed hyper-echoic (p = 0.052), while no statistically significant differences in DWI low (p = 0.035), intermediate (p = 0.132), and high signal (p = 0.517).
Furthermore, there was a statistically significant difference in the largest tumor diameter between the three types of US echogenicity, MR T2, and DWI signal intensity (Table 4). Pairwise comparisons revealed a statistically significantly larger tumor diameter in mixed hyperintense T2 signal versus hypointense (p = 0.007) and intermediate (p = 0.010). Pairwise comparisons with Bonferroni correction for multiple tests revealed a significantly lower largest tumor diameter in hypoechoic echogenicity versus mixed echogenicity (p = 0.001) and isoechoic (p = 0.004) but not between isoechoic and mixed hyper-echoic (p = 0.671). Pairwise comparisons with Bonferroni correction for multiple tests revealed a significantly lower largest tumor diameter in low DWI signal versus high DWI signal (p = 0.042) but not between low versus intermediate DWI signal (p = 0.095) and intermediate DWI versus high DWI signal (p = 0.424). Demonstrative cases are illustrated in Figures 1 and 2.
Left ovarian Fibrothecoma in a 55-year-old woman presented with pelvic pain. (A) Color Doppler transvaginal sonography shows an isoechoic lesion with faint vascularity. (B and C) Postcontrast CT axial images show a hypovascular left ovarian lesion with moderate ascites and right-sided pleural effusion (Meigs’ syndrome). (D) Axial T2-WI revealed a lobulated left ovarian solid lesion of predominant intermediate signal with focal slight hyperintensity and minute cystic changes. (E) Axial DWI (high b value = 1000) revealed a predominant intermediate signal. (F) Axial fat-suppressed postcontrast T1-WI revealed mild enhancement less than the myometrium.
Huge right ovarian Fibrothecoma in a 67-year-old woman presented with abdominal enlargement. (A and B) sagittal and axial T2-WI revealed a large pelvi-abdominal lobulated mixed right ovarian lesion of mixed signal with predominant hyperintensity of cystic changes, associated endometrial thickening/hyperplasia, and marked ascites. (C) Axial DWI (high b value = 1000) revealed a predominant hyperintense signal (edema). (D and E) Axial fat-suppressed pre- and postcontrast T1 images revealed mild enhancement of the mass.
Discussion
Our cohort showed a statistically significant positive correlation of the largest tumor diameter with serum level CA 125, the degree of ascites, and the cystic changes. Furthermore, there were statistically significant differences in the largest tumor diameter between US echogenicity, T2 signal intensity, and DWI signal intensity.
To begin with the clinical presentation, the most prevalent symptom in our study was pelviabdominal pain (89.8%). Nearly 50% of fibrothecoma cases produce estrogen, leading to occasional vaginal bleeding and irregular menstruation.^17^ However, these tumors typically do not significantly impact the patient’s overall health.^18^ Although 10 of the included patients had endometrial hyperplasia, only 1 case presented with abnormal uterine bleeding. This was comparable with the previously reported studies.^19,20^
Meigs’ syndrome is a benign infrequent condition with symptoms disappearing after the excision of the ovarian mass,^21^ only one of our cases had Meigs’ syndrome with right-sided pleural effusion and ascites. That was in line with multiple previous studies.^2,15,16^ In 90% of cases, ovarian fibrothecal tumors are unilateral and rarely malignant.^22^ In our study, none of the included patients have been diagnosed with malignant fibrothecoma, similar to other previous studies.^2,15^
In addition, our result revealed elevated serum CA 125 (>35 IU/mL) in 55 (65.5%) patients with a significantly higher proportion of higher CA 125 levels in the larger versus smaller tumor group. Similarly, previous studies showed elevated CA 125 in 28%.^16^ Tumor markers, most frequently CA 125, have been utilized to assess the malignancy of ovarian lesions that show up questionable on imaging. According to our findings, the rise of CA 125 does not mean malignant transformation, but it copes more with size enlargement or the presence of ascites or even pleural effusion (Meigs’ syndrome). That was in line with the previous studies.^23–29^
By immunohistochemical staining, the majority of fibrothecomas are positive for inhibin A, vimentin, Ki 67, and SMA. Endometrial hyperplasia, postmenopausal bleeding, increased serum CA 125 levels, and positive expression of Ki 67 are examples of estrogenic effects of fibrothecoma.^17^ In our cohort, the postoperative pathology revealed endometrial hyperplasia in 10 out of 36 patients who underwent hysterectomy.
One of the US hallmark findings of fibrothecoma is a round, oval, or lobulated hypoechoic mass with mild to moderate vascularity, while cystic or hemorrhagic changes are relatively rarely detected.^30^ In the US, fibrothecoma tumors appear as solid masses that are frequently mistaken for pedunculated subserous fibroid tumors.^31^ Most of our cases were hypoechoic (47.7%) and isoechoic (37.2%). Similarly, previous studies revealed the predominant hypo-echogenicity of fibrothecomas.^10,16^
Our results showed a statistically significant difference in US echogenicity with a significantly lower largest tumor diameter in hypoechoic echogenicity versus mixed hyperechogenicity (p = 0.001) and isoechoic (p = 0.004). Similarly, a previous study reported that large tumors demonstrated mixed hyperechogenicity.^10^
On CT imaging, fibrothecomas usually show solid tumor shapes, unilaterality, faint contrast enhancement, and no lymphadenopathy or peritoneal involvement, these criteria can help to exclude the diagnosis of other ovarian malignant masses.^32^ When fibrothecoma is associated with cystic changes and elevated serum level CA 125, it may be misdiagnosed as epithelial ovarian carcinoma.^23^ Our results revealed mild CT enhancement in 98.4% of patients, while only one patient showed moderate enhancement and none of the included patients showed marked enhancement. That agreed with previous studies.^1,2^
Regarding the MRI, fibrothecomas usually exhibit low signal intensity on T2-WI and mild postcontrast enhancement because of low blood flow, fibrotic content, and plenty of collagen.^33^ Fibrothecomas are hypovascular tumors, and central necrosis is partially caused by insufficient blood supply, as evidenced by the positive link between tumor growth and cystic degeneration.^17^ In previous reviews, MRI has been used to recognize up to 82% of fibrothecomas.^5,10,34^ If the fibrothecoma is estrogenically active, MRI imaging may be the primary means of demonstrating associated uterine changes such as uterine enlargement and endometrial thickening.^33^ The MRI features of fibrothecomas vary according to the lesion size, larger fibrothecomas are more likely to have degenerative changes, edema, heterogeneous mixed T2 signals, and heterogeneous enhancement.^5^ Other sex cord-stromal tumors could be differentiated from fibrothecoma by specific MRI criteria; granulose cell tumor may appear as a multilocular cystic mass with thick septa (Swiss cheese-sign) with marked restricted diffusion and intense postcontrast enhancement of both solid tissue and septae.^35^
This study revealed a statistically significant difference in the largest tumor diameter between the T2 signal intensities with a statistically significantly larger tumor diameter in masses of mixed hyperintense T2 signal. That was in concordance with the previous retrospective study conducted on 27 ovarian fibrothecomas, unlike our results, the correlation with the DWI signal intensity was not performed.^15^
DWI is a functional rapid MRI sequence that adds excellent tissue contrast relying on microscopic water motion (Brownian motion).^14,36^ The available data on the DWI characteristic of fibrothecoma is few. We focused on the qualitative signal assessment in our study as a previous study revealed no significant difference in quantitative ADC measurements.^37^ Most of our cases revealed a DWI intermediate signal (27/37, 73%) with a statistically significant positive correlation between the largest tumor diameter and DWI signal intensity. Similarly, a previous study on 18 fibrothecomas revealed that 61.1% (11/18) of lesions showed intermediate DWI signal intensity.^37^ Unlike our results, the correlation between the DWI signal and the largest tumor diameter was not performed.
Our study has limitations. First, it is a retrospective study. Second, the small number of the included patients. Third, pathology was described by a heterogeneous group of pathologists. Fourth, the patients did not undergo the same imaging modalities. But it has points of strength also, it presents a decade and a half experience of a tertiary referral center. It presents one of the largest reported series ever. Also, the imaging modalities were all reviewed by the same radiologist. Lastly, in view of being a benign disease, no long-term follow-up data is available.
Conclusion
Fibrothecoma is a rare benign ovarian tumor that may be associated with ascites and elevated serum level CA 125. We found a statistically significant positive correlation between the largest tumor diameter with serum level CA 125 and the amount of ascites. On imaging, it shows mild enhancement in both CT and MRI, with a statistically significant positive correlation of the largest tumor diameter with T2 and DWI signal intensity.
The reference list from the paper itself. Each links out to its DOI / PubMed record.
- 1Pat JJ, Rothnie KKM, Kolomainen D, et al. CT review of ovarian fibrothecoma. Br J Radiol 2022;95(1136):20210790; doi: 10.1259/bjr.2021079035451310 PMC 10162058 · doi ↗ · pubmed ↗
- 2Zhang Z, Wu Y, Gao J. CT diagnosis in the thecoma–fibroma group of the ovarian stromal tumors. Cell Biochem Biophys 2015;71(2):937–943; doi: 10.1007/s 12013-014-0288-725315640 · doi ↗ · pubmed ↗
- 3Chen VW, Ruiz B, Killeen JL, et al. Pathology and classification of ovarian tumors. Cancer: Interdisciplinary International Journal of the American Cancer Society 2003;97(10 Suppl):2631–2642; doi: 10.1002/cncr.1134512733128 · doi ↗ · pubmed ↗
- 4Javadi S, Ganeshan DM, Jensen CT, et al. Comprehensive review of imaging features of sex cord-stromal tumors of the ovary. Abdom Radiol (NY) 2021;46(4):1519–1529; doi: 10.1007/s 00261-021-02998-w 33725145 · doi ↗ · pubmed ↗
- 5Shinagare AB, Meylaerts LJ, Laury AR, et al. MRI features of ovarian fibroma and fibrothecoma with histopathologic correlation. AJR Am J Roentgenol 2012;198(3):W 296–W 303; doi: 10.2214/AJR.11.722122358029 · doi ↗ · pubmed ↗
- 6Kurman RJ, Carcangiu ML, Herrington CS, et al. Classification of tumours of the ovary. WHO Classification of Tumours 2014;6:44–56.
- 7Roth LM, Czernobilsky B. Perspectives on pure ovarian stromal neoplasms and tumor-like proliferations of the ovarian stroma. Am J Surg Pathol 2011;35(3):e 15–e 33; doi: 10.1097/PAS.0b 013e 31820 acb 8921317704 · doi ↗ · pubmed ↗
- 8Young RH. Ovarian sex Cord–Stromal tumors: Reflections on a 40-year experience with a fascinating group of tumors, including comments on the seminal observations of Robert E. Scully, MD. Arch Pathol Lab Med 2018;142(12):1459–1484; doi: 10.5858/arpa.2018-0291-RA 30500284 · doi ↗ · pubmed ↗