Associations between absolute and relative handgrip strength with fitness and fatness
David Abdelnour, Mark Grove II, Keegan Pulford-Thorpe, Keaton Windhurst, Charlee LeCrone, Edward Kerr III, Tamara Hew-Butler

TL;DR
This study shows that handgrip strength is linked to body composition and physical fitness in young adults.
Contribution
The paper introduces a new perspective on how absolute and relative handgrip strength correlate with health markers.
Findings
Absolute handgrip strength is strongly linked to lean mass and vertical jump performance.
Relative handgrip strength is negatively associated with body fat and positively with VO2 max.
Lower relative handgrip strength scores may indicate higher body fat levels.
Abstract
The main purpose of this study was to assess relationships between absolute and relative handgrip strength (HGS) versus other markers of health (body composition) and physical fitness (VO 2 max, vertical jump) in 220 (112 male) healthy young adults (25±10 years). HGS was measured using a hand dynamometer. Absolute HGS represented the highest grip strength measurement (kg) of the right and left hand combined, while relative HGS represented the absolute HGS divided by body weight (kg/kg). Body composition (lean and fat mass) was measured using dual energy x-ray absorptiometry. VO 2 max was measured using a treadmill peak speed protocol (ml/kg/min), while vertical jump was assessed using a countermovement jump (cm). Absolute HGS (mean=86±22 kg) was positively related with lean mass (r=0.82, p<0.001) and vertical jump (r=0.63, p<0.001), while relative HGS (mean=1.2±0.2 kg/kg) was negatively…
Genes, proteins, chemicals, diseases, species, mutations and cell lines named across the full text — each resolved to its canonical identifier and authoritative record.
Click any figure to enlarge with its caption.
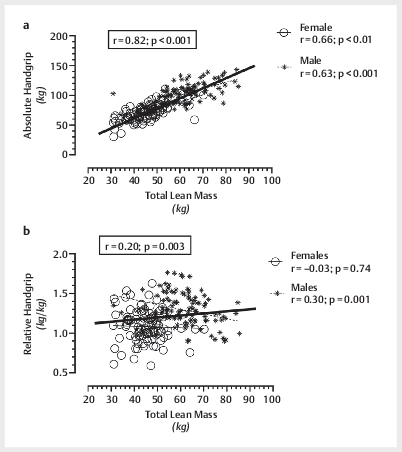 Fig. 1
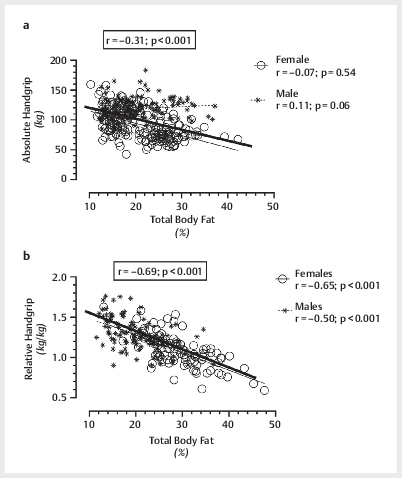 Fig. 2
| Handgrip Strength |
Age
|
BMI
|
LM
|
BF
| Z- score |
VAT
|
SBP
|
DBP (
|
RHR
|
BG
|
VO
2
|
VJ
|
|---|---|---|---|---|---|---|---|---|---|---|---|---|
|
| –0.05 | 0.34*** | 0.82*** | –0.53*** | 0.22* | 0.20*** | 0.49*** | 0.02 | –0.09 | 0.08 | 0.21** | 0.63*** |
|
| –0.09 | –0.37*** | 0.20** | –0.69*** | 0.01 | –0.35 | 0.22** | –0.08 | –0.13 | 0.04 | 0.47*** | 0.45*** |
| Variable | Total | Male | Female | p-value |
Cohen’s
|
|---|---|---|---|---|---|
|
|
25±10
| 25±9 | 25±11 | 0.59 | 0.06 |
|
|
1.71±0.10
| 1.77±0.08 | 1.65±0.06 | <0.001 | 1.2 |
|
|
72.9±15.1
| 80.0±14.7 | 65.6±11.6 | <0.001 | 0.95 |
|
|
24.7±4.1
| 25.3±4.1 | 24 .0±3.9 | 0.01 | 0.35 |
|
|
53.3±12.2
| 61.6±10.1 | 44.8±7.3 | <0.001 | 1.38 |
|
|
24.4±7.2
| 19.9±5.2 | 28.9±6.0 | <0.001 | 1.25 |
|
|
–0.1±0.9
| –0.1±0.8 | –0.1±0.9 | 0.75 | 0.05 |
|
|
52.5±23.5
| 60.6±19.4 | 44.2±24.5 | <0.001 | 0.70 |
|
|
122±15
| 129±14 | 115±9 | <0.001 | 0.90 |
|
|
75±9
| 76±14 | 76±14 | 0.88 | 0.00 |
|
|
75±14
| 73±14 | 76±13 | 0.08 | 0.21 |
|
|
86±14
| 86±15 | 85±13 | 0.80 | 0.07 |
| Variable | Total | Male | Female | p-value |
Cohen’s
|
|---|---|---|---|---|---|
|
|
86±22
| 102±17 | 70±14 | <0.001 | 1.45 |
|
|
51±15
| 58±13 | 43±10 | <0.001 | 1.00 |
|
|
4348±1275
| 5178±1094 | 3489±789 | <0.001 | 1.32 |
|
|
43±10
| 47±11 | 40±11 | <0.001 | 0.70 |
|
|
1.2±0.2
| 1.3±0.2 | 1.1±0.2 | <0.001 | 1.00 |
Peer Reviews
No public reviews on file for this paper yet. If you reviewed it on a platform where reviews are public (OpenReview, ICLR, NeurIPS, ICML), you can paste yours below so the community can read it here.
Videos
No videos yet. Explain this paper in a talk, walkthrough, or lecture? Add one.
Taxonomy
TopicsNutrition and Health in Aging · Body Composition Measurement Techniques · Muscle metabolism and nutrition
Introduction
Handgrip strength (HGS) is a quick, simple, and portable measure of generalized muscle strength and physical functioning, particularly in elderly populations 1 2 3 . However, the measurement of maximum isometric handgrip force is often applied in a vague and inconsistent manner across populations. Epidemiological studies, largely conducted in older populations, confirm that low absolute HGS is a surrogate marker for muscle weakness, which are then strongly associated with cardiovascular disease 2 , dementia 4 , cancer 5 , disability 3 , and all-cause mortality 1 2 . More clinically relevant HGS thresholds remain under-developed, however, due to a lack of both clarity and standardization of measurement. For example, maximum HGS thresholds of 42 kg for males and 25 kg for females were estimated to reduce all-cause mortality in a prospective study performed on ~64-year-old adults from 28 countries 6 . Whether or not these mortality thresholds represent a single HGS or both HGSs combined remains unclear.
Thus, the difficulty interpreting HGS – and the practical application of these values – is largely due to the high variability in reporting. While the reporting of absolute HGS values is common, the reporting of single hand (right or left) 7 8 versus double hand (right plus left hand) 4 5 or using the average score 4 5 versus the highest score 9 alter the practical utility of HGS across studies. Furthermore, HGS has also been reported in Newtons 3 10 , quartiles 4 5 11 , quintiles 3 , and/or normalized by dividing absolute HGS by body mass index (BMI) 11 12 and body weight 13 14 . Thus, although evidence supports that low HGS is associated with death, disease, and disability the clinical utility of providing a unified, practical, metric to assess health in real time is lacking.
In contrast to the robust amount of data obtained from older populations, the utility of HGS to predict health and disease in younger populations remains under-investigated. In (young) elite athletic populations, absolute HGS is related with upper and lower body strength, impulsive (jumping) ability, body mass, lean muscle mass, age, and training experience 15 . Of greater clinical utility, the normalization of HGS, by dividing absolute HGS by body weight, has produced cut-off thresholds that predict both diabetes risk 13 and metabolic syndrome (MetS) 14 in middle-aged adults. Thus, relative HGS (rather than absolute HGS) may be a more practical and universally applied metric to assess fitness, health and/or disease risk in non-elderly populations.
Therefore, the main purpose of this study is to assess relationships between both absolute and relative HGS versus markers of metabolic health (blood pressure, resting heart rate, fasted blood glucose, and visceral adipose tissue), physical health (body composition), and performance (VO 2 max, vertical jump) in a convenience sample of young, healthy, adults. A secondary purpose is to establish a predictive model, for both absolute and relative HGS, utilizing these select markers of health (physical and metabolic) and (fitness) performance. A tertiary purpose is to evaluate mean thresholds for HGS that would translate across average health and fitness metrics in young adults.
Methods
Participants
This observational, cross-sectional study (IRB#073919M1E) recruited a convenience sample of both male and female participants from Detroit and the greater metropolitan area. The inclusion criteria represented any able-bodied individual (i. e., who can run on a treadmill until volitional exhaustion) between the ages of 18–100 years old. Any participant with medical conditions that may be exacerbated by running on a treadmill to volitional exhaustion (VO ^2^ max test), were asked to obtain clearance from their medical practitioner before participating in this study. The only exclusion criteria was any menstruant female who was pregnant (or thought they might be pregnant), due to radiation exposure concerns from the dual energy x-ray absorptiometry – or DXA – scan, which may be harmful to a developing fetus. This study served to provide a “snapshot” of baseline metrics, to launch ongoing longitudinal investigations (and interventions) for local community members.
All participants were asked to arrive at the laboratory in exercise attire after a 4-hour fast (i. e., no food or drink, other than water when thirsty) and sign written informed consent prior to participation. All females of child-bearing age were asked to complete a pregnancy attestation form, confirming that they were not pregnant (or think they were pregnant) prior to participation.
We assessed metabolic health through measurement of four parameters: resting blood pressure (BP), resting heart rate (RHR), fasted blood glucose (BG), and visceral adipose tissue (VAT; obtained from the DXA scan). We assessed physical health via whole body composition analyses (measuring three compartments: lean, fat, and bone mass). We assessed physical fitness (i. e., performance) using three different tests that measured: cardiorespiratory fitness (VO 2 max), muscular strength (handgrip), and muscular power (vertical jump height). The exact procedures are detailed below, as represented sequentially, in our ~60-minute study protocol.
Protocol
After written informed consent was obtained, each participant sat quietly for 5-minutes to achieve a resting, steady-state condition prior to blood pressure (BP) measurement. With both feet flat on the ground, back upright, with both forearms placed supine on the table, resting blood pressure was measured once on the right arm using an automated BP cuff (OMRON 3, Kyoto, Japan). Systolic blood pressure (SBP), diastolic blood pressure (DBP), and resting heart rate (RHR) were recorded.
Next, still in a seated position, a fingerstick fasting blood glucose (BG) was measured using a portable analyzer (GE100 Blood Glucose Monitoring Kit, Ontario, CA) and aseptic technique.
Height and weight were measured using a stadiometer and electronic scale (SECA 763, Hamburg, Germany), with participants wearing only compression shorts and a sports bra (females), without shoes. Body composition was assessed using a whole body DXA scan (Horizon A, APEX System software version 5.6.0.5, TBAR2019 calibration; Hologic, Marlborough, MA). All DXA scans were performed and analyzed by a single trained operator, according to the manufacturer’s specifications 16 .
After body composition measurement, handgrip strength (HGS) was measured using a digital hand dynamometer (Handexer, South El Monte, CA). In a standing position, both elbows were simultaneously flexed to a 90º angle with the wrists held in a neutral position. Maximal HGS was measured, with verbal encouragement, per hand (3-second max contractions, with a 30-second rest between trials, alternating the dynamometer between hands). Both hands were tested three times, with the sum of the highest value (kg), for both the right and left hands, representing the absolute HGS score 17 . Relative HGS (absolute HGS in kg divided by body weight in kg) was also calculated to normalize strength per body mass, as calculated previously 13 14 .
A standing vertical jump test was then performed, using a Vertec jump trainer (Vertec Gen2, Cranston, RI). The highest of three countermovement jump attempts was recorded. We chose to report vertical jump in inches, to compare with other normative values (measured in inches) more easily but also converted to peak power output using the following equation: peak power (watts)=60.7 x (jump height [cm])+45.3 x (body mass [kg]) – 2055.
Lastly, aerobic fitness (VO 2 max) was assessed on a motorized treadmill (Lode Valiant 2 Sport, Groningen, Netherlands). Oxygen uptake was measured continuously using a metabolic cart (Parvo Medics TrueOne 2400, Sandy, UT) with maximal oxygen consumption defined as the highest value obtained before volitional exhaustion. The exercise protocol utilized was a peak treadmill speed running test, whereas all participants started at a comfortable walking or running speed. After 1 min, the treadmill speed increased 0.5 mph every minute until participants could no longer keep pace with the treadmill (volitional exhaustion) 18 .
Statistical analysis
Unpaired t-tests were used to confirm expected sex differences in health and performance metrics. Simple regression analyses (Pearson’s r) were utilized to assess relationships between our two main outcome measures, absolute HGS and relative HGS, versus indicators of metabolic and physical health as well as physical performance. Prediction equations, for both absolute and relative HGS (dependent variables), were generated using stepwise linear regression models. The independent variables demonstrating the strongest statistical significance with the two dependent variables ( Table 3 ) were sequentially added into the general linear model. The final prediction models, for both absolute and relative HGS, included only those independent variables that retained statistical significance (p<0.05) as predictors within the linear model. The adjusted R ^2^ for each linear model reflected the variance that the combined independent variables contribute to each dependent variable (i. e., absolute and relative HGS).
: Table 3 Correlation coefficients (r) for analyses comparing both absolute HGS and relative HGS versus demographic (age, BMI), body composition (LM, BF, Z-score), metabolic (VAT, SBP, DBP, and BG), and physical performance (VO2, VJ) variables, for combined data (N=220). BMI=body mass index; LM=lean mass; BF=body fat; VAT=visceral adipose tissue; SBP=systolic blood pressure; DBP=diastolic blood pressure; RHR=resting heart rate; BG=blood glucose; VO2=VO2 max; VJ=vertical jump.
Effect sizes to determine the magnitude of effects 19 were expressed using Cohen’s d with small (0.2), medium (0.5), and large (0.8) magnitude of effects calculated for both the unpaired t-tests (male mean – female mean/pooled SD) and regression correlations (using the r-value/ correlation coefficient) 20 . A power analysis, conducted on a similar cross-sectional study assessing relationships between HGS and VO 2 max on a convenience sample of male and female elderly outpatients, calculated a sample size of 160 participants necessary to achieve 95% power, α=0.05, β=0.05, with an anticipated effect size=0.15 (G*Power 3.1.9.2.; Heinrich-Heine-Universität, Düsseldorf, Germany) 8 . All data reported as mean±standard deviation (SD), with statistical significance set a priori at p<0.05. Both Cohen’s d and statistical significance were reported, offering two distinct perspectives on the translational (practical) interpretation of “significance.”
Results
A total of 220 (112 male, 51% and 108 female, 49%) participants completed the full testing protocol. In our reporting of means (±SD), we have separated our cohort into males and females to confirm the expected sex-specific differences well-documented in body composition and performance metrics verified and reported elsewhere 17 . The average demographic (age, height, weight, body mass index/BMI), body composition (lean, fat, and bone mass), and metabolic health (VAT, SBP, DBP, RHR, BG) metrics for males, females, and the total cohort combined are summarized in Table 1 . As expected, large effects sizes (>0.8 for Cohen’s d ) were noted between male and female participants with respect to sex-related differences in lean mass, body fat percentage, and systolic blood pressure.
: Table 1 Demographic (age, height, weight, body mass index/BMI), body composition (lean, fat, and bone mass) and metabolic (VAT, resting heart rate, blood pressure, and blood glucose) data for all (total; N=220), male (n=112), and female (n=108) participants. Data expressed as mean±SD (min-max). The magnitude of difference between male and female participants are demonstrated using both the p-values (from unpaired t-tests) and effect size (from Cohen’s d ). BMI=body mass index; BMD=bone mineral density; VAT=visceral adipose tissue; BP=blood pressure.
Table 2 shows the mean performance metrics of all (total), male, and female participants. As expected, large effect sizes (>0.8 for Cohen’s d ) between male and female participants were seen in absolute and relative HGS, vertical jump, and peak power.
: Table 2 Physical performance metrics data for all (Total), male, and female participants. Data expressed as mean±SD (min-max). The magnitude of difference between male and female participants are demonstrated using both the p-values (from unpaired t-tests) and effect size (from Cohen’s d ).
Table 3 details linear relationships between our two main outcome measures, absolute and relative HGS, versus demographic (age, BMI), body composition (lean mass, % body fat, and BMD Z-score), metabolic health (VAT, SPB, DBP, and BG), and performance (VO2 max, vertical jump) metrics.
Fig. 1 demonstrates correlations between absolute HGS ( Fig. 1a ) and relative HGS ( Fig. 1b ) versus total lean mass, for the total cohort and separated by sex. Fig. 2 demonstrates correlations between absolute HGS ( Fig. 2a ) and relative HGS ( Fig. 2b ) versus total body fat percentage, for the total cohort and separated by sex. A large effect size was noted when male and female participants were combined between absolute HGS versus total lean mass ( Fig. 1a ), while a medium to large effect size was noted between relative HGS versus body fat% ( Fig. 2b ).
Relationships between absolute (total handgrip or right plus left) handgrip score versus whole body lean mass ( a ) and relative (total handgrip score/body weight) handgrip score versus whole body lean mass ( b ) for males, females, and the combined cohort.
Relationships between absolute (total handgrip or right plus left) handgrip score versus total body fat percentage ( a ) and relative (total handgrip score/body weight) handgrip score versus total body fat percentage ( b ) for males, females, and the combined cohort.
Stepwise linear regression models identified three significant predictors for absolute HGS: lean mass, vertical jump height, and body fat (multiple R=0.84; adjusted R ^2^ =0.71; F=176.99; p<0.001). From this linear model, the prediction equation for absolute HGS is:
Absolute HGS (kg)=18.62–0.40 (body fat in %)+1.22 (lean mass in kg)+0.24 (vertical jump height in cm). Thus, more practically speaking, every 0.4% decrease in body fat or 1.2 kg increase in lean mass, or 0.24 cm increase in vertical jump height would result in a 1 kg increase in absolute HGS.
Stepwise linear regression identified two significant predictors for relative HGS: body fat and lean mass (multiple R=0.69; adjusted R ^2^ =0.49; F=104.6; p<0.001). From this linear model, the prediction equation for relative HGS is:
Relative HGS (kg/kg)=1.90–0.2 (body fat in %) – 0.002 (lean mass in kg). Thus, more practically speaking, every 0.2% decrease in body fat or 0.002 decrease in lean mass would result in an increase in relative HGS.
Discussion
The main conclusions derived from this study suggests that absolute HGS is strongly and positively related to lean mass, while relative HGS is strongly and negatively related to body fat percentage, in this cohort of young (~25 years old), metabolically healthy ( Table 1 ), and physically fit ( Table 2 ) individuals. The robust relationship seen in the current study between absolute HGS versus total lean mass ( Fig. 1a ) complements previous studies that confirm that low absolute HGS is associated with sarcopenia 21 , muscle weakness 5 , and disability later in life 3 . The present findings (from a young, healthy cohort) thereby extend previous findings (from older, less healthy cohorts) suggesting that in absolute terms, individuals with the highest HGS have greater amounts of lean mass.
In addition to absolute HGS, we measured relative HGS by dividing absolute HGS by body weight (kg/kg), to normalize muscular strength and eliminate the overall size bias. A previous study performed on>1 million Swedish young men demonstrated that the handgrip/body weight ratio was a strong predictor of disability and musculoskeletal disorders later in life 10 . Similarly, relative HGS thresholds for diabetes risk in middle-aged adults (mean age ~33 years) was estimated at 0.78 for males and 0.57 for females using data extracted from the National Health and Nutrition Examination Survey (NHANES) 13 . Relative HGS cut-offs for metabolic syndrome (MetS), from data obtained from 1795 Columbian college students, demonstrated that 34.6% of the weakest males (relative HGS<0.466) had MetS, while 18.0% of weakest females (relative HGS<0.437) had MetS 14 . Absolute grip strength failed to show similar associations with MetS 22 .
Data on relative HGS from the current study extends these diabetes risk and MetS threshold data 13 14 by identifying a threshold for optimal health rather than disease. We found that a relative HGS>1.2 (1.3 for males and 1.1 for females, whereas an individual’s absolute grip strength exceeded body weight) was congruent with markers of good metabolic health ( Table 1 ) and physical fitness ( Table 2 ). Moreover, the strong negative association between relative HGS versus body fat percentage ( Fig. 2b ) highlights the probability, confirmed by linear modeling in the current study, that excess body fat reduces relative HGS (<1.0) towards previously estimated cut-off thresholds that predict both diabetes 13 and MetS 14 . Thus, our data concur with prior conclusions that increased body weight is the strongest predictor of disability later in life 10 but offers additional clarity by adding that body fat compartmental expansion likely serves as the primary mediator for both metabolic disease 13 14 23 and disability 10 .
Participants in the current study were largely young, metabolically healthy, and physically fit. The average BMI was within the normal range (<24.9 kg/m ^2^ ), with males slightly over the overweight threshold (25.3 kg/m ^2^ ) likely due to increased lean mass 24 . Metrics of metabolic health such as blood pressure, RHR, VAT, and BG levels were within the normal ranges 25 26 27 , with the exception of slightly elevated resting SBP values (129 mmHg) in our male cohort. Previous studies conducted in older (~65 years) populations document inverse relationships between HGS and hypertension 9 . Our data showed unexpected positive correlations between both absolute and relative HGS versus SBP, which contradicts many studies that suggest that resistance training decreases blood pressure 28 . Any potential negative effects of increased muscle strength on blood pressure in fit young males thereby requires further study.
In addition to our participants being metabolically healthy, the average VO 2 max values for both the male (47 ml/kg/min) and female (40 ml/kg/min) cohorts would categorize their aerobic fitness between “fair” and “good” 17 . Similarly, the average vertical jump values for males (23”) and females (17”), would classify them as average or above-average in comparison with other young healthy adults 29 . Coupled with average absolute HGS values that were classified as “good” (males) and “excellent” (females), we confirm that our convenience sample was physically fit in addition to being metabolically healthy.
Lastly, significant, positive relationships (medium effect size, Table 3 ) between relative HGS verses both VO 2 max and vertical jump (lower extremity power) suggests that normalized HGS may be a surrogate marker for overall physical fitness – not just localized forearm strength. This finding aligns with previous studies conducted on older adults (>65 years), whereas HGS estimated not only aerobic fitness 7 8 but also flexibility, balance and coordination, and overall physical fitness 7 . Therefore, we suggest that relative HGS be viewed as a more holistic marker of overall fatness and fitness than absolute HGS. Improvements in relative HGS would thereby require improvements in overall metabolic health (decrease body fat) and general physical fitness (aerobic fitness, upper and lower body strength improvements) to improve low relative HGS values (<1.0) into a healthier range (>1.0).
The limitations of the current study include a bias towards a physically fit sample. Our cross-sectional screening mainly attracted participants who were already physically active, despite our best efforts to recruit more sedentary college students. Our skewed sample of fit individuals, who exercise regularly, limits the broader interpretation of these findings to more sedentary populations. Nonetheless, our findings complement the large body of literature collected from older, diseased populations. One additional limitation was our assumption that the Handexer dynamometer was accurate (because it was FDA-approved). As such we did not perform any additional calibrations during data collection to ensure these data were accurate against a known standard.
In conclusion, our regression analyses and linear models confirm that higher absolute HGS is strongly biased towards larger, more muscular individuals. Conversely, higher relative HGS is most strongly biased towards individuals with lower body fat percentages. Our “average” data (means±SD), for all health and performance measures, would suggest that a relative HGS>1.0 (whereas an individual’s grip strength exceeds body weight) may be a quick, simple, cost-effective, and clinically useful indicator of overall metabolic health and physical fitness in young adults, worthy of further study as a holistic marker of health.
The reference list from the paper itself. Each links out to its DOI / PubMed record.
- 1Soysal P Hurst C Demurtas J Handgrip strength and health outcomes: Umbrella review of systematic reviews with meta-analyses of observational studies J Sport Health Sci 20211029029510.1016/j.jshs.2020.06.00932565244 PMC 8167328 · doi ↗ · pubmed ↗
- 2López-Bueno R Andersen L L Calatayud J Associations of handgrip strength with all-cause and cancer mortality in older adults: a prospective cohort study in 28 countries Age Ageing 202251 afac 11710.1093/ageing/afac 11735639798 PMC 9351371 · doi ↗ · pubmed ↗
- 3Henriksson H Henriksson P Tynelius P Muscular weakness in adolescence is associated with disability 30 years later: a population-based cohort study of 1.2 million men Br J Sports Med 2019531221123010.1136/bjsports-2017-09872329921654 · doi ↗ · pubmed ↗
- 4Esteban-Cornejo I Ho F K Petermann-Rocha F Handgrip strength and all-cause dementia incidence and mortality: findings from the UK Biobank prospective cohort study J Cachexia Sarcopenia Muscle 2022131514152510.1002/jcsm.1285735445560 PMC 9178163 · doi ↗ · pubmed ↗
- 5Celis-Morales C A Welsh P Lyall D M Associations of grip strength with cardiovascular, respiratory, and cancer outcomes and all cause mortality: prospective cohort study of half a million UK Biobank participants Bmj 2018361 k 165110.1136/bmj.k 165129739772 PMC 5939721 · doi ↗ · pubmed ↗
- 6López-Bueno R Andersen L L Koyanagi A Thresholds of handgrip strength for all-cause, cancer, and cardiovascular mortality: A systematic review with dose-response meta-analysis Ageing Res Rev 20228210177810.1016/j.arr.2022.10177836332759 · doi ↗ · pubmed ↗
- 7Kim S H Kim T Park J C Usefulness of hand grip strength to estimate other physical fitness parameters in older adults Sci Rep 2022121749610.1038/s 41598-022-22477-636261687 PMC 9581452 · doi ↗ · pubmed ↗
- 8Sugie MH K Takahashi T Nara M Relationship between hand grip strength and peak VO 2 in community-dwelling elderly outpatients JCSM Clinical Reports 2018311010.17987/jcsm-cr.v 3i 1.48 · doi ↗