Genomic prediction and QTL analysis for grain Zn content and yield in Aus-derived rice populations
Tapas Kumer Hore, C. H. Balachiranjeevi, Mary Ann Inabangan-Asilo, C. A. Deepak, Alvin D. Palanog, Jose E. Hernandez, Glenn B. Gregorio, Teresita U. Dalisay, Maria Genaleen Q. Diaz, Roberto Fritsche Neto, Md. Abdul Kader, Partha Sarathi Biswas, B. P. Mallikarjuna Swamy

TL;DR
This study identifies genetic regions (QTLs) linked to zinc content and yield in rice, aiming to improve zinc biofortification for better nutrition.
Contribution
The paper reports novel QTLs for grain zinc and yield in rice populations, including a QTL co-located with a known zinc transport gene.
Findings
56 QTLs for seven traits and 16 QTLs for yield and zinc were identified across four rice populations.
qZn7.1 had the highest phenotypic variance (17.8%) and additive effect (2.5 ppm) for grain zinc content.
Multi-trait genomic prediction accuracy was 0.24 for yield and 0.16 for zinc.
Abstract
Zinc (Zn) biofortification of rice can address Zn malnutrition in Asia. Identification and introgression of QTLs for grain Zn content and yield (YLD) can improve the efficiency of rice Zn biofortification. In four rice populations we detected 56 QTLs for seven traits by inclusive composite interval mapping (ICIM), and 16 QTLs for two traits (YLD and Zn) by association mapping. The phenotypic variance (PV) varied from 4.5% (qPN4.1) to 31.7% (qPH1.1). qDF1.1, qDF7.2, qDF8.1, qPH1.1, qPH7.1, qPL1.2, qPL9.1, qZn5.1, qZn5.2, qZn6.1 and qZn7.1 were identified in both dry and wet seasons; qZn5.1, qZn5.2, qZn5.3, qZn6.2, qZn7.1 and qYLD1.2 were detected by both ICIM and association mapping. qZn7.1 had the highest PV (17.8%) and additive effect (2.5 ppm). Epistasis and QTL co-locations were also observed for different traits. The multi-trait genomic prediction values were 0.24 and 0.16 for YLD…
Genes, proteins, chemicals, diseases, species, mutations and cell lines named across the full text — each resolved to its canonical identifier and authoritative record.
Click any figure to enlarge with its caption.
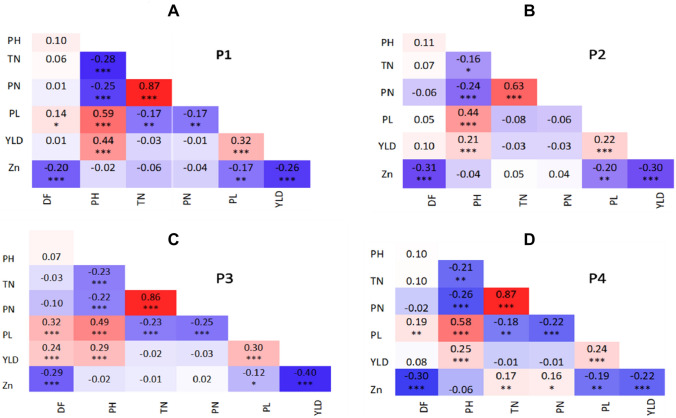 Figure 1
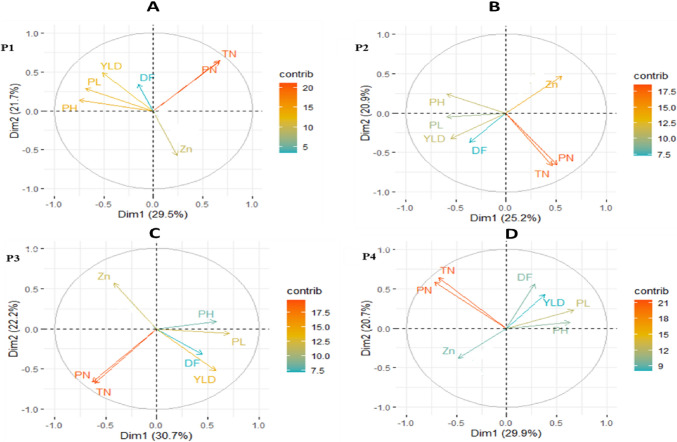 Figure 2
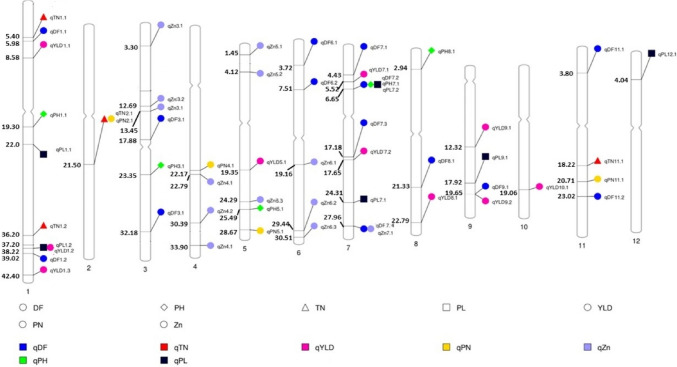 Figure 3
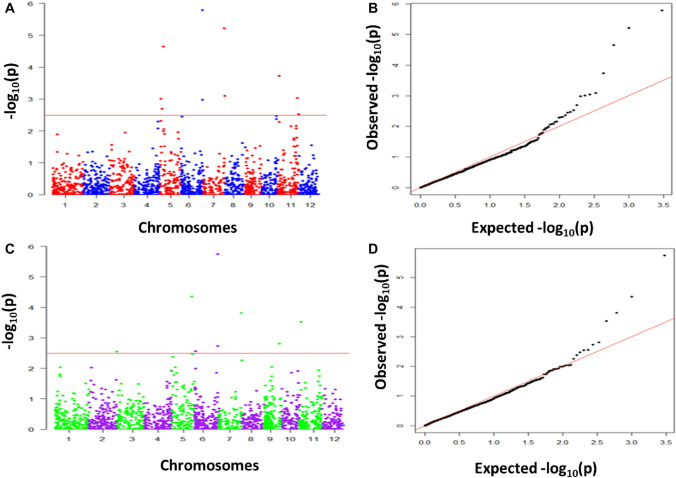 Figure 4
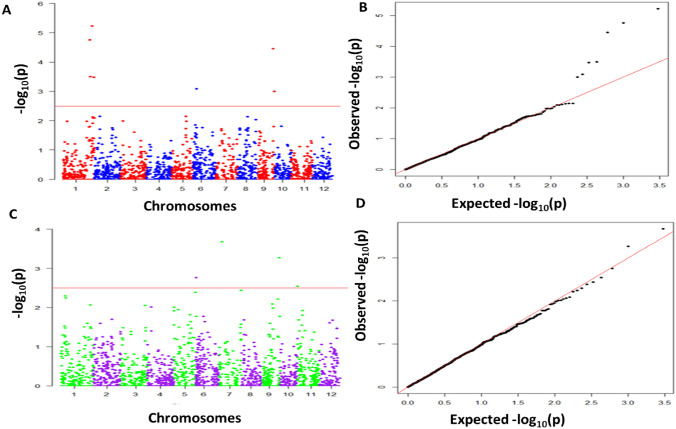 Figure 5
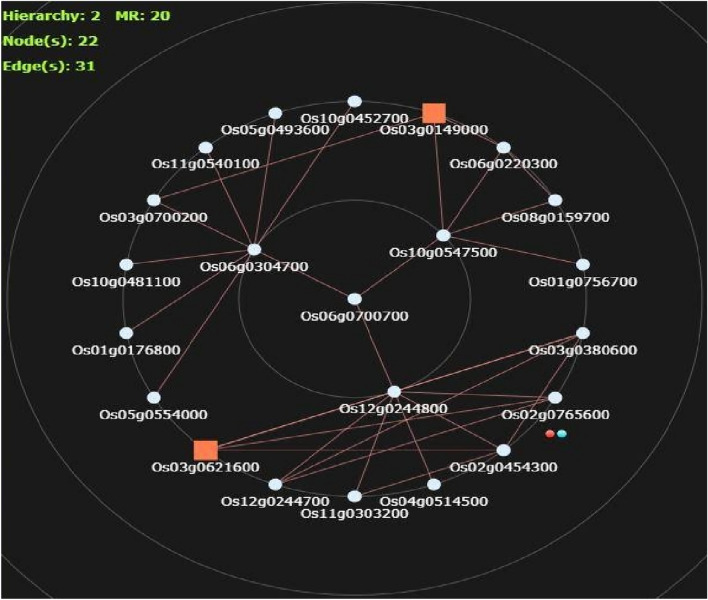 Figure 6
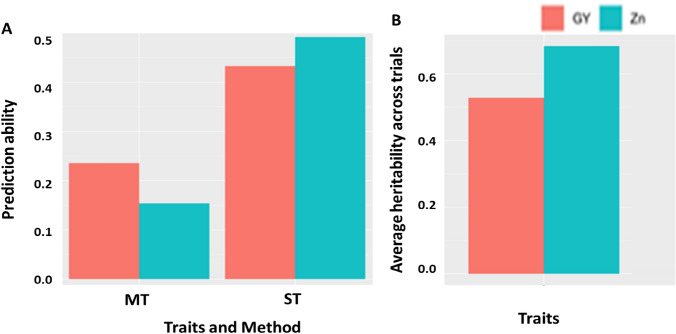 Figure 7
- —http://dx.doi.org/10.13039/100000865Bill and Melinda Gates Foundation
Peer Reviews
No public reviews on file for this paper yet. If you reviewed it on a platform where reviews are public (OpenReview, ICLR, NeurIPS, ICML), you can paste yours below so the community can read it here.
Videos
No videos yet. Explain this paper in a talk, walkthrough, or lecture? Add one.
Taxonomy
TopicsPlant Micronutrient Interactions and Effects · Rice Cultivation and Yield Improvement · Genetic Mapping and Diversity in Plants and Animals
Introduction
Zinc (Zn) is critical for human health due to its vital role in diverse metabolic processes, catalytic activities, and highly essential for the functioning of numerous proteins (Aggett 2020; Thompson 2022). Zn deficiency causes stunting, diarrhea, reduced immunity, poor growth and development, and increased vulnerability to diabetes and COVID-19. Severe Zn deficiency is even linked to maternal and child mortality (Aggett 2020; Farooq et al. 2020; Hussein et al. 2021; Peramaiyan et al. 2022; Ryu and Aydemir 2020; Shahzad et al. 2014; Vogel-González et al. 2021). Particularly prevalent in impoverished and marginalized populations relying solely on staple cereals for their nutritional needs, the lack of resources, access to a diverse diet, supplementation, or fortified foods exacerbates Zn deficiency-related health issues (Semba et al. 2022). With estimates indicating that over half of the global population faces micronutrient deficiency (Palanog et al. 2019; Shahzad et al. 2014), addressing health and nutrition of children, women, and vulnerable populations has become a pressing global health priority aligned with sustainable development goals (Global Nutrition Report 2021).
Biofortification of staple food crops has been taken up to tackle nutritional deficiencies in the developing world (Bouis and Saltzman 2017; Pradhan et al.2020). Rice is biofortified with Fe, Zn and Vitamin A, and other important mineral elements (Calayugan et al. 2021; Kader et al. 2020; Swamy et al. 2021). However, increasing the grain Zn content of the popular rice varieties by 6–12 ppm in the endosperm has been the major focus; these varieties can meet up to 30–40% of the estimated daily average requirement of Zn, which is enough to overcome most of the Zn deficiency-related health problems in the target populations (Pradhan et al. 2020; Swamy et al. 2016). The initial success, especially in South Asia, South East Asia, and Africa (Kader et al. 2021; Palanog et al. 2019), has spurred demand for Zn-enriched rice varieties in other target countries and paved the way for mainstream Zn breeding to make grain Zn an integral trait in all future rice varieties (Bouis and Saltzman 2017). Urgently required in this pursuit is the identification and molecular characterization of novel high-Zn rice germplasms that are genetically close to elite breeding lines, facilitating their efficient integration into genomics-assisted Zn mainstream breeding (Calayugan et al. 2021).
The grain Zn trait in rice has been extensively characterized phenotypically and molecularly (Babu et al. 2020; Calayugan et al. 2020; Descalsota et al. 2018, 2019a; Zaw et al. 2019), revealing over 200 QTLs and 80 genes associated with grain Zn content (De Leon et al. 2016; Furuta et al. 2017; Singhal et al. 2021; Swamy et al. 2016; Yang et al. 2018). Meta-analyses have further refined this knowledge, identifying 22 to 57 Meta QTLs (MQTLs) enriched with metal homeostasis genes crucial for Zn uptake, transport, partition, and loading into rice grains (Jin et al. 2015; Raza et al. 2019;Joshi et al. 2023; Sasaki et al. 2014, 2015; Satoh-Nagasawa et al. 2012; Takahashi et al. 2012a; Tan et al. 2019). The complexity of plant nutrition mechanisms, influenced strongly by environmental factors, is evident in the differential expression, co-expression, and transgenic validation of major metal homeostasis genes such as OsDMAS, OsHMA, OsMTP, OsNAS, OsNAAT, OsSAMS, OsTOM, and OsZIP (Johnson et al. 2011; Malav et al. 2016; Mu et al. 2021; Sasaki et al. 2015; Satoh-Nagasawa et al. 2012; Takahashi et al. 2012b; Tan et al. 2019; Yamaji et al. 2013; Descalsota et al. 2019a, b; Zaw et al. 2019).
The “aus” accessions are a rich source of grain micronutrients, especially for Zn content in the milled rice, and they are genetically closer to popular indica rice varieties so that they can be readily used in rice Zn biofortification (Descalsota et al. 2018; Rakotondramanana et al. 2022; Swamy et al. 2016). Some of the stable high Zn aus accessions are Kaliboro (IRGC77201-1), Jamir (IRGC117765), Lalsaita (IRGC43915-1), UCP122 (IRGC8794-1), DZ193, and Khao ToT Long 227. In addition to their acceptable yield potential, these accessions have two to three folds higher grain Zn content (35–40 ppm) compared to the popular high yielding rice varieties (12–16 ppm). Our team at International Rice Research Institute (IRRI) and our research collaborators are using these accessions for Zn biofortification breeding. Previous mapping studies using aus-derived populations have identified major effect QTLs such as Zn5.1, Zn6.1, Zn6.2, Zn7.1, and Zn12.1 with substantial R^2^ values (> 10%) and additive effect (> 1 ppm) (Descalsota et al. 2019a,b; Zaw et al. 2019), emphasizing their potential to enhance grain Zn content through genomics-assisted breeding (Neeraja et al. 2017; Swamy et al. 2016; Wani et al. 2022).
In support of mainstream Zn breeding, our study aims to characterize four recombinant inbred lines (RILs) populations for agronomic, yield, and grain Zn content traits; to map quantitative trait loci (QTLs) and assess the pyramiding effects of yield and Zn QTLs; to prioritize candidate genes for novel QTLs; to conduct genomic prediction for grain Zn and yield; and to identify promising RILs with high grain Zn content and acceptable yield potential.
Materials and methods
Plant materials
Four RILs mapping populations were developed and characterized in this study. Two popular irrigated rice varieties of the Philippines such as PSBRc82 and NSICRc222 were crossed with high Zn aus accession UCP122 (IRGC8794-1), while two submergence tolerant rice varieties viz; Samba Mahsuri Sub-1 and Ciherang Sub-1 were crossed with another aus accession Lalsaita (IRGC43915-1). We followed all the procedures and methods as per the established regulations and guidelines.
Phenotyping
Four populations viz; PSBRc82/UCP122 (P1), NSICRc222/UCP122 (P2), Samba Mahsuri Sub-1/Lalsaita (P3) and Ciherang Sub-1/Lalsaita (P4) along with checks were field evaluated during the wet season of 2019 (2019WS) and dry season of 2020 (2020DS). Experiments were conducted at Zeigler Experimental Station (ZES) of IRRI. Twenty-one days old seedlings were transplanted with a spacing of 20 cm × 20 cm following a Randomized Complete Block Design (RCBD) with two replications. Data were recorded on days to flowering (DF), plant height (PH), tiller number (TN), panicle number (PN), panicle length (PL), grain yield (YLD), and grain Zn content (Zn) following the standard evaluation system (IRRI 2013). For yield measurement, grains were threshed per plot and dried to 14% moisture content and yield was recorded in grams (g) and converted to tons/ha. Thirty grams of paddy was dehulled using Satake dehuller and milled for 60 s using mini-lab rice polisher from green agritech. At least 3 g of representative polished rice grains from each plot was analyzed for Zn content using X-ray Fluorescence Spectrometry (XRF) (Guild et al. 2017). Each sample was measured twice to estimate grain Zn content and expressed in parts per million (ppm). The replicated data was used for statistical analysis.
Molecular analysis
DNA isolation and quantification
Leaf samples of all the RILs were collected from one month old seedlings for all the genotypes from a single replication. Genomic DNA was isolated following the Cetyl-Trimethyl Ammonium Bromide (CTAB) method (Murray and Thompson 1980). The lyophilized leaf samples were ground into powder using liquid Nitrogen and GenoGrinder (SPEX sample prep 2000). Pre-warmed 800 µl CTAB buffer was added to each of the samples and incubated at 65 °C for 1 h, added 800 µl of chloroform iso-amyl alcohol (1:1) and mixed very well by shaking followed by centrifugation for 15 min at 12,000 revolutions per minute (rpm). The supernatant was carefully transferred to a new tube and an equal volume of chilled isopropyl alcohol was added and incubated for 30 min at 4 °C. Next, the DNA was centrifuged at 10,000 rpm for 10 min and the pellet was washed with 70% alcohol and air dried. Finally, the DNA pellet was dissolved in 200 µl of TE buffer (10 mM Tris–HCl [pH 8.0], 1 mM EDTA, RNase A [10 mg/ml]). The quality and quantity of the isolated genomic DNA was estimated through 1% agarose gel electrophoresis (AGE), and the final concentration of the DNA samples were adjusted to 25–50 ng/µl. The 7 K SNP genotyping was carried out at Genotyping Sequence Laboratory, IRRI (Morales et al. 2020).
Statistical analysis
Analyses of statistical paremeters and ANOVA
The basic statistical parameters and analysis of variance (ANOVA) were estimated using STAR v.2.0.1 and PB Tools v.1.4 (IRRI 2014). Best linear unbiased estimates (BLUEs) were generated by setting genotype effects as fixed and season effects as random. The BLUEs were used for further analyses. Pearson’s correlation coefficient and Principal Component Analysis (PCA) were performed using R-Program (R core Software 2012).
The model used for ANOVA:
\documentclass[12pt]{minimal} \usepackage{amsmath} \usepackage{wasysym} \usepackage{amsfonts} \usepackage{amssymb} \usepackage{amsbsy} \usepackage{mathrsfs} \usepackage{upgreek} \setlength{\oddsidemargin}{-69pt} \begin{document}$${Y}_{ijk}= \mu + {\alpha }_{i}+{r}_{j}+{b}_{kj}+ {\varepsilon }_{ijk}$$\end{document}where* μ* is the overall mean, αi is the effect of the ith genotype; rj is the effect of the jth replicate, bkj the effect of the kth block within the jth replicate and εijk the error.
Broad-sense heritability (h^2^) was estimated by using the formula:
\documentclass[12pt]{minimal} \usepackage{amsmath} \usepackage{wasysym} \usepackage{amsfonts} \usepackage{amssymb} \usepackage{amsbsy} \usepackage{mathrsfs} \usepackage{upgreek} \setlength{\oddsidemargin}{-69pt} \begin{document}$${h}^{2}=\frac{{\sigma }_{g}^{2}}{{\sigma }_{p}^{2}} and {\sigma }_{p}^{2}= {\sigma }_{g}^{2}+\frac{{\sigma }_{e}^{2}}{r}$$\end{document}where \documentclass[12pt]{minimal} \usepackage{amsmath} \usepackage{wasysym} \usepackage{amsfonts} \usepackage{amssymb} \usepackage{amsbsy} \usepackage{mathrsfs} \usepackage{upgreek} \setlength{\oddsidemargin}{-69pt} \begin{document}$${\sigma }_{p}^{2}$$\end{document} is the phenotypic variance, \documentclass[12pt]{minimal} \usepackage{amsmath} \usepackage{wasysym} \usepackage{amsfonts} \usepackage{amssymb} \usepackage{amsbsy} \usepackage{mathrsfs} \usepackage{upgreek} \setlength{\oddsidemargin}{-69pt} \begin{document}$${\sigma }_{g}^{2}$$\end{document} is the genotypic variance, \documentclass[12pt]{minimal} \usepackage{amsmath} \usepackage{wasysym} \usepackage{amsfonts} \usepackage{amssymb} \usepackage{amsbsy} \usepackage{mathrsfs} \usepackage{upgreek} \setlength{\oddsidemargin}{-69pt} \begin{document}$${\sigma }_{e}^{2}$$\end{document} is the error variance and r is the number of replications in the season.
QTL analysis by inclusive composite interval mapping
High quality SNPs were retrieved after filtering out for no calls, monomorphic and heterozygous based on parental genotypic information from the 7 K SNP genotyping. In all 848, 211, 398, and 784 SNPs in P1-P4 respectively were used for further analyses. We constructed the linkage map following the Kosambi function and using IciMapping (IciM) v4.2 (Kosambi 1944; Meng et al. 2015). The BLUEs and SNPs data were used in composite interval QTL mapping. The permutation method obtained an empirical threshold for claiming QTLs based on maximum likelihood with 1000 permutations at P = 0.05 (Li et al. 2007). The epistasis between QTLs were detected using the maximum likelihood permutation method with 1000 permutation at P = 0.05 (Li et al. 2008).
Association mapping
The 7 K SNPs data was curated by removing missing data, minor alleles and heterozygous loci using Tassel v.5.0 (Bradbury et al. 2007). In all 2005 SNPs across the populations were retrieved and used for GWAS analysis. GWAS was performed using the Compressed Mixed Linear Model (CMLM) in GAPIT v3 (Zhang et al. 2010). Manhattan plots were obtained by setting a threshold value for declaring marker-trait association at –log (p-value) ≥ 2.6. The QQ plots for each trait were carefully examined to determine the population stratification and whether the model could control false positives, which, in turn, indicated the suitability of the model for analysis (Kaler et al. 2020).
Estimation of QTL effects
The genotypes were classified based on the number of mapped QTLs for grain Zn and YLD. Each QTL group's average grain Zn and YLD were calculated. Tukeys’s Honest Significant Difference (HSD) analysis was applied to differentiate the QTL classes.
Candidate gene analysis
In-silico post QTL analysis was performed based on web based available information by using RAP-DB (https://rapdb.dna.affrc.go.jp/) (accessed on 15 April 2022), MSU Rice genome annotation project (http://rice.uga.edu/) and RiceXpro (https://ricexpro.dna.affrc.go.jp/) (accessed on 19 June 2022) to predict responsible candidate genes within the novel QTL interval region. All the candidate genes observed between the two flanking markers of the novel QTL were downloaded and characterized based on expressed proteins and their functions. In addition, in-silico candidate gene expression analysis was also performed through RiceXpro (https://ricexpro.dna.affrc.go.jp/) to explore the information regarding predicted candidate gene expression in different plant parts at different stages and their association with grain Zn. In-silico co-expression analyses was carried out for selected genes using online resource (https://ricefrend.dna.affrc.go.jp/).
Genomic prediction ability
Genomic prediction was estimated through single-trait (YLD/Zn individually) and multi-trait (YLD and Zn combined) strategies for all populations (Lyra et al. 2017). For that, we ran the linear mixed models via ASReml-R (Analysis Software for Residual Maximum Likelihood following a CV-alpha) cross-validation system with four replicates and 5-folds (Yassue et al. 2021). As the response variable, we used deregressed BLUPs (dBLUPS) for each trait. Moreover, the genotype effect was considered random, and season as fixed in the GS (Genomic Selection) model. Finally, for each replicate and fold, we estimated prediction ability (Pearson correlation between the predicted and observed value) and heritability (broad sense) through the Cullis method (Cullis et al. 2006; Piepho and Möhring 2007).
Results
Phenotypic analysis of the four RILs populations
The range, mean, variance, coefficient of variation (CV) and heritability for agronomic traits, grain yield and grain Zn content are provided in Table 1. Days to flowering (DF) ranged from 71–109 days and 60–110 days irrespective of the populations in season 1 (S1) and season 2 (S2), respectively. While the highest values for plant height (PH) (192 cm) and panicle length (PL) (38 cm) were recorded in P1 and P2, respectively. Similarly, the highest values for panicle number (PN) (32) and yield (YLD) (8.9 t/ha) were observed in P3, while tiller number (TN) (27) and grain Zinc content (Zn) (38.1 ppm) were highest in P4. Across the seasons and populations, yield and Zn ranged from 1.5–8.9 t/ha and 10.0–38.1 ppm respectively, whereas in the parents, YLD and Zn ranged from 1.5–5.4 t/ha and 10.2–34.4 ppm, respectively (Table 1). The CV was low (⪅ 10%) for DF and PL, high CV was observed for YLD (> 20%) and rest of the traits had a moderate CV (⪅ 20). Genotypic effects were significant for all the traits and in both seasons. Moderate to high heritability (0.40–0.89) was observed for all traits except TN.Table 1. Performance and heritability of agronomic traits, yield and grain Zn content in RILs over two seasons and across populationsTraitPopRP (Mean)DP (Mean)RangeMean ± SEVarianceCV(%)F-ValueH^2^Combined analysisS1S2S1S2S1S2S1S2S1S2S1S2Geno effectSeasonal effectG × E effectDFP1997771–10671–11086.2 ± 0.2786.1 ± 0.2843.6241.997.667.537.085.540.850.8115.520.00ns0.00nsP2987771–10973–10087.3 ± 0.2886.1 ± 0.2737.2931.837.006.555.243.580.790.712.390.12ns69.58P3867371–10564–9185.2 ± 0.2781.5 ± 0.1539.3312.237.354.295.843.810.820.701.584.84174.69P4797571–10460–9385.6 ± 0.2981.3 ± 0.2339.7124.177.366.055.574.530.820.762.794.7174.28PHP110212883–19088–192136.9 ± 0.85138.1 ± 0.96413.5512.8714.8516.45.594.390.830.7711.030.15ns0.00nsP299127101–18189–187144.1 ± 0.85143.8 ± 0.95322.07406.1512.4414.0110.544.710.870.78657.980.00ns0.00nsP310812988–18389–183138.1 ± 0.75138.2 ± 0.75309.99308.9112.7512.727.444.530.860.771.350.00ns0.00nsP411712787–17572–191133.4 ± 0.85133.6 ± 0.89332.79371.6313.6714.438.125.800.880.8219.610.00ns0.00nsTNP115188–217–2213.3 ± 0.1012.4 ± 0.135.665.2917.8918.221.501.170.430.342.854.090.00nsP214168–237–2113.1 ± 0.1713.1 ± 0.1213.566.7228.0919.921.021.140.480.342.093.450.00nsP314137–248–2412.7 ± 0.1012.2 ± 0.125.426.6818.3810.071.371.510.470.344.360.00ns0.00nsP415157–217–2712.4 ± 0.1112.6 ± 0.135.577.6618.9421.921.271.110.510.410.92ns0.00ns0.04nsPNP112136–226–2312.4 ± 0.1014.8 ± 0.086.193.6820.0512.921.171.650.550.4311.650.00ns0.00nsP212136–207–2612.1 ± 0.1113.3 ± 0.105.916.0320.0118.191.301.45**0.450.397.893.000.46nsP312126–327–2112.0 ± 0.1112.6 ± 0.106.595.2921.4618.221.311.230.440.435.320.02ns0.00nsP413125–206–2311.7 ± 0.1112.6 ± = 0.115.922.1820.8412.421.061.170.470.484.570.19ns0.09nsPLP124.023.120–3416–3626.6 ± 0.1127.1 ± 0.157.2912.0210.1712.812.701.990.630.504.583.750.00nsP223.923.720–3719–3827.4 ± 0.1327.3 ± 0.148.168.8110.4210.862.292.250.550.556.710.00ns0.00nsP322.821.119–3319–3425.8 ± 0.1025.8 ± 0.105.715.779.279.302.422.680.570.627.680.00ns0.00nsP422.721.818–3317–3225.6 ± 0.1225.6 ± 0.136.687.2910.0710.532.001.860.480.455.620.00ns0.00nsYLDP13.83.11.5–7.11.6–8.24.1 ± 0.054.1 ± 0.051.61.2531.5527.292.493.190.600.681.130.00ns79.98P25.43.11.9–8.41.7–8.44.4 ± 0.064.4 ± 0.051.681.329.2725.821.273.730.620.731.450.00ns16.89P34.31.51.5–8.91.7–8.24.2 ± 0.064.7 ± 0.061.721.7831.6728.131.942.800.460.631.41**1.7337.23P43.21.91.5–8.11.8–8.34.0 ± 0.064.9 ± 0.061.511.4630.4824.492.011.540.480.421.354.0611.17ZnP110.834.410.8–35.810.3–35.322.5 ± 0.1721.5 ± 0.1516.8812.1418.2616.244.543.380.770.685.790.16ns0.00nsP210.231.710.2–35.010.5–31.721.0 ± 0.1920.5 ± 0.1516.1811.1719.1816.324.114.310.740.765.950.21ns0.11nsP311.127.610.0–33.710.5–35.221.7 ± 0.1622.4 ± 0.1514.7713.217.716.213.589.450.720.895.290.52ns0.07nsP410.829.610.6–38.110.3–30.920.7 ± 0.1520.8 ± 0.1410.639.515.7514.833.033.950.610.734.29**0.00ns0.01nsPop-population; 2019WS, S2-2021DS, SE, standard error; CV, coefficient of variation; H^2^, heritability; Geno effect, genotypic effect; G × E effect, genotype by seasonal effect; DF, days to flowering (days); PH, plant height (cm); TN, tiller number; PN, panicle number; PL, panicle length (cm); YLD, yield (ton/ha); Zn, zinc (ppm); RP, recipient parents; DP, donor parents; ***Significant at P < 0.0001; **Significant at P < 0.01; *Significant at P < 0.05; ns, non-significant (color figure online)
Out of 84 possible pairwise correlations, 47 were significant, 22 of them had positive and 25 had negative correlations (Fig. 1). Positive correlations were observed between PH and PL in all the populations. In contrast, YLD showed a consistent negative association with Zn. We observed significant positive (PN–TN, PL–PH, PL–YLD, PH–YLD) and negative (TN–PH, PN–PH, PL–TN, PL–PN, PL–Zn, YLD–Zn) correlations among the traits.Fig. 1. Correlations among agronomic traits, yield, and grain Zn in four RIL populations. Corrleation for each population was estimated using R-Program. Postitive correlations are indicated by red color, while negative correlations are indicated by blue color. Darker colors correspond to stronger correlation coefficients. A–D indicates correlations for four populations P1–P4; DF, days to flowering (days); PH, plant height (cm); TN, tiller number; PN, panicle number; PL, panicle length (cm); YLD, yield (ton/ha); Zn, zinc (ppm). *p < 0.05, **p < 0.01, ***p < 0.001 (color figure online)
Results of PC analysis are presented in Table S1 and Fig. 2. The first two principal components (PC1 and PC2) had eigen value > 1, and together they explained > 46.1% of the total variation in each population. Among the traits, TN (0.67), Zn (0.55) and PL (0.71, 0.66) had the highest positive contributions to the PC1, whereas PH (− 0.75), PL (− 0.59) and PN (− 0.63, − 0.72) had negative contributions in P1–P4, respectively. Similarly, the major positive contribution for PC2 came from TN (0.65), Zn (0.47,0.56) and TN (0.64), while the negative contributions from Zn (− 0.57), TN (− 0.67, − 0.68) and Zn (− 0.38) in P1-P4, respectively.Fig. 2. Principal component analysis of all four RIL populations using the two PCs with the highest proportion of variance. PCA for each population was estimated using R-Program. A-D indicates PCA for four populations P1–P4; The variable factor map is obtained from the PCA on agronomic traits, yield and Zn. A small angle between variables implies positive correlation, a large one suggests negative correlation, and a 90-degree angle indicates no correlation between two traits. Dim1 corresponds to PC1, and Dim2 corresponds to PC2; variables with a high contribution to the dataset variance are in red/orange whereas variable with low contribution are in blue. DF, days to flowering (days); PH, plant height (cm); TN, tiller number; PN, panicle number; PL, panicle length (cm); YLD, yield (ton/ha); Zn, zinc (ppm) (color figure online)
Linkage map construction
A thorough filtering of 7098 SNPs was conducted for each of the populations. All the monomorphic and minor allelic SNPs, and those with > 20% missing genotypes and showing segregation distortion (P = 0.05) were excluded from the analyses. It resulted in a final set of 848, 211, 398, and 784 SNPs in P1-P4 respectively. The SNPs were widely distributed on all the chromosomes (Chr) with highest number of SNPs on Chr2 and Chr4 in P1 followed by Chr1 in P4. The SNPs density varied on different chromosomes and populations with an interval of 3–14 cM between the SNPs. The constructed linkage map lengths were 1632, 1535, 1701 and 1684 cMs in P1–P4, respectively (Table S2).
ICIM QTL analysis
Inclusive composite interval mapping (ICIM) detected 56 QTLs for six agronomic traits and grain Zn content in S1 and S2 from P1–P4 (Table 2). The highest number of QTLs were mapped in P4 (24), followed by P1 (22), P2 (12) and P3 (9). Similarly, highest number of QTLs were found on chr1 (10) followed by chr7 (9), chr9 (4) and chr11 (4). A maximum of 14 QTLs were mapped for DF, followed by YLD (10), PL (6), PH (5), TN (4) and PN (4). The phenotypic variance explained (PVE) by these QTLs varied from 4.5% (qPN4.1) to 31.7% (qPH1.1) with LOD (Log_10_ of the likelihood odds ratio) values ranging from 3 to 32. The qDF7.1, qDF7.4, qDF8.1, qPH1.1, qYLD9.2,* qZn_5.1, qZn5.2, and qZn7.1_ each explained > 10% PV. The qDF_7.2, qDF7.4, qDF8.1, qPH1.1, qPL1.2, qYLD1.2, qYLD5.1_ qZn_3.1_ and qZn_6.2_ were identified in at least two populations. Most of the QTLs were identified in individual environments, whereas qDF_1.1, qDF7.2, qDF8.1, qPH1.1, qPH7.1, qPL1.2, qPL9.1,_ qZn_5.1, qZn5.2, qZn6.1_ and qZn_7.1_ were identified in one or more populations and both the seasons. The qZn_7.1_ had the highest PVE (17.8%) and LOD (32) with an additive effect of > 2.3 ppm.Table 2. List of QTLs identified for agronomic traits, yield and grain Zn content in RILsQTLsMarker Position(Mb)Marker IntervalLODPVE (%)AddAlleleSeasonPopqDF_1.1_0.2–6.0S1_194844-S1_59827724 & 65.0 & 6.6-2 &-2.3BS1 & S2P2qDF_1.2_38.7–39.0S1_38652270-S1_3902164169.81AS2P3qDF_3.1_3.5–17.9S3_3484027-S3_1788454044.61.8AS2P2qDF_3.2_31.3–32.2S3_31348032-S3_3218640146.41.1AS2P4qDF_6.1_3.7–4.6S6_3721346-S6_4577289581.5AS1P3qDF_6.2_7.2–7.5S6_7191499-S6_751050235.11AS2P4qDF_7.1_4.4–5.1S7_4434376-S7_5071488811.72.3AS2P1qDF_7.2_5.5–6.7S7_5526898-S7_6656052-3 & 84.9 & 9.01.0 & 2.1AS2 & S1P4 & P1qDF_7.3_17.0–17.2S7_16961482-S7_1718632979.82AS1P4qDF_7.4_28–28.8S7_27962775-S7_288351064 & 65.3 & 10.31.8 & 1 .8AS1P1 & P3qDF_8.1_21.1–21.3S8_21053247-S8_213379983 to 46.4 to 12.21.6 to 2.3AS1 & S2P2 &P4qDF_9.1_8.8–19.7S9_8774450-S9_1965038258-2.2BS1P2qDF_11.1_3.8–22.9S11_3802930-S11_2288116147.5-1.8BS1P2qDF_11.2_23.0–23.6S11_23023708-S11_2355409035.2-5.3BS1P1qPH_1.1_19.3–38.3S1_19308987-S1_382589299 to 199.2 to 31.7-5.3 to -10.8BS1 & S2P1, P2, P3 & P4qPH_3.1_20.2–23.4S3_20180537-S3_23354868-565.6AS2P1qPH_5.1_25.5–26.2S5_25493135-S5_2615831645.3-4.3BS2P4qPH_7.1_5.1–6.7S7_5526898-S7_6656052-3 & 44.6 & 5.63.7 & 4.5AS2 & S1P4qPH_8.1_1.5–2.9S8_1513174-S8_2944055-35-4.1BS2P4qTN_1.1_5.4–6.7S1_5408523-S1_668379845.5-0.6BS1P1qTN_1.2_35.8–36.2S1_35825579-S1_3620511055.90.5AS1P1qTN_2.1_18.9–21.5S2_18861653-S2_2146040045.3-0.4BS1P4qTN_11.1_18.2–18.5S11_18229870-S11_1848329846.5-0.5BS1P4qPN_2.1_18.9–21.5S2_18861653-S2_2146040058.1-0.5BS1P4qPN_4.1_22.2–22.7S4_22179473-S4_2274318334.5-0.3BS2P1qPN_5.1_27.7–28.7S5_27683752-S5_2867817435.40.3AS2P1qPN_11.1_20.1–20.7S11_20074439-S11_2071189235.3-1.3BS2P3qPL_1.1_22.0–28.5S1_22030659-S1_2847866069.70.9AS2P1qPL_1.2_36.7–38.2S1_36734765-S1_38224245-3 to 56.0 to 7.0-0.5 to -0.6BS1 & S2P1 & P4qPL_7.1_5.5–6.7S7_5526898-S7_665605236.40.5AS1P4qPL_7.2_23.5–24.3S7_23535052-S7_2431381735.10.5AS2P4qPL_9.1_17.8–17.9S9_17767194-S9_179245773 & 35.4 & 5.5-0.4 & -0.4BS1 & S2P3qPL_12.1_1.8–4.0S12_1753550-S12_404655034.70.8AS2P4qYLD_1.1_8.6–14.7S1_8585951-S1_1473639459.3-0.1BS2P1qYLD_1.2_36.7–38.2S1_36734765-S1_382242453 & 45.8 & 5.9-0.03 & -0.04BS1P2 & P1qYLD_1.3_42.0–42.4S1_41997238-S1_4240824368.9-0.09AS1P1qYLD_5.1_0.9–19.4S5_922530-S5_193520103 & 55.1 & 7.00.03 & 0.05AS2P4 & P3qYLD_7.1_5.1–5.5S7_5071488-S7_552689846.70.02AS1P4qYLD_7.2_14.7–17.7S7_14677901-S7_1765430545.90.04AS1P1qYLD_8.1_26.8–27.5S8_26799315-S8_2751781234.70.02AS1P1qYLD_9.1_12.3–13.6S9_12326525-S9_1355573255.9-0.03BS2P1qYLD_9.2_19.2–19.7S9_19208050-S9_19667346-812.9-0.09BS1P3qYLD_10.1_19.1–20.4S10_19067281-S10_2039930135.4-0.03BS2P2qZn_3.1_3.3–18.9S3_3313047-S3_189298853 & 34.7 & 6.7-0.7 & -1.1BS1P2 & P4qZn_3.2_12.1–12.7S3_12070220-S3_1269407335.2-0.6BS2P4qZn_3.3_13.5–13.9S3_13456686-S3_1393238736.6-0.9BS2P4qZn_4.1_22.2–22.8S4_22179473-S4_22796747-56.6-0.8BS2P1qZn_4.2_29.1–30.4S4_29067212-S4_3039376946.8-0.7BS1P4qZn_4.3_33.4–33.9S4_33417482-S4_3390818247.7-0.7BS2P4qZn_5.1_1.5–11.9S5_1454837-S5_118974813 to 86.7 to 14.4-0.9 to -1.5BS1 & S2P2qZn_5.2_3.8–4.1S5_3775755-S5_41241807 & 411.9 & 5.9-1.2 & -0.7BS1 & S2P1qZn_5.3_24.3–25.5S5_24298176-S5_2549313547.2-0.7BS2P4qZn_6.1_19.2–20.6S6_19163386-S6_206374514 & 46.0 & 5.4-0.8 & -0.7BS1 & S2P1qZn_6.2_29.4–29.4S6_29416997-S6_294483255 & 46.3 & 5.8-0.8 & -0.7BS2P2 & P1qZn_6.3_30.5–30.5S6_30493399-S6_3051973334.8-0.7BS1P2qZn_7.1*_28–28.8S7_27962775-S7_288351066 & 3216.4 &17.8-2.3 & -2.5BS2 & S1P3LOD, logarithm of the odds; PVE, phenotypic variance explained; Add-Additive effects; A, recipient parent allele, B, donor parent allele; Pop, population
There were five chromosomal regions with two or more QTLs co-located (Fig. 3, Table 2). For example, the qDF7.2, qPH7.1 and qPL7.1 were co-located on chr 7 at 6.65 Mb, qPL1.2 and qYLD1.2 were co-located on chr1 at 38.22 Mb, qTN2.1 and qPN2.1 on chr2 at 21.50 Mb, qDF7.4 and qZn7.1 on chr7 at 27.96 Mb, whereas qDF9.1 and qYLD9.2 were co-located on chr9 at 19.65 Mb. All the QTL co-locations were observed for agronomic traits except the co-localization of qDF7.4 and qZn7.1.Fig. 3. Distribution of QTLs mapped for agronomic traits, yield, and grain Zn content on all 12 chromosomes in all four populations. SNP markers were mapped to the chromosome to represent the QTLs’ physical locations (Mb). The physical position of each SNP marker was shown on the left side, with the corresponding agronomic traits, yield, and Zn displayed on the right side. QTLs of different types of traits were distinguished by different colors: blue for DF (Days to flowering), green for PH (Plant height in cm), red for TN (Tiller number), yellow for PN (Panicle number), black for PL (Panicle length in cm), pink for YLD (Yield in ton/ha), and purple for Zn (Zinc in ppm) (color figure online)
Epistasis
We identified 16 epistatic interactions that were either population or season specific and explained 4.5% to 11.4% of PV with a LOD > 3 (Table 3). The highest number of epistatic loci was identified for DF (5) and Zn (5) followed by YLD (3). Among five epistatic interactions of DF, four had positive additive × additive effects between loci and explained 4.9 to 11.3% PV. Single positive epistatic interactions were observed for PN on chr4/chr10 (PVE, 7%), PL chr5/chr6 (PVE, 5.8%) and YLD chr1/chr2 (PVE, 10%). Among the five interactions four were positive for grain Zn, out of which one was observed on chr1/chr2 during S1 with a high PVE of 10.5%, and also negative interaction was observed between chr1/chr2 with PVE of 11.4% during S2.Table 3. Epistatic interactions identified for different traits in four mapping populationsTraitChrPosition (Mb)Marker IntervalChrPosition (Mb)Marker IntervalLODPVE (%)Add1Add2Add by AddPopSeasonDF123.4–24.1S1_23361499-S1_241157001110.2–11.5S11_11484685-S11_10190951510.9− 0.30.71.8P1S1DF112.7–14.0S1_12733173-S1_13988902124.4–25.2S1_24350239-S1_2524800454.900.11.7P3S1DF421.9–23.9S4_23875094-S4_21864875110.3–2.4S11_2379158-S11_25668856.8− 1.6− 1.1− 3.4P1S2DF52.8–21.8S5_2770834-S5_2178072660.4–0.6S6_646915-S6_400753511.30.90.33.2P4S2DF56.6–9.2S5_9214505-S5_660767562.0–26.1S6_2010737-S6_2609582966.6− 1.8− 1.52.7P1S2PN416.5–30.1S4_30132071-S4_1645634463.7–8.6S6_3721346-S6_859994956.6− 1.21.7− 1.5P4S2PN416.5–30.1S4_30132071-S4_164563441019.7–20.3S10_20272810-S10_1967826867− 0.8− 1.51.5P4S2PL514.8–15.9S5_14821944-S5_1588050761.8–1.9S6_1867779-S6_192840335.81.11.32P2S2YLD15.4–35.1S1_35123303-S1_5354306225.1–29.9S2_25103047-S2_299343115100− 0.10.3P2S2YLD419.1–33.9S4_19123643-S4_339081821014.5–14.6S10_14559932-S10_1464045844.700.09− 0.2P2S2YLD1019.0–19.1S10 19,020,984-S10 19,025,5531225.5–26.3S12_26324348-S12_2549165037.7− 0.70.2− 0.3P2S2Zn17.2–8.2S1_8174333-S1_7180380217.0–19.2S2_19169013-S2_17022093511.4− 0.20.2− 0.9P4S2Zn141.1–42.4S1_41089199-S1_4240824328.9–30.2S2_8935514-S2_30345735510.50.71.21.4P1S1Zn52.9–6.5S5_6506422-S5_28892621014.1–19.1S10_19057844-S10_1408690254.50.3− 0.31.3P1S1Zn512.5–20.2S5_20151626-S5_1245855990.8–12.6S9_12599992-S9_82289268− 1.2− 0.91.7P1S2Zn1016.6–19.0S10_19025553-S10_166451721122.1–28.0S11_22071896-S11_2799232634.60.60.41.2P2S2Chr, chromosome; LOD, logarithm of the odds; Add-additive effects; Add by Add, additive by additive effects; Pop, population
Association mapping
We conducted association analysis for YLD and Zn using combined data of all the four populations. In all, 2005 SNPs across the populations were used for the association analysis. A LOD threshold of 3.0 was used to declare significant marker trait associations (MTAs). Signicant MTAs were identified for grain Zn content at nine geomic regions on chromosomes 3, 5, 6, 7, 9 and 11, while MTAs for YLD were significant at seven places on chromosomes 1, 6, 7, 9 and 11 (Table 4; Figs. 4, 5). All the SNPs linked to grain Zn content had a major effect with a PVE > 18%. In contrast, all the SNPs associated with YLD had a minor effect with a PVE < 10%. The qZn5.1, qZn5.2, qZn5.3,* qZn_6.2,_ qZn_7.1_ and qYLD_1.2_ were consistently identified by both ICIM and association analyses.Table 4QTL/SNP associated with Zn content and YLD in four mapping populationsTraitSNPChrPosition (Mb)LODPVE (%)SeasonQTLs (ICIM)ZnS3_48481230.48317.8S2S5_1196400 -S5_458978351.19 to 4.593 to 520.1 to 24.1S1 & S2qZn_5.1_, qZn_5.2_S5_25493135525.49422.3S2qZn_5.3_S6_134413261.34318.5S2S6_29417000 -S6_29448325629.41 to 29.443 to 620.3 to 25.2S1 & S2qZn_6.2_S7_28851245- S7_29617554728.85 to 29.613 to 422.8S1 & S2qZn_7.1_S9_19208050919.21319.4S2S11_2514115112.513 to 419.3 to 22.3S1 & S2S11_27591935—S11_2873951127.59 to 28.75321.9 to 22.1S1YLDS1_36734765—S1_37416454136.73 to 37.414 to 56.9 to 7.3S1qYLD_1.2*_S1_39799820—S1_41890713139.79 to 41.893 to 56.1 to 6.7S1S6_475794864.7536.1S1S6_40075360.41311.5S2S7_385314173.86411.8S2S9_20587039—S9_21622536920.59 to 21.623 to 46.4 to 9.6S1 & S2S11_933288110.93310.0S2Chr, chromosome; LOD, logarithm of the odds; PVE, phenotypic variance explainedFig. 4Genome-wide association analysis of grain Zn using Compressed Mixed Linear Model (CMLM) in GAPIT v3. Manhattan plots on the right display associated significant SNP markers for grain Zn detected during the 2019 wet season (A) and the 2020 dry season (B), with quantile–quantile plots for each season on the left. The X-axis represents chromosome numbers, and Y-axis represents − log 10 (p). The horizontal red line indicates the threshold p-value at significant level (p < 0.0001) (color figure online)Fig. 5. Genome-wide association analysis of YLD using Compressed Mixed Linear Model (CMLM) in GAPIT v3. Manhattan plots on the right display associated significant SNP markers for YLD detected during the 2019 wet season (A) and the 2020 dry season (B), with quantile–quantile plots for each season on the left. The X-axis represents chromosome numbers, and Y-axis represents − log 10 (p). The horizontal red line indicates the threshold p-value at significant level (p < 0.0001) (color figure online)
In-silico candidate gene and co-expression analysis
We conducted in-silico candidate gene analysis of qZn6.2. There were 11 genes within 50 kb vicinity of consistent peak SNP (S6_29448325) such as CLKC kinase, macrophage migration inhibitory factor, ANTH/ENTH domain containing protein, CCT motif containing protein, 4-amino-4-deoxy chorismate synthase, proteasome/cyclosome repeat containing protein, *OsSub52-*putative subtilisin homologue, dDefensin-like DEFL family, expressed protein, DNA biniding protein, transposon protein and cadmium/zinc-transporting ATPase 4.
Twenty genes were co-expressed with OsHMA2 (Fig. 6). Among them OsKAT1, OsAmy1A, Lsi3/SIET2 and OsMATE2 are well characterized, while the remaining are conserved hypothetical proteins, unknown proteins, eggshell protein family, aquaporin protein, transcriptional factor B3 domain containing protein, pentatricopeptide repeat domain containing protein and indole-3-acetate beta-glucosyltransferase. The OsKAT1 codes for shaker potassium channel protein responsible for salinity stress tolerance and ion homeostasis*, OsAmy1A* codes for α-amylase glycoprotein that is responsible for the degradation of starch granule, Lsi3/SIET2 codes for Silicon efflux transporter (SIET/Lsi2-like) homolog which assists in efflux intravascular transport of silicon and OsMATE2 codes for multidrug and toxic compound extrusion (MATE) protein family transporter responsible for the arsenic stress response, regulation of plant growth and development, and disease resistance.Fig. 6. HyperTree depicting co-network analysis of predicted candidate gene LOCOs06g0700700. The figure shows various coexpressed genes associated with LOCOs06g0700700 in a HyperTree format using RiceFREND. Transcription factor encoding genes are represented as orange square boxes, and the candidate gene LOC_Os06g0700700 is highlighted at the center of the circular HyperTree
QTL classes for Zn and YLD
The pyramiding effects of YLD and Zn QTLs is provided in the Table 5. We observed an increase in grain Zn content and yield with increase in number of grain Zn and YLD QTLs respectively. There were 18 Zn QTL classes in four populations. Single or four Zn QTL classes had 3.32 ppm more Zn content than qZn5.2 class in P1. Two (16.84 ppm) and three QTLs (17.07 ppm) classes had higher Zn content in P2, while there was only one Zn QTL (12.05 ppm) in P3. The lines with qZn5.3 had a mean grain Zn content of 23.67 ppm and performed better than lines with two Zn QTLs, but three QTL classes had mean grain Zn content of > 26.63 ppm. The qZn5.1, qZn5.2 and qZn5.3 are the major contributors to increased grain Zn content either individually or in combination with other Zn QTLs in different populations. The three QTL class (qZn5.1 + qZn6.2 + qZn6.3) had highest grain Zn content of 28.02 ppm and had a highest Zn increment of 17 ppm in P3 in comparison to other QTL classes in different populations. Similarly, there were 17 YLD QTL classes in four populations (Table 5). The qYLD1.2 (4.82 t/ha, 5.33 t/ha), qYLD1.2 + qYLD1.3 (5.27 t/ha), qYLD1.2 + qYLD10.1 (5.61 t/ha) and qYLD1.1 + qYLD1.2 + qYLD1.3 (5.57 t/ha) classes had highest grain yield in their respective groups either in P1 or P2, but qYLD1.2 is the major contributor to yield increase in these two populations. While, qYLD5.1 is the major contributor and had highest effect on yield increase in P3 and P4.Table 5. Effects of QTL classes for grain Zn content and YLDQTL classZn (ppm)/YLD (t/ha)Difference with no QTLPopNone11.06^d^0P1qZn4.118.78^c^7.72qZn5.222.34^ab^11.28qZn6.121.27^ab^10.21qZn4.1 + qZn5.2 + qZn6.1 + qZn6.225.67^a^14.61None10.95^d^0P2qZn5.123.51^ab^12.56qZn6.320.49^bc^9.54qZn6.3 + qZn5.127.79^a^16.84qZn5.1 + qZn6.2 + qZn6.328.02^a^17.07None11.23^b^0P3qZn7.122.48^a^12.05None11.98d0P4qZn3.117.56^cd^5.58qZn3.316.67^cd^4.69qZn4.118.02^c^6.04qZn4.217.23^cd^5.25qZn5.323.67^c^11.69qZn3.3 + qZn3.118.65^c^6.67qZn4.3 + qZn5.323.01^ab^11.03qZn3.2 + qZn3.3 + qZn5.326.63^a^14.65qZn4.1 + qZn4.2 + qZn5.327.13^a^15.15None4.19^e^0P1qYLD1.24.82^d^0.63qYLD7.14.56^ed^0.37qYLD8.14.33^e^0.14qYLD1.1 + qYLD1.24.91^cd^0.72qYLD1.2 + qYLD1.35.27^ab^1.08qYLD1.1 + qYLD7.24.82^d^0.63qYLD1.1 + qYLD1.2 + qYLD7.25.22^ab^1.03qYLD1.1 + qYLD1.2 + qYLD1.35.57^a^1.38qYLD1.1 + qYLD1.2 + qYLD1.3 + qYLD8.15.49^a^1.30None4.73^b^0P2qYLD1.25.33^ab^0.60qYLD10.14.91^b^0.18qYLD1.2 + qYLD10.15.61^a^0.88None4.81^b^0P3qYLD5.15.53^a^0.72qYLD9.25.13^ab^0.32None3.92^b^0P4qYLD5.14.62^a^0.70qYLD7.14.57^a^0.65qYLD5.1 + qYLD_7.1_4.69^a^0.77Pop, population; Different letters indicate significant differences at P < 0.05
Genomic prediction for grain Zn and yield
The genomic prediction results of YLD and grain Zn content are depicted in Figs. 7a, b. The average broad-sense heritability for YLD recorded with 0.54, whereas Zn content was 0.69, across the populations and seasons. The multi-trait model prediction accuracy results for YLD and grain Zn were 0.24 and 0.16, respectively. Interestingly, the single-trait prediction model resulted in an accuracy of 0.44 and 0.49 for YLD and Zn, respectively.Fig. 7. Graphical depiction of prediction accuracy and heritability. Genomic prediction was estimated through single-trait (YLD/Zn individually) and multi-trait (YLD and Zn combined) strategies for all populations. MT, multi-trait; ST, single trait, Linear mixed models were implemented via ASReml-R (Analysis Software for Residual Maximum Likelihood following a CV-alpha) using a cross-validation system with four replicates and 5-folds. Deregressed Best Linear Unbiased Predictors (dBLUPs) were utilized as the response variable for each trait
Identification of lines with high Zn and YLD
Five best lines were selected from each population based on grain Zn content (≥ 24 ppm) and YLD (≥ 5.0 t/ha), across the seasons (Table 6). All the lines possessed different grain Zn QTL combinations, which were mapped in this study; interestingly in P3 all the genotypes possessed single QTL qZn7.1 and in P1 two genotypes had qZn5.2. The selected genotype's grain Zn content and YLD ranged from 22.57 ppm to 29.17 ppm and 4.23 t/ha to 6.38 t/ha, respectively, across the seasons and populations. In P1 grain Zn and YLD ranged from 22.57 to 28.22 ppm and 4.23 to 6.36 t/ha, 23.18 to 28.10 ppm and 4.31 to 6.02 t/ha in P2, 24.22 to 28.5 ppm and 4.31 to 6.38 t/ha in P3, and 23.80 to 29.17 ppm and 4.47 to 6.32 t/ha in P4 were recorded (Table 6). Whereas the grain Zn content and YLD of the recipient parents (RP) ranged from 10.2 to 11.1 ppm and 3.2 to 5.4 t/ha respectively. While donor parents (DP) had 27.6 to 34.4 ppm of grain Zn content and 1.5 to 3.1 t/ha YLD (Table 1). All the selected lines had > 15 ppm of advantage of grain Zn and YLD comparable to RPs. Whereas, the genotypes IR 133350-B-260-1-B, IR 133350-B-453-1-B and IR 133362-B-586-2-B contains high Zn content with > 27 ppm.Table 6. Best genotypes with high Zinc and yield among the populationsPopDesignationZn (ppm)YLD (t/ha)QTLs for ZnS1S2S1S2P1IR133350-B-123-1-B28.1226.325.315.01qZn4.1, qZn5.2, qZn6.1, qZn6.2IR 133350-B-260-1-B27.4227.65.916.15qZn4.1, qZn5.2, qZn6.1, qZn6.2IR133350-B-155-2-B25.0524.875.644.51qZn5.2IR 133350-B-453-1-B27.7328.226.364.23qZn4.1, qZn5.2,* qZn_6.1_, qZn_6.2_IR133350-B-63-225.2522.575.904.87qZn_5.2_P2IR 133353-B-288-2-B24.3525.955.036.02qZn_5.1_, qZn_6.2_IR 133353-B-349-1-B27.0226.15.415.93qZn_5.1_, qZn_6.2_, qZn_6.3_IR 133353-B-316-2-B23.9323.185.904.31qZn_5.1_, qZn_6.2_IR 133353-B-283-1-B28.1025.555.214.6qZn_5.1_, qZn_6.2_, qZn_6.3_IR 133353-B-360-2-B26.4523.355.925.67qZn_5.1_, qZn_6.2_, qZn_6.3_P3IR133359-B-410-2-B24.2225.25.625.11qZn_7.1_IR133359-B-602-1-B24.4725.95.915.61qZn_7.1_IR133359-B-275-1-B28.526.736.294.24qZn_7.1_IR133359-B-282-2-B25.5523.726.384.31qZn_7.1_IR133359-B-337-2-B27.0028.455.254.55qZn_7.1_P4IR 133362-B-586-2-B29.1727.775.645.07qZn_4.3_, qZn_4.2_, qZn_5.3_IR 133362-B-483-1-B28.4724.454.476.32qZn_4.3_, qZn_4.2_, qZn_5.3_IR 133362-B-379-1-B25.8225.634.846.23qZn_3.1_, qZn_3.3_, qZn_5.3_IR 133362-B-630-2-B23.9726.286.235.07qZn_4.3_, qZn_5.3_IR133362-B-298-1-B23.8024.205.045.53qZn_4.3_, qZn_5.3*_Pop, population
Discussion
Zinc malnutrition remains a major health concern in the developing world due to the monotonous consumption of less nutritious cereals and lack of dietary diversity (Arfi et al. 2022; Wessells and Brown 2012). Biofortified crop varieties are cheaper, easily accessible, and sustainable sources of daily nutrition (Bouis and Saltzman 2017; Nuthalapati et al. 2022; Pradhan et al. 2020). Even though several high Zn rice varieties have been released in different countries of Asia, there is a need to enhance the grain Zn content, to broaden the scope of Zn breeding to other Asian countries and fast-track Zn mainstreaming in rice (Bouis and Saltzman 2017; Calayugan et al. 2021). Therefore, understanding the genetic basis of grain Zn content and associated agronomic and yield traits could help breed Zn enriched rice varieties. In the present study we dissected genetic factors responsible for high grain Zn content, agronomic and yield traits using four aus derived bi-parental populations.
Several studies have reported the importance of aus accessions in breeding for stress tolerance and nutritional improvement in rice (Inabangan-Asilo et al. 2019; Palanog et al. 2023; Rakotondramanana et al. 2022). The aus accessions are rich source of grain Zn content but they have been less explored in molecular characterization to identify QTLs/genes for grain Zn conent in rice (Rakotondramanana et al. 2022; Swamy et al. 2018). The IRRI rice gene bank holds > 3000 aus accessions. Our efforts to systematically characterize them for grain Zn content and yield potential resulted in identification of several promising high Zn donor accessions such as Kaliboro (IRGC77201-1), Jamir (IRGC117765), UCP122 (IRGC8794-1), Lalsaita (IRGC43915-1) etc. (Palanog et al. 2023; Rakotondramanana et al. 2022; Swamy et al. 2018). We developed four RILs populations using high Zn donor accessions UCP122 and Lalsaita, and characterized them for agronomic, yield and grain Zn content traits for two seasons at IRRI. Both the donor accessions had two to three folds more grain Zn content than the recipient parents. All the populations showed wider variations and transgressive segregants with highly significant genotypic effects and modest to high heritability for almost all the traits across the seasons and populations (Table 1). These results are in consonance with earlier reports on traits distributions, genotypic effects and heritability (Calayugan et al. 2020; Descalsota et al. 2019a; Singhal et al. 2021; Suman et al. 2021). The parental lines of the RILs showed moderate marker polymorphism with a rate of > 55% between the parents and a very few segregation distortortion (Rahman et al. 2017; Sasaki 2005; Wen et al. 2020).
We mapped a total of 56 QTLs for seven traits through ICIM in four populations, as expected the highest number of QTLs were identified for DF (14), Zn (13) and YLD (10). However, majority of the minor effect QTLs were identified in a specific season or population. qDF7.1, qDF7.4, qDF8.1, qPH1.1, qYLD9.2,* qZn_5.1, qZn5.2, and qZn7.1_ each explained a PV > 10%. The qPH_1.1_ is the only locus identified in both the seasons and all the populations and co-located at “sd1” on chromosome 1 (Bhuvaneswari et al. 2020; Yu et al. 2020). Interestingly, at 59% of the loci trait enhancing QTL alleles were contributed by the donor parents. It implies that aus accessions are a rich source of novel alleles for grain Zn, yield and yield related traits. qZn_5.1_, qZn_5.2_, qZn_5.3_, qZn_6.2_, qZn_7.1_ and qYLD_1.2_ were identified by both ICIM and association analysis (Symonds et al. 2005). qZn_7.1_ had the highest PV (17.8%) and additive effect (2.5 ppm) followed by Zn_5.1_ having a PV of 14.4% and additive effect of 1.5 ppm. qZn_5.1, qZn5*.2,_ qZn5.3 and qZn7.1 were consistently reported from aus accessions derived populations and found to contribute upto 3 ppm grain Zn content (Calayugan et al. 2020; Descalsota et al. 2019a, b; Zaw et al. 2019). Several previous studies reported that Zn donors from aus sub-species of rice can be potential source of QTLs, genes and haplotypes for improving the grain Zn content of rice (Babu et al. 2020; Calayugan et al. 2020; Descalsota et al. 2019a; Joshi et al. 2023; Rakotondramanana et al. 2022).
Epistasis plays an important role in phenotypic expression of traits. QTL epistatic effects can be as large as individual main effect QTLs, and can also occur between minor effect QTLs (Norton et al. 2010). Therefore, dissecting epistatic effects of major QTLs is essential prior to their deployment in the breeding programs (Calayugan et al. 2020). We identified 16 epistatic interactions for DF, PN, PL, YLD and Zn content, their PVE ranged from 4.5 to 11.4%. The highest number of epistatic interactions were observed for DF and Zn (5) followed by YLD (3) (Table 3). All the observed epistatic interactions except one involving qZn5.1 were independent, similar results were reported in earlier studies (Descalsota et al. 2019a; Singhal et al. 2021; Uttam et al. 2023). Epistatic interactions between QTLs for Zn and PH affected their phenotypes, and also genetic background found to influence the epistatic effects that led to variable phenotypic expression (Islam et al. 2020; Jiang et al. 2008; Lekklar et al. 2019; Xu et al. 2017). Thus, epistatic effect of major QTLs and their intreactions with the genetic backgrounds should be verified before using them in the breeding programs (Calayugan et al. 2020; Islam et al. 2020; Lu et al. 2009).
Dissection and validation of major effect QTLs through fine mapping, insilico candidate gene analyses and use of gene specific markers can further improve the accuracy and precision of genomics assisted breeding. It also helps in shortlisting candidate genes for further molecular characterization (Zhu and Zhao 2007). With the recent advancements in rice genomics, post QTL analyses are routinely carried out using insilico tools to understand the genetic bases of QTLs and to deduce the candidate genes. Several studies have thoroughly characterized major effect Zn and Fe QTLs to list candidate genes and to imply their role in metal homeostasis and biofortification (Raza et al. 2019; Sasaki et al. 2015; Satoh-Nagasawa et al. 2012; Swamy et al. 2016, 2018). In this study we specifically tragetted qZn6.2 a relatively a novel QTL for insilico characterization. In all there were 11 different genes within 50 kb region of qZn6.2 but LOC_Os06g48720 is the most probable candidate gene as it encodes for cadmium/zinc-transporting ATPase4 proteins that helps in Zn transport. OsHMA family genes such as OsHMA1, OsHMA2 and OsHMA3 are known to regulate Zn uptake and translocation in rice (Huang et al. 2022; Mu et al. 2021; Sasaki et al. 2014). TheOsHMA2 that expresses in the plasma membrane of root pericycle-cells and phloem contributes to preferential distribution of Zn in the developing tissues, and also plays a key role in the inter-vascular transfer of Zn and Cd (Sasaki et al. 2014; Satoh-Nagasawa et al. 2012; Takahashi et al. 2012b; Yamaji et al. 2013). Insilico expression analyses results showed that OsHMA2 expressed in root, phloem cells, inflorescence, anther, pistil, lemma, palea, ovary, and embryo indicating its role in the remobilization of Zn at the time of flowering and seed maturation stages (Figure S1). Several genes/gene families such as OsNAS, OsIRT, OsZIP OsYSL, OsNRAMP, OsNAAT, OsVIT, OsIDEF, OsMTP. OsIRT, OsOPT, OsHMA etc. play pivotal role in Zn homeostasis from Zn absorption to transportation from roots to grain through translocation, remobilization and loading (Mu et al. 2021; Sasaki et al. 2014, 2015; Satoh-Nagasawa et al. 2012; Takahashi et al. 2012a; 2012b; Tan et al. 2019). The co-location of metal homeostasis genes with Zn QTLs provide positive evidence for the accuracy of mapping and usefulness of these QTLs in genomics assisted breeding for improved grain Zn content in rice (Mohiuddin et al. 2020).
Identification of superior QTL classes, capturing and fixing the positive QTL × QTL, and QTL × background interactions in early generations can improve the efficiency of marker assisted breeding programs (Kumar et al. 2018; Vikram et al. 2015). In this study we identified superior QTL classes for both grain Zn and YLD. In general there was an increase in YLD and Zn with increase in number of respective QTLs in the RILs. The qZn5.1, qZn5.2 and qZn5.3 are the major contributors to increased grain Zn content either individually or in combination with other Zn QTLs in different populations. Similary, qYLD1.2 is the major contributor to yield increase in P1 and P2, while, qYLD5.1 is the major contributor and had highest effect on yield increase in P3 and P4. However, there were specific QTL combinations/classes that were superior over others in different populations (Table 5). So, choosing better combination of QTLs for marker assisted QTL pyramiding is necessary to achive better results.
Genomic selection that captures genome wide information for selection of best plants has become intergral part of the breeding programs to achieve better genetic gains within short time and with less cost (Zaghum et al. 2022). The accurate genomic prediction for single trait is easier than multi-trait analysis because of the complex nature and negative correlation between traits. The single trait model exhibited more than two folds and three folds higher accuracy for YLD and grain Zn over the multi-trait model to select the best plants. Thus, it is clear that the multi trait analysis reduced the prediction ability of grain YLD and Zn (Arojju et al. 2020; Rakotondramanana et al. 2022). Even though different multi-trait analyses are effective but not always superior over single-trait models (Muvunyi et al. 2022). Therefore, considering the correlation between traits and the desired genetic gain to predict the grain Zn and YLD, it is better to follow single-trait based predictions. Then, based on the estimated breeding values for Zn and YLD, a selection index can be built for recycling the lines as parents in the crossing program (Pešek and Baker 1969).
The simultaneous improvement of two or more complex traits in a breeding program depends on the genetic correlation between the traits. Positively related traits can be simultaneously improved through indirect selection, while negatively correlated traits need specific breeding strategies (Dhurai et al. 2016). YLD is usually negatively correlated with grain Zn, (Ata-Ul-Karim et al. 2022; Babu et al. 2020; Calayugan et al. 2020) but there are also contrasting reports on the association of grain Zn with YLD and agro-morphological traits (Calayugan et al. 2020; Gangashetty et al. 2013; Vikram et al. 2015; Wissuwa et al. 2008). In our study, grain Zn and YLD was also negatively correlated, and their contributions to total variations was in opposite directions (Figs. 1, 2). Agronomic traits such as DF, PH, PL positively contributed to YLD indicating their importance in selection for better yield (Calayugan et al. 2020). Thus, selecting these traits with high Zn and acceptable yield potential is essential to select transgressive segregants for developing commercially viable Zn biofortified rice varieties. We identified several RILs having ≥ 24 ppm evaluated over two seasons with yield similar to recipient parents in four RILs populations. The top five genotypes selected based on YLD and grain Zn from each population showed promising levels of grain Zn (≥ 24 ppm) and acceptable yield (> 5.0 t/ha) (Table 6). These lines can be tested for varietal release or used as donors in the Zn breeding programs (Calayugan et al. 2020; Rana et al. 2019; Singh et al. 2018).
Conclusion
Breeding Zn biofortified crops help tackling Zn malnutrition in the developing world. Genetic analyses of rice panels and populations to identify high Zn donors, QTLs and genes help fast tracking the development of Zn biofortfied rice varieties. In this study we characterized four biparental populations for agronomic, YLD and Zn traits. All the traits showed wider variations, significant genotypic effects and moderate to high heritabilities. ICIM identified 56 QTLs for agronomic, YLD, and Zn traits, and 16 MTAs were detected for YLD and Zn by association analyses. The PV explained by these QTLs varied from 4.5% (qPN4.1) to 31.7% (qPH1.1). qDF1.1, qDF7.2, qDF8.1, qPH1.1, qPH7.1, qPL1.2, qPL9.1,* qZn_5.1, qZn5.2, qZn6.1_ and qZn_7.1_ were identified in one or more populations and in both the seasons. qZn_7.1_ had the highest PVE (17.8%), LOD (32) and additive effect of (2.5) ppm. qZn_5.1_, qZn_5.2, qZn5.3,_ qZn_6.2,_ qZn_7.1_ and qYLD_1.2*_ were consistently identified by both ICIM and association analyses. There were five chromosomal regions with two or more QTLs co-located. We observed increased YLD and Zn with pyramiding of respective QTLs. In all 16 epistatic loci were identified for DF, PN, PL, YLD and Zn across the populations. The multi-trait model prediction accuracy results for YLD and grain Zn were 0.24 and 0.16, respectively. Promising genotypes exhibited high grain Zn ≥ 24 ppm with optimum levels yield ≥ 5.0 t/ha. Superior QTL classes were identified with high grain Zn and YLD, such combinations of QTLs are useful for varietal improvement. Over all, our results are useful for efficient Zn mainstream breeding of rice.
Supplementary Information
Below is the link to the electronic supplementary material.Supplementary file1 (DOCX 249 KB)
The reference list from the paper itself. Each links out to its DOI / PubMed record.
- 1IRRI. (2013). Standard Evaluation System for Rice. International Rice Research Instiitute, June, 55. http://www.clrri.org/ver 2/uploads/SES_5th_edition.pdf