Association between triglyceride glucose-waist height ratio index and overactive bladder: based on NHANES 2005-2018
Haiyan Mao, Tong Lin, Shanshan Huang, Zhenye Xie, Zhikui Chen

TL;DR
This study finds that a metabolic index called TyG-WHtR is linked to overactive bladder, suggesting it could help predict the condition.
Contribution
The study is the first to explore the association between TyG-WHtR and overactive bladder using a large national dataset.
Findings
Higher TyG-WHtR values are significantly associated with increased risk of overactive bladder.
The predictive ability of TyG-WHtR for OAB has a moderate AUC of 0.647.
The association is stronger in certain subgroups, such as by gender and age.
Abstract
The triglyceride glucose-waist height ratio (TyG-WHtR) index is a useful marker for predicting the risk of cardiovascular and metabolic diseases. Metabolic diseases are known to be high-risk factors for overactive bladder (OAB). However, no studies have explored the association between the TyG-WHtR index and the risk of developing OAB. Data from the National Health and Nutrition Examination Survey (NHANES) was utilized, and a weighted multivariate logistic regression analysis was conducted to investigate the relationship between TyG-WHtR and OAB. Subgroup analyses and interaction tests were also performed. Additionally, sensitivity analyses were conducted to validate the robustness of the findings. A smooth curve fitting and threshold effect analysis explored the nonlinear relationship between TyG-WHtR and the risk of developing OAB. The predictive value of the TyG-WHtR index for OAB…
Genes, proteins, chemicals, diseases, species, mutations and cell lines named across the full text — each resolved to its canonical identifier and authoritative record.
Click any figure to enlarge with its caption.
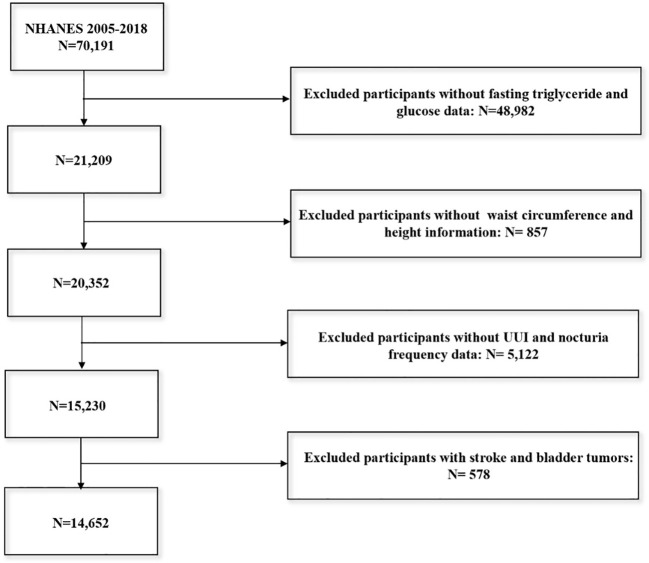 Figure 1
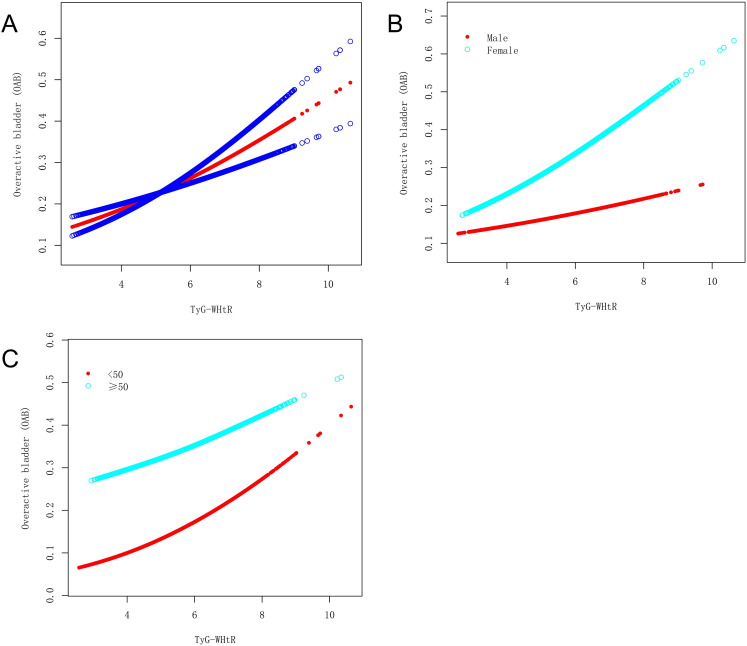 Figure 2
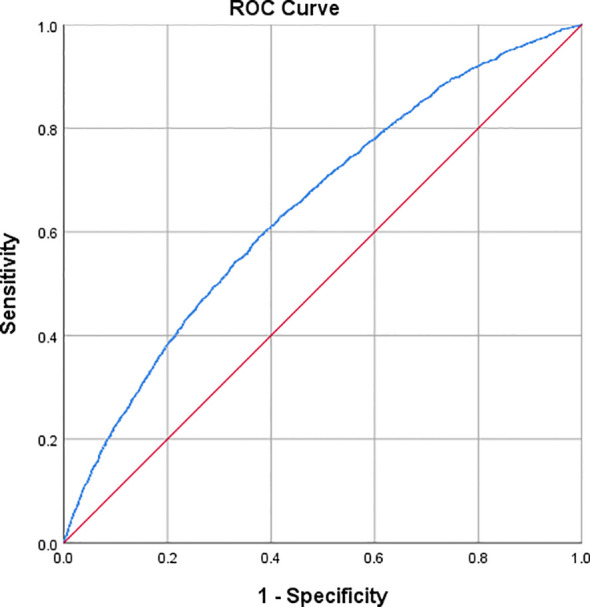 Figure 3
| Variables | Total (n = 14,652) | Without OAB (n = 11,253) | With OAB (n = 3,399) |
|
|---|---|---|---|---|
| Weight N | Weight N =197598146.7 | Weight N =159725862.1 | Weight N =37872284.55 | |
| TyG-WHtR, mean (Q1 , Q3 ) | 4.98 (4.29, 5.71) | 4.88 (4.21, 5.58) | 5.44 (4.73, 6.21) | <0.001 |
| Gender, n (%) | <0.001 | |||
| Male | 97332840.89 (49.26) | 85253809.11 (53.38) | 12079031.78 (31.89) | |
| Female | 100265305.80 (50.74) | 74472053.03 (46.62) | 25793252.77 (68.11) | |
| Age, n (%) | <0.001 | |||
| <50 | 112056658.27 (56.71) | 99875776.32 (62.53) | 12180881.95 (32.16) | |
| ≥50 | 85541488.42 (43.29) | 59850085.82 (37.47) | 25691402.59 (67.84) | |
| Race/Ethnicity, n (%) | <0.001 | |||
| Mexican American | 16980801.46 (8.59) | 14091680.97 (8.82) | 2889120.49 (7.63) | |
| Other Hispanic | 11068078.99 (5.60) | 9161028.10 (5.74) | 1907050.89 (5.04) | |
| Non-Hispanic White | 134243951.36 (67.94) | 108317742.52 (67.81) | 25926208.84 (68.46) | |
| Non-Hispanic Black | 21140362.31 (10.70) | 15917807.68 (9.97) | 5222554.63 (13.79) | |
| Other race/multiracial | 14164952.57 (7.17) | 12237602.87 (7.66) | 1927349.70 (5.09) | |
| Education level, n (%) | <0.001 | |||
| Less Than 9th Grade | 10028845.65 (5.08) | 7184351.97 (4.50) | 2844493.68 (7.51) | |
| 9-11th Grade | 20563548.77 (10.41) | 15377279.87 (9.63) | 5186268.89 (13.70) | |
| High School Grad/GED or Equivalent | 45992610.76 (23.28) | 36274719.82 (22.72) | 9717890.94 (25.67) | |
| Some College or AA degree | 61804829.15 (31.29) | 50333275.01 (31.52) | 11471554.14 (30.30) | |
| College Graduate or above | 59162331.38 (29.95) | 50523380.81 (31.64) | 8638950.57 (22.82) | |
| Poverty ratio, n (%) | <0.001 | |||
| <1 | 24970339.39 (13.46) | 18853030.02 (12.54) | 6117309.36 (17.38) | |
| 1-5 | 112806082.37 (60.80) | 90865922.59 (60.44) | 21940159.78 (62.33) | |
| ≥5 | 47768728.72 (25.75) | 40623628.42 (27.02) | 7145100.31 (20.30) | |
| BMI, kg/m2, n (%) | <0.001 | |||
| Normal weight | 59437517.95 (30.11) | 51464495.45 (32.25) | 7973022.50 (21.09) | |
| Overweight | 65300327.48 (33.08) | 54075692.36 (33.89) | 11224635.12 (29.69) | |
| Obese | 72659649.18 (36.81) | 54044950.72 (33.87) | 18614698.46 (49.23) | |
| Vigorous activity, n (%) | <0.001 | |||
| Yes | 48980300.39 (24.79) | 41898959.19 (26.23) | 7081341.20 (18.70) | |
| No | 148600519.59 (75.21) | 117812607.63 (73.77) | 30787911.97 (81.30) | |
| Moderate activity, n (%) | <0.001 | |||
| Yes | 61151987.66 (30.95) | 54398369.31 (34.06) | 6753618.35 (17.83) | |
| No | 136446159.02 (69.05) | 105327492.83 (65.94) | 31118666.19 (82.17) | |
| Cancer, n (%) | <0.001 | |||
| Yes | 17823127.04 (9.03) | 11204275.07 (7.02) | 6618851.97 (17.48) | |
| No | 179622031.59 (90.97) | 148379612.70 (92.98) | 31242418.89 (82.52) | |
| Coronary heart disease, n (%) | <0.001 | |||
| Yes | 6104046.56 (3.10) | 3893483.32 (2.44) | 2210563.24 (5.87) | |
| No | 190990093.10 (96.90) | 155538653.26 (97.56) | 35451439.84 (94.13) | |
| Hypertension, n (%) | <0.001 | |||
| Yes | 61894708.29 (31.36) | 42968538.71 (26.94) | 18926169.58 (49.99) | |
| No | 135476384.50 (68.64) | 116542176.24 (73.06) | 18934208.26 (50.01) | |
| Diabetes, n (%) | <0.001 | |||
| Yes | 17249330.27 (8.73) | 10399864.29 (6.51) | 6849465.98 (18.10) | |
| No | 176030941.67 (89.14) | 146528529.11 (91.79) | 29502412.57 (77.96) | |
| Borderline | 4200690.67 (2.13) | 2708228.54 (1.70) | 1492462.13 (3.94) | |
| Smoke status, n (%) | 0.002 | |||
| Yes | 88909303.84 (45.01) | 70423060.04 (44.10) | 18486243.80 (48.86) | |
| No | 108607134.06 (54.99) | 89258951.13 (55.90) | 19348182.93 (51.14) | |
| Alcohol use, n (%) | <0.001 | |||
| Yes | 133208487.17 (68.12) | 110790669.65 (70.01) | 22417817.52 (60.11) | |
| No | 62328442.74 (31.88) | 47450047.70 (29.99) | 14878395.04 (39.89) | |
| Total cholesterol, mg/dl, mean (Q1 , Q3 ) | 190.00 (164.00, 217.69) | 189.00 (164.00, 217.00) | 192.00 (166.00, 221.00) | 0.031 |
| Glycohemoglobin, %, mean (Q1 , Q3 ) | 5.40 (5.20, 5.70) | 5.40 (5.10, 5.70) | 5.60 (5.30, 6.00) | <0.001 |
| Albumin, g/l, mean (Q1 , Q3 ) | 43.00 (40.00, 45.00) | 43.00 (41.00, 45.00) | 41.00 (39.00, 43.00) | <0.001 |
| ALT, U/L, mean (Q1 , Q3 ) | 21.00 (16.00, 29.00) | 21.00 (16.00, 29.00) | 20.00 (15.00, 27.00) | <0.001 |
| AST, U/L, mean (Q1 , Q3 ) | 22.00 (19.00, 27.00) | 22.00 (19.00, 27.00) | 22.00 (18.00, 27.00) | 0.02 |
| eGFR, mL/min/1.73m², men (Q1 , Q3 ) | 95.59 (80.71, 109.29) | 97.38 (83.07, 110.83) | 87.15 (70.99, 101.28) | <0.001 |
| Model 1 | Model 2 | Model 3 | ||||
|---|---|---|---|---|---|---|
| OR (95% CI) |
| OR (95% CI) |
| OR (95% CI) |
| |
| Tyg-WHtR | 1.646 (1.562, 1.735) | <0.001 | 1.518 (1.434, 1.608) | <0.001 | 1.310 (1.157, 1.484) | <0.001 |
| Categories | ||||||
| Quartile 1 | Reference | / | Reference | / | Reference | / |
| Quartile 2 | 1.767 (1.49, 2.095) | <0.001 | 1.512 (1.256, 1.822) | <0.001 | 1.411(1.121, 1.776) | 0.004 |
| Quartile 3 | 2.366 (1.992, 2.810) | <0.001 | 1.988 (1.670, 2.367) | <0.001 | 1.611(1.206, 2.153) | 0.002 |
| Quartile 4 | 4.260 (3.670, 4.944) | <0.001 | 3.195 (2.723, 3.750) | <0.001 | 2.034(1.419, 2.915) | <0.001 |
| P for trend | / | <0.001 | / | <0.001 | / | <0.001 |
| Variables | OR (95% CI) |
|
|
|---|---|---|---|
|
| 1.310 (1.157, 1.484) | <0.001 | |
| Gender | 0.011 | ||
| Male | 1.260 (1.025, 1.548) | 0.029 | |
| Female | 1.323 (1.138, 1.538) | <0.001 | |
| Age (years) | <0.001 | ||
| <50 | 1.426 (1.180, 1.724) | <0.001 | |
| ≥50 | 1.148 (0.992, 1.329) | 0.064 | |
| BMI | 0.121 | ||
| Normal weight | 1.542 (1.176, 2.022) | 0.002 | |
| Overweight | 1.371 (1.009, 1.862) | 0.044 | |
| Obese | 1.251 (1.099, 1.423) | 0.001 | |
| Vigorous activity | 0.109 | ||
| Yes | 1.480 (1.148, 1.910) | 0.003 | |
| No | 1.278 (1.121, 1.456) | <0.001 | |
| Moderate activity | 0.628 | ||
| Yes | 1.508 (1.153, 1.971) | 0.003 | |
| No | 1.276 (1.126, 1.447) | <0.001 | |
| Hypertension | 0.233 | ||
| Yes | 1.282 (1.099, 1.496) | 0.002 | |
| No | 1.348 (1.164, 1.560) | <0.001 | |
| Diabetes | 0.148 | ||
| Yes | 1.282 (1.016, 1.616) | 0.036 | |
| No | 1.348 (1.168, 1.556) | <0.001 | |
| Borderline | 1.357 (0.804, 2.290) | 0.237 | |
| Race/Ethnicity | 0.661 | ||
| Mexican American | 1.143 (0.888, 1.471) | 0.294 | |
| Other Hispanic | 1.115 (0.822, 1.511) | 0.478 | |
| Non-Hispanic White | 1.397 (1.176, 1.66) | <0.001 | |
| Non-Hispanic Black | 1.171 (0.987, 1.389) | 0.070 | |
| Other race/multiracial | 1.544 (0.998, 2.390) | 0.051 | |
| Smoke status | 0.928 | ||
| Yes | 1.330 (1.145, 1.546) | <0.001 | |
| No | 1.328 (1.093, 1.615) | 0.005 | |
| Alcohol use | 0.940 | ||
| Yes | 1.275 (1.095, 1.485) | 0.002 | |
| No | 1.360 (1.113, 1.663) | 0.003 |
| OAB | Adjusted OR (95% CI) |
|---|---|
| TyG-WHtR index | |
| Inflection point | 3.579 |
| TyG-WHtR <Inflection point | 2.163 (0.668, 7.009) 0.1983 |
| TyG-WHtR >Inflection point | 1.228 (1.141, 1.322) <0.001 |
| Log-likelihood ratio | 0.334 |
| Gender | |
| Male | |
| Inflection point | 3.850 |
| TyG-WHtR index<Inflection point | 0.836 (0.371, 1.883) 0.6654 |
| TyG-WHtR index>Inflection point | 1.175 (1.032, 1.337) 0.0147 |
| Log-likelihood ratio | 0.430 |
| Female | |
| Inflection point | 3.568 |
| TyG-WHtR index<Inflection point | 11.441 (1.263, 103.639) 0.0302 |
| TyG-WHtR index>Inflection point | 1.257 (1.147, 1.378) <0.0001 |
| Log-likelihood ratio | 0.028 |
| Age (years) | |
| Below50 | |
| Inflection point | 6.891 |
| TyG-WHtR index<Inflection point | 1.296 (1.118, 1.502) 0.0006 |
| TyG-WHtR index>Inflection point | 0.960 (0.690, 1.334) 0.8073 |
| Log-likelihood ratio | 0.134 |
| Over50 | |
| Inflection point | 5.583 |
| TyG-WHtR index<Inflection point | 1.017 (0.865, 1.196) 0.8404 |
| TyG-WHtR index>Inflection point | 1.263 (1.113, 1.432) 0.0003 |
| Log-likelihood ratio | 0.048 |
Peer Reviews
No public reviews on file for this paper yet. If you reviewed it on a platform where reviews are public (OpenReview, ICLR, NeurIPS, ICML), you can paste yours below so the community can read it here.
Videos
No videos yet. Explain this paper in a talk, walkthrough, or lecture? Add one.
Taxonomy
TopicsPelvic floor disorders treatments · Urinary Bladder and Prostate Research · Urinary Tract Infections Management
Introduction
Overactive bladder (OAB) is a common urological condition characterized by an overactive voiding reflex in the absence of urinary tract infection or other identifiable pathological changes. It is marked by symptoms such as urgency urinary incontinence (UUI) and frequent nocturia (1). The global prevalence of OAB is estimated to be around 11-16%, affecting over 400 million people worldwide (2). OAB imposes a significant economic burden on patients, with the average monthly cost of urinary symptoms for American adults being approximately $3,003. The healthcare expenses for OAB patients are more than 2.5 times higher than those without OAB (3). Furthermore, OAB significantly impacts patients’ quality of life; frequent trips to the bathroom can lead to reduced social activity, hinder work and daily life, and cause embarrassment, anxiety, and even depression. Additionally, OAB patients often suffer from severe autonomic dysfunction, which is highly correlated with the incidence of cardiovascular diseases (4, 5).
The exact etiology and pathogenesis of OAB remain unclear (6). Neurological disorders such as stroke, metabolic diseases, bladder factors, and lifestyle choices are all considered high-risk factors for the development of OAB (7, 8). Current treatment strategies for OAB emphasize long-term comprehensive management, including lifestyle changes, regular pelvic exercises, pharmacotherapy (such as vaginal estrogen, anticholinergic drugs, and β3 agonists), and invasive treatments (like sacral nerve modulation, percutaneous tibial nerve stimulation, and surgery) (9–11). However, these treatments mainly alleviate symptoms and are generally unable to cure OAB.
Obesity and diabetes are recognized as significant risk factors for OAB (8). Both conditions are frequently associated with insulin resistance (IR) (12). The triglyceride-glucose (TyG) index, calculated from fasting triglyceride and glucose levels, is a reliable marker of insulin resistance (13). Compared to traditional methods for assessing insulin resistance, such as the hyperinsulinemic-euglycemic clamp or the homeostasis model assessment of insulin resistance (HOMA-IR), the TyG index is simpler, more convenient, and cost-effective (14). The TyG index is a surrogate marker for identifying individuals at risk of metabolic diseases (such as type 2 diabetes and non-alcoholic fatty liver disease) and cardiovascular diseases (15–17). The waist-to-height ratio (WHtR) is an indicator of obesity. It has been found to more accurately reflect abdominal obesity and predict the risk of cardiovascular and metabolic diseases compared to traditional body mass index (BMI) (18, 19). Studies have demonstrated that combining the TyG index with obesity metrics provides better IR and cardiovascular risk. Compared to other TyG-derived indices, such as Triglyceride glucose-body mass index (TyG-BMI) or Triglyceride glucose-waist circumference (TyG-WC), which may not comprehensively reflect central obesity and whose predictive value may vary across different populations, TyG-WHtR not only incorporates dual information on both insulin resistance and abdominal obesity but also exhibits higher sensitivity and specificity in predicting cardiovascular risk and metabolic disorders (20, 21). Therefore, this study selected TyG-WHtR as the primary indicator for metabolic syndrome.
Research on the relationship between the TyG-WHtR index and OAB is limited. This study aims to utilize the extensive dataset from the National Health and Nutrition Examination Survey (NHANES) to conduct a comprehensive analysis, determining the relationship between the TyG-WHtR index and the risk of developing OAB.
Methods
Study design and population
All data analyzed in this study were obtained from NHANES (https://www.cdc.gov/nchs/nhanes). NHANES is a nationally representative survey program that encompasses a wide range of health indicators, including clinical examinations, laboratory tests, and questionnaire-based data. It employs a complex sampling design to ensure that the sample is representative of the national population (22). Our analysis utilized data from seven cycles of NHANES, spanning from 2005 to 2018. During this period, 70,191 individuals participated in the survey. We excluded those with missing fasting triglyceride or glucose data (n=48,982), waist circumference or height information (n=857), and incomplete data on UUI and nocturia frequency (n=5,122). Additionally, participants with a history of stroke and bladder tumors (n=578) were excluded. After these exclusions, 14,652 participants were included in the final analysis. The specific flow of participant selection is detailed in Figure 1.
Screening conditions and process for the study population.
TyG-WHtR measurement
The TyG-WHtR index is calculated using the formula: TyG-WHtR = TyG × WHtR (23), where TyG = ln [fasting triglycerides (mg/dl) × fasting glucose (mg/dl)/2] (24), and WHtR = waist circumference (cm)/height (cm). Participants had their fasting glucose and triglyceride levels measured after fasting for 9 hours. Height and waist circumference were measured by professionals at a mobile examination center.
OAB diagnosis
The diagnosis of OAB was obtained following previous research (25). In simple terms, OAB is determined using the Overactive Bladder Symptom Score (OABSS). The OABSS includes scores for the severity of UUI and nocturia. An OABSS score ≥3 is indicative of OAB (26, 27). The NHANES assessed UUI and nocturia severity through a questionnaire conducted by trained professional researchers via face-to-face interviews. UUI was determined by the question “Urinated before reaching the toilet?” and its severity was assessed by asking “How frequently does this occur?” Nocturia severity was assessed with the question “How many times do you urinate at night?”.
Demographic data, comorbidities, and other covariates
The covariates were selected according to the following protocol: demographic variables, including sex, age, race, and poverty income ratio (PIR), were included a priori as essential covariates. Additional covariates were identified and incorporated based on established risk factors for overactive bladder (OAB) as documented in the existing literature (20, 23, 28). The PIR is divided into three levels (“1,” “1-5,” and “5”) (29). Smoking history was defined as having smoked 100 or more cigarettes in a lifetime, while alcohol use was determined by whether the participant consumed 12 or more alcoholic drinks in a year. Medical history was based on self-reports of doctor-diagnosed diabetes, coronary heart disease, or cancer. Physical activity was categorized as vigorous or moderate intensity (yes/no). BMI was calculated as weight (kg) divided by height (m²) and classified into three categories: under 25 (normal weight), 25-29.9 (overweight), and 30 or above (obese). Laboratory indicators included albumin, alanine aminotransferase (ALT), aspartate aminotransferase (AST), total cholesterol, and glycohemoglobin. Kidney function was assessed using creatinine clearance rates calculated with the CKD-EPI Creatinine Equation (2021) (30).
Statistical analyses
Statistical analyses were conducted according to the NHANES analysis guidelines and recommended weighting. The Kolmogorov-Smirnov test was used to assess the normality of the data. Continuous variables that were not normally distributed were presented as median ± interquartile range, and comparisons between groups were made using the Mann-Whitney U test. Categorical variables were presented as frequencies and percentages, with comparisons between groups made using the chi-square test.
Weighted multivariable logistic regression analysis was used to investigate the relationship between TyG-WHtR and OAB. Three models were constructed: Model 1 was unadjusted, Model 2 was adjusted for gender, age, and race, and Model 3 was adjusted for all variables. The TyG-WHtR was also divided into quartiles, and a weighted multivariable logistic regression analysis and trend test were performed. Prior to finalizing the model, we assessed multicollinearity by calculating variance inflation factors (VIFs) for all candidate covariates, with a predetermined threshold of VIF < 5 indicating acceptable levels of collinearity. To address missing covariate data, the multiple imputation (MI) method was applied, and sensitivity analyses were conducted to reduce potential bias. Subgroup analyses and interaction tests were further performed to investigate the influence of other risk factors on the association between TyG-WHtR and OAB risk. The generalized additive model (GAM) was used to calculate predicted probabilities, and smooth curve fitting and threshold effect analysis were used to examine the nonlinear relationship between TyG-WHtR and OAB risk. Additionally, receiver operating characteristic (ROC) curve analysis was performed to quantify the value of the TyG-WHtR index in predicting OAB occurrence, using the area under the ROC curve (AUC). The optimal cut-off value was determined using the Youden Index (sensitivity + specificity − 1).
All statistical analyses were conducted using R software (version 4.0.0), EmpowerStats (version 4.0), and SPSS (version 25.0), with a significance level set at P<0.05.
Results
Baseline characteristics
Table 1 presents the baseline characteristics of the study population. A total of 14,652 adults aged 20 years and older were included in the study. After applying sampling weights, the estimated population size was 197,598,146.7, of which 97,332,840.89 (49.26%) were male, and 85,541,488.42 (43.29%) were aged 50 years or older. Among the 14,652 participants, 3,399 were diagnosed with OAB, corresponding to a weighted estimate of 37,872,284.55 individuals. The median TyG-WHtR for the overall population was 4.98, while the median TyG-WHtR for OAB patients was 5.44, which was higher than the median TyG-WHtR for non-OAB participants (4.88). The proportion of males in the OAB group was lower than in the non-OAB group (31.89% vs. 53.38%). The OAB group also had a higher proportion of participants aged 50 years and older, females, individuals with obesity, and those with lower physical activity levels. Additionally, the OAB group had higher levels of total cholesterol and glycohemoglobin, as well as higher rates of cancer, coronary heart disease, hypertension, and diabetes compared to the non-OAB group.
Associations between the TyG-WHtR index and OAB
Weighted logistic regression analysis was conducted to explore the association between the TyG-WHtR index and OAB. As shown in Table 2, in the unadjusted model (Model 1), TyG-WHtR was significantly positively associated with OAB (OR=1.646; 95% CI: 1.562, 1.735; P<0.001). This positive association remained significant after adjusting for age, gender, and race/ethnicity (Model 2) (OR=1.518; 95% CI: 1.434, 1.608; P<0.001). Even after adjusting for all covariates (Model 3), the positive association between the TyG-WHtR index and OAB remained significant, with each one-unit increase in the TyG-WHtR index associated with a 1.310-fold increased risk of OAB (95% CI: 1.157, 1.484; P<0.001).
Subsequently, the TyG-WHtR was divided into four quartiles, with Quartile 1 used as the reference group. After adjusting for all confounding factors, the odds ratios (ORs) with corresponding confidence intervals (CIs) indicated significant positive associations for Quartiles 2, 3, and 4 compared to Quartile 1. Specifically, compared to Quartile 1, the ORs for Quartiles 2, 3, and 4 were 1.411 (95% CI: 1.121, 1.776; P=0.004), 1.611 (95% CI: 1.206, 2.153; P=0.002), and 2.034 (95% CI: 1.491, 2.915; P<0.001), respectively. Additionally, the trend test (P for trend<0.01) indicated that the risk of OAB increased as the TyG-WHtR quartile increased.
Sensitivity analysis
To evaluate the potential influence of missing data, we performed a sensitivity analysis using multiple imputation for missing values. Subsequent multivariate logistic regression analysis yielded results consistent with the original unimputed analysis (Supplementary Data Table S1), confirming the robustness of our findings.
Subgroup analysis
To investigate whether the relationship between the TyG-WHtR index and OAB is influenced by potential confounding factors or effect modifiers, we conducted subgroup analyses and interaction tests based on gender, age, ethnicity, BMI, lifestyle factors (such as smoking, alcohol consumption, and physical activity), and medical history ((including hypertension and diabetes). As shown in Table 3, after adjusting for multiple confounding factors, the association between the TyG-WHtR index and OAB risk was stronger in women compared to men. When grouped by age, the association between the TyG-WHtR index and OAB risk gradually weakened with increasing age. These two subgroup interactions were statistically significant (interaction P values <0.05). However, when the subgroup analysis was stratified by BMI, lifestyle factors, hypertension, and diabetes, a positive association between the TyG-WHtR index and OAB risk was observed across all subgroups, with no significant interaction detected (interaction P values > 0.05). Among different race/ethnicity groups, the relationship between TyG-WHtR and OAB was most pronounced in Non-Hispanic Whites (OR=1.397, P < 0.001), while relatively weaker in other groups, with no significant interaction observed (P for interaction = 0.661). Overall, the relationship between the TyG-WHtR index and OAB risk showed variations across gender, age, and certain lifestyle factors, being particularly significant in women and individuals under 50 years old.
Nonlinear association between the TyG-WHtR index and OAB
A nonlinear relationship between the TyG-WHtR index and OAB was explored using a smooth curve fitting and threshold effect analysis, with the results shown in Figure 2, Table 4. A two-piecewise linear regression model identified a turning point at 3.579. When the TyG-WHtR index exceeded 3.579, a significant positive association between TyG-WHtR and OAB was observed (OR=1.228; 95% CI: 1.141, 1.322; P<0.001). Furthermore, we found a clear inflection point and saturation effect for the TyG-WHtR index in women and individuals over 50 years of age, with turning points at 3.568 and 5.583, respectively.
The association between the TyG-WHtR index and OAB. (A) The solid red line represents the smooth curve fit between variables. Blue bands represent the 95% confidence bands derived from the fit. (B) Stratified by gender. (C) Stratified by age.
ROC curve evaluation of the TyG-WHtR index in predicting OAB events
The predictive accuracy, sensitivity, and specificity of the TyG-WHtR index for OAB events were evaluated using ROC curve analysis. As shown in Figure 3, the TyG-WHtR index demonstrated a good ability to predict OAB events (AUC=0.647; 95% CI: 0.636, 0.657). Based on the Youden Index, the optimal cut-off value for the TyG-WHtR index in predicting OAB events was 5.261, with a sensitivity of 0.592 and a specificity of 0.622.
Receiver operating characteristic curves for baseline TyG-WHtR predicting OAB.
Discussion
In this study, we investigated the association between the TyG-WHtR index and the occurrence of OAB in a large cohort of American adults. We found a significant positive association between the two, and this association remained robust even after adjusting for various potential confounders. Sensitivity analyses were conducted to validate the robustness of the findings. Subgroup and interaction analyses revealed that the impact of the TyG-WHtR index on OAB may be influenced by gender and age, emphasizing the importance of considering these factors when assessing the relationship between the TyG-WHtR index and OAB. Furthermore, curve fitting analysis and threshold effect analysis demonstrated a highly significant positive relationship between the TyG-WHtR index and OAB. Additionally, the ROC analysis showed that the TyG-WHtR index has good predictive ability for OAB. Therefore, the TyG-WHtR index may serve as a novel risk predictor for OAB.
The TyG-WHtR index combines triglycerides, fasting glucose, and waist-to-height ratio, and it is closely associated with insulin resistance, hyperuricemia, diabetes, non-alcoholic fatty liver disease, and cardiovascular diseases (23, 28, 31–34). This study reveals a significant positive association between the TyG-WHtR index and OAB, suggesting a potential biological connection between metabolic syndrome markers and bladder dysfunction. Elevated TyG-WHtR levels may increase OAB risk through several mechanisms. First, insulin resistance and obesity can trigger systemic inflammation (23). Inflammatory mediators like tumor necrosis factor-α (TNF-α) and interleukin-6 (IL-6) may disrupt bladder neural and muscular sensitivity, leading to functional abnormalities in the bladder wall. This can cause fibrosis or stiffness in the bladder’s smooth muscle, reducing its adaptability to capacity changes and triggering overactive symptoms (7, 12, 35). Additionally, insulin resistance and obesity can impair endothelial function, causing arteriosclerosis and microcirculatory disturbances (36), which compromise blood and nutrient supply to the bladder, increasing sensitivity and contraction frequency (7, 8). Hormonal imbalances due to these conditions may also disrupt the sympathetic-parasympathetic nervous system balance, affecting bladder contraction and voiding (37). Furthermore, individuals with high TyG-WHtR levels often exhibit autonomic nervous system dysfunction, which can impair bladder control mechanisms (12, 38). Dysregulation of the autonomic nervous system may lead to detrusor muscle overactivity and urethral sphincter dysfunction, exacerbating OAB symptoms (39). Unhealthy lifestyle factors associated with high TyG-WHtR, such as high-calorie or irritant-rich diets, may also contribute to bladder dysfunction. For instance, excessive sugar or fat intake can directly affect bladder sensitivity and contraction (40, 41). In summary, the TyG-WHtR index’s association with OAB likely involves multiple pathways, including insulin resistance, adipose tissue distribution, inflammatory responses, and neuroendocrine dysregulation, collectively impairing bladder function and promoting OAB development.
Exploring subgroup analysis and interactions is crucial in clinical research to better understand the actual relationship between independent and dependent variables (42). In this study, we conducted subgroup analysis and interaction tests using gender, age (grouped by 50 years, the median age of the overall population), BMI, race, lifestyle factors (smoking, alcohol consumption, and physical activity), hypertension, and diabetes as stratifying variables. We found that the TyG-WHtR index had a stronger association with the risk of OAB in women and those under 50 years of age. This may be due to more pronounced hormonal levels, lifestyle factors such as dietary habits, stress levels, insulin resistance, and obesity in these two groups, which in turn affect bladder sensitivity and detrusor muscle activity, thereby increasing the risk of OAB (7, 37, 40, 41). While these findings hold significant implications for the U.S. population, it is important to acknowledge that the generalizability of the results to a global context requires careful consideration. Cultural, lifestyle, dietary, and healthcare system differences across countries and regions may influence the relationship between the TyG-WHtR index and OAB. Therefore, although this study provides valuable insights into the association between the TyG-WHtR index and OAB, future research should validate these findings in diverse cultural and lifestyle settings to ensure their global applicability. In summary, subgroup analyses indicate that the positive association between the TyG-WHtR index and OAB risk remains consistent across most populations, particularly among women and individuals under 50 years of age. These results suggest that the TyG-WHtR index could serve as a valuable indicator for predicting OAB risk, with promising potential for application in OAB risk screening. However, its broader applicability warrants further validation across different cultural and lifestyle contexts.
This study has several strengths. First, to our knowledge, this is the first study to evaluate the risk of OAB occurrence associated with the TyG-WHtR index. Clinically, the TyG-WHtR index is a convenient, economical, and easily obtainable indicator. Second, this study is based on a large, diverse cohort with a wide age range, providing a sufficient sample size to ensure the reliability and stability of the results. However, this study also has some limitations. First, as a retrospective study, it cannot establish causality. Second, despite considering many factors in our analysis, some potential confounders may not have been assessed due to the limitations of NHANES data. Third, symptoms of nocturia and urinary incontinence were collected through questionnaires, which may introduce recall bias. Additionally, factors such as genetic background, dietary patterns, and lifestyle differences may influence the generalizability of these findings.
Conclusion
The results of this study indicate a significant positive association between the TyG-WHtR index levels and the risk of OAB occurrence. The TyG-WHtR index could potentially serve as a novel predictive marker for OAB risk. Future research should include longitudinal and interventional studies to further validate these findings, explore causal relationships, and elucidate underlying pathological mechanisms. Additionally, evaluating the global applicability of these results across diverse cultural and lifestyle contexts, as well as developing multifactorial predictive models, could enhance early identification and risk assessment capabilities for OAB.
The reference list from the paper itself. Each links out to its DOI / PubMed record.
- 1Haylen B Tde Ridder D Freeman RM Swift SE Berghmans B Lee J. An International Urogynecological Association (IUGA)/International Continence Society (ICS) joint report on the terminology for female pelvic floor dysfunction. Int Urogynecol J. (2010) 21:5–26. doi: 10.1007/s 00192-009-0976-9 19937315 · doi ↗ · pubmed ↗
- 2Cameron AP Chung DE Dielubanza EJ Enemchukwu E Ginsberg DA Helfand BT. The AUA/SUFU guideline on the diagnosis and treatment of idiopathic overactive bladder. J Urol. (2024) 212:11–20. doi: 10.1097/JU.0000000000003985 38651651 · doi ↗ · pubmed ↗
- 3Durden E Walker D Gray S Fowler R Juneau P Gooch K. The economic burden of overactive bladder (OAB) and its effects on the costs associated with other chronic, age-related comorbidities in the United States. Neurourol Urodyn. (2018) 37:1641–9. doi: 10.1002/nau.23513 29464813 · doi ↗ · pubmed ↗
- 4Hsiao S-M Su T-C Chen C-H Chang T-C Lin H-H. Autonomic dysfunction and arterial stiffness in female overactive bladder patients and antimuscarinics related effects. Maturitas. (2014) 79:65–9. doi: 10.1016/j.maturitas.2014.06.001 25022469 · doi ↗ · pubmed ↗
- 5Choi JB Kim YB Kim BT Kim YS. Analysis of heart rate variability in female patients with overactive bladder. Urology. (2005) 65:1109–12. doi: 10.1016/j.urology.2005.01.029 15923026 · doi ↗ · pubmed ↗
- 6Kasman A Stave C Elliott CS. Combination therapy in overactive bladder-untapped research opportunities: A systematic review of the literature. Neurourol Urodyn. (2019) 38:2083–92. doi: 10.1002/nau.24158 31483070 · doi ↗ · pubmed ↗
- 7Henderson E Drake M. Overactive bladder. Maturitas. (2010) 66:257–62. doi: 10.1016/j.maturitas.2010.03.010 20399043 · doi ↗ · pubmed ↗
- 8Mckellar K Bellin E Schoenbaum E Abraham N. Prevalence, risk factors, and treatment for overactive bladder in a racially diverse population. Urology. (2019) 126:70–5. doi: 10.1016/j.urology.2018.12.021 30597170 · doi ↗ · pubmed ↗