HbA1c levels and breast cancer prognosis in women without diabetes
Jonas Busk Holm, Jens Meldgaard Bruun, Peer Christiansen, Reimar Wernich Thomsen, Jan Frystyk, Deirdre Cronin-Fenton, Signe Borgquist

TL;DR
Higher HbA1c levels in non-diabetic breast cancer patients are linked to a greater risk of cancer recurrence, but not overall mortality.
Contribution
This study identifies HbA1c as a potential metabolic biomarker for predicting breast cancer recurrence in non-diabetic patients.
Findings
Higher HbA1c quartiles were associated with increased risk of new breast cancer events.
No significant association was found between HbA1c levels and all-cause mortality.
A log2(HbA1c) increase correlated with higher risk of cancer recurrence.
Abstract
Diabetes is associated with impaired breast cancer prognosis; however, the effectiveness of glycosylated hemoglobin (HbA1c) as a prognostic biomarker in breast cancer remains uncertain, especially for patients without diabetes. We aimed to determine whether elevated HbA1c is associated with a worse prognosis in breast cancer patients without known diabetes. The study population comprised women with primary invasive stage I-III breast cancer between 2010 and 2020 surgically treated at Aarhus University Hospital, Denmark, without a diabetes diagnosis at baseline. We assessed HbA1c at breast cancer diagnosis as a categorical (quartiles; HbA1c-Q1 = 21–33 mmol/mol, HbA1c-Q2 = 34–36 mmol/mol, HbA1c-Q3 = 37–38 mmol/mol, HbA1c-Q4 = ≥ 39 mmol/mol) and log2-transformed continuous variable. Follow-up began at the date of primary breast cancer surgery and continued until the first occurrence of…
Genes, proteins, chemicals, diseases, species, mutations and cell lines named across the full text — each resolved to its canonical identifier and authoritative record.
Click any figure to enlarge with its caption.
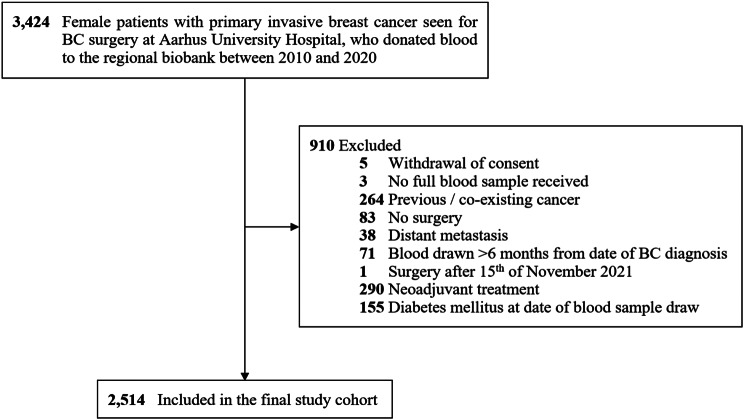 Figure 1
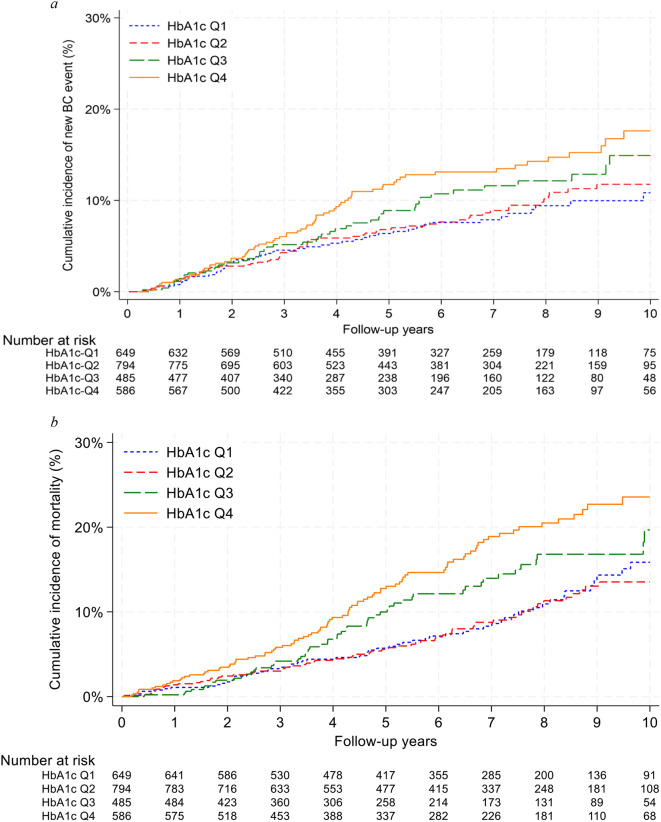 Figure 2
- —NEYE Foundation
- —Kræftens Bekæmpelse
- —Department of Oncology Research Foundation
- —Novo Nordisk Foundation STENO Collaborative Grant
- —Fagerlund Stiftelsen
Peer Reviews
No public reviews on file for this paper yet. If you reviewed it on a platform where reviews are public (OpenReview, ICLR, NeurIPS, ICML), you can paste yours below so the community can read it here.
Videos
No videos yet. Explain this paper in a talk, walkthrough, or lecture? Add one.
Taxonomy
TopicsMetabolism, Diabetes, and Cancer · Diabetes and associated disorders · Liver Disease Diagnosis and Treatment
Introduction
Approximately 2.3 million individuals receive a breast cancer (BC) diagnosis worldwide each year [1]. Among females, BC represents one in four incident cancers and one in six cancer-related fatalities [1]. In 2021, an estimated 537 million adults worldwide had diabetes, and this number is expected to increase to 643 million by 2030 [2]. Similarly, the global obesity (Body Mass Index (BMI) \documentclass[12pt]{minimal} \usepackage{amsmath} \usepackage{wasysym} \usepackage{amsfonts} \usepackage{amssymb} \usepackage{amsbsy} \usepackage{mathrsfs} \usepackage{upgreek} \setlength{\oddsidemargin}{-69pt} \begin{document}$$\:\ge\:$$\end{document} 30 kg/m^2^) prevalence has more than doubled since 1990 [3]. Nearly 50% of adults are expected to have obesity by 2030 in the United States [4]. Obesity and diabetes are metabolic disorders associated with increased risk and inferior prognosis of BC [5–7]. Hyperglycemia is seen in both disorders and has been suggested as one of the mechanisms contributing to the associations with BC, as hyperglycemia may support tumor progression, for instance, through stimulation of cancer cell growth [7–12]. Continuous hyperglycemia translates into higher levels of glycosylated hemoglobin (HbA_1c_) [13]. However, the correlation between HbA_1c_ levels and BC prognosis, especially in BC patients without pre-diagnosed diabetes at the date of BC diagnosis, is ambiguous [14–21]. Earlier studies of HbA_1c_ and BC prognosis have produced contradictory findings. Some suggested an association between higher HbA_1c_ levels and poorer BC outcomes [14–16], while others found no relationship [17–21]. Most studies included patients with pre-existing diabetes at baseline and used HbA_1c_ above diabetes cutoff (HbA_1c_ \documentclass[12pt]{minimal} \usepackage{amsmath} \usepackage{wasysym} \usepackage{amsfonts} \usepackage{amssymb} \usepackage{amsbsy} \usepackage{mathrsfs} \usepackage{upgreek} \setlength{\oddsidemargin}{-69pt} \begin{document}$$\:\ge\:$$\end{document} 48 mmol/mol [22]) as exposure [14, 15, 17–20], which does not provide a complete understanding of the role that pre-diabetic HbA_1c_ elevations play. A few of the studies counted participants without BC at baseline [16, 21]. No long-term prognostic study has concentrated solely on BC patients without diabetes at the time of their BC diagnosis, and the association between HbA_1c_ and the risk of subsequent BC events, such as recurrence or contralateral BC, has not been thoroughly examined.
We hypothesized that high HbA_1c_ is associated with inferior prognosis in BC patients without diabetes. We examined the association between HbA_1c_ levels at BC diagnosis and risk of new BC events and all-cause mortality in BC patients without diabetes.
Materials and methods
Data sources
The cohort has been described in detail previously [23]. We merged all data through a unique identification number assigned to all Danish residents at birth or immigration. Danish BC patients are registered in the Danish Breast Cancer Group (DBCG) database [24]. Patient, tumor, and treatment characteristics came from the DBCG database and medical records [23]. Diabetes status was collected from the Danish Adult Diabetes Registry [25]. BMI data were sourced from the Danish Anaesthesia Database [26] and medical records. We received information on emigration and comorbidities from the Civil Registration System [27] and National Patient Registry [28] included in “The Danish Clinical Quality Program - National Clinical Registries” [29]. Outcome data were gathered through a systematic review of medical records, based on a prespecified codebook [23].
Study population
The study population comprised women with newly diagnosed stage I–III BC at Aarhus University Hospital, Denmark, between 2010 and 2020 [23]. These patients were referred for BC surgery at the hospital and asked to contribute blood samples to the Danish Cancer Biobank [30]. Blood was drawn a median of seven days after the primary invasive BC diagnosis (IQR 6–11 days) [23]. The final study cohort included 2514 surgically treated stage I-III BC patients without diabetes at the date of the blood sample draw (Fig. 1). The Danish National Committee on Health Research Ethics approved this study (no. 1-10-72-192-20). Informed consent was obtained from all included participants.
Fig. 1. Flowchart of the study cohort. After exclusion, 2514 women with surgically treated incident stage I-III BC between 2010 and 2020 who donated blood to the regional biobank were included in the final study cohort. The women did not have a diabetes diagnosis at the date of the blood draw. This figure was modified from a previously published figure on the same cohort by Holm et al. [23]. Abbreviations: BC, Breast cancer
HbA1c analyses
Blood samples were stored at -80^o^C in the Danish Cancer Biobank [23]. HbA_1c_ levels were assessed with Sebia Capillarys 3 Tera TLA instruments [31] and reported in mmol/mol in line with the recommendations of the International Federation of Clinical Chemistry and Laboratory Medicine [32].
Definitions of analytic variables
Main exposure variable
HbA1clevels at BC diagnosis. HbA_1c_ was assessed as a categorical variable and as a log2-transformed continuous variable. For the categorical analyses, HbA_1c_ was divided into quartiles based on the final study cohort (HbA_1c_-Q1 (reference) = 21–33 mmol/mol; HbA_1c_-Q2 = 34–36 mmol/mol; HbA_1c_-Q3 = 37–38 mmol/mol; HbA_1c_-Q4= \documentclass[12pt]{minimal} \usepackage{amsmath} \usepackage{wasysym} \usepackage{amsfonts} \usepackage{amssymb} \usepackage{amsbsy} \usepackage{mathrsfs} \usepackage{upgreek} \setlength{\oddsidemargin}{-69pt} \begin{document}$$\:\ge\:$$\end{document} 39 mmol/mol), and according to standard threshold for diagnosis of diabetes (HbA_1c_ \documentclass[12pt]{minimal} \usepackage{amsmath} \usepackage{wasysym} \usepackage{amsfonts} \usepackage{amssymb} \usepackage{amsbsy} \usepackage{mathrsfs} \usepackage{upgreek} \setlength{\oddsidemargin}{-69pt} \begin{document}$$\:\ge\:$$\end{document} 48 mmol/mol) from the American Diabetes Association and the International Expert Committee [22, 33]. We assessed HbA_1c_ levels in quartiles, as diabetes cut-off points for HbA_1c_ may not be adequate when examining the role of HbA_1c_ in BC. For BMI-stratified analyses, we recalculated quartiles within each BMI group.
Covariates
Patient characteristics. Diabetes status refers to whether the patient was registered with diabetes in the Danish Adult Diabetes Registry [25] at the date of the blood sample draw. BMI categorization followed the World Health Organization classification [34]: underweight (BMI < 18.5 kg/m^2^), normal weight (18.5 ≤ BMI < 25 kg/m^2^), overweight (25 ≤ BMI < 30 kg/m^2^), and obesity (BMI ≥ 30 kg/m^2^). We used the closest registered BMI measurement from the blood sample date [23]. Menopausal status and age (following DBCG guidelines [24]) referred to the time of BC diagnosis. Comorbidities were assessed as Charlson Comorbidity Index score (0, 1–2 (mild), & \documentclass[12pt]{minimal} \usepackage{amsmath} \usepackage{wasysym} \usepackage{amsfonts} \usepackage{amssymb} \usepackage{amsbsy} \usepackage{mathrsfs} \usepackage{upgreek} \setlength{\oddsidemargin}{-69pt} \begin{document}$$\:\ge\:$$\end{document} 3 (moderate/severe)), incorporating comorbidities registered in the National Patient Registry up to 10 years before BC diagnosis [35].
Tumor characteristics. Tumor size and lymph node metastases were categorized according to the American Joint Committee on Cancer Staging 8th edition [36]. We classified tumors as ER (estrogen receptor)-negative if tumor cells showed no expression of ER, or ER-positive if \documentclass[12pt]{minimal} \usepackage{amsmath} \usepackage{wasysym} \usepackage{amsfonts} \usepackage{amssymb} \usepackage{amsbsy} \usepackage{mathrsfs} \usepackage{upgreek} \setlength{\oddsidemargin}{-69pt} \begin{document}$$\:\ge\:$$\end{document} 1% expressed ER. Human Epidermal Growth Factor Receptor 2 (HER2) expression was defined as positive or negative through immunohistochemistry and Fluorescence In Situ Hybridization (FISH)-ratio according to guidelines by the American Society of Clinical Oncology [37]. Nottingham Group standardization was used for histological grade [36] and the World Health Organization’s Classification of Breast Tumors 3rd Edition for histological classification [38].
Treatment characteristics. Surgery type (mastectomy or lumpectomy) referred to the final primary BC surgery [23]. Endocrine therapy, chemotherapy, anti-HER2 therapy, and radiotherapy were included as intention-to-treat variables (defined by DBCG protocols).
Outcomes
We defined BC recurrence as recurrent invasive BC in the ipsilateral breast or ipsilateral lymph nodes (loco-regional), or outside of these locations (distant) ≥ 3 months after the last surgery date for primary BC (final primary surgery) [23]. We only included the first registered BC recurrence. Malignancy in the contralateral breast after final primary surgery was registered as contralateral BC [23]. We also registered deaths and new primary cancers other than BC, apart from non-melanoma skin cancer [23]. BC recurrence (loco-regional or distant) and contralateral BC were considered new BC events.
Statistical analyses
Follow-up for new BC events and distant recurrence started on the final primary surgery date and continued until one of the following: invasive BC recurrence (loco-regional or distant), contralateral BC, new primary cancer other than BC, death, emigration, or last follow-up date (November 15th, 2021). In follow-up for new BC events, we treated BC recurrence (loco-regional or distant) and contralateral BC as events and censored at new primary cancer, death, emigration, or November 15th, 2021. For the Aalen-Johansen estimators, competing events were new primary cancer and death. For distant recurrence follow-up, distant BC recurrence was treated as an event, and censoring occurred at loco-regional BC recurrence, contralateral BC, new primary cancer, death, emigration, or November 15th, 2021. If an event occurred within 30 days after a censoring point, we ignored the censoring point and included the event in the analysis.
All-cause mortality follow-up began at the final primary surgery date and continued until one of the following: death, emigration, or November 15th, 2021. We treated death as an event and censored at emigration or November 15th, 2021.
Person-years, number of events, and incidence rate per 1000 person-years (with 95% confidence intervals (95% CIs)) within each HbA_1c_ quartile were calculated. Crude and multivariable-adjusted hazard ratios (HRs) with 95% CIs for new BC events, distant recurrence, and all-cause mortality were estimated using Cox models in relation to categorized HbA_1c_ and log2(HbA_1c_). The Cox models were utilized for a maximum follow-up of 10 years. Two multivariable models were run. Model 1 was adjusted for crucial confounders, as indicated by a directed acyclic graph, namely age, menopausal status, BMI, and comorbidities (Supplementary Fig. 1). Model 2 was exploratory and included tumor and treatment characteristics potentially mediating the impact of HbA_1c_ on BC prognosis, rather than qualifying as confounders. These covariates included ER status, HER2 receptor status, grade, classification, tumor size, lymph node metastases, surgery, radiotherapy, endocrine therapy, chemotherapy, and anti-HER2 therapy. This exploratory model intended to assess whether the observed associations would likely act through these factors. Only patients with complete data in the covariates were included (N = 2448 (model 1)/2336 (model 2)). We also conducted BMI-stratified analyses, ER-stratified analyses, and sensitivity analyses excluding patients with HbA_1c_ \documentclass[12pt]{minimal} \usepackage{amsmath} \usepackage{wasysym} \usepackage{amsfonts} \usepackage{amssymb} \usepackage{amsbsy} \usepackage{mathrsfs} \usepackage{upgreek} \setlength{\oddsidemargin}{-69pt} \begin{document}$$\:\ge\:$$\end{document} 48 mmol/mol (diabetes threshold [22]). For distant recurrence, BMI-stratified, and ER-stratified analyses, model 2 was not presented due to an insufficient number of events [39]. Patients classified as underweight were omitted from the BMI-stratified analyses because of the low number of such patients. We provided Aalen-Johansen estimators on the cumulative incidence of new BC events, and Kaplan-Meier estimators on the cumulative incidence of all-cause mortality, according to HbA_1c_ quartiles overall and within BMI groups. All analyses were conducted using Stata version 18.
Results
The study cohort comprised 2514 stage I–III BC patients without diabetes. The median age was 62 years (IQR 52–69), median BMI was 24.7 kg/m^2^, and 349 patients (13.9%) had a Charlson Comorbidity Index score \documentclass[12pt]{minimal} \usepackage{amsmath} \usepackage{wasysym} \usepackage{amsfonts} \usepackage{amssymb} \usepackage{amsbsy} \usepackage{mathrsfs} \usepackage{upgreek} \setlength{\oddsidemargin}{-69pt} \begin{document}$$\:\ge\:$$\end{document} 3 (Table 1). Patients in the highest HbA_1c_ quartile (HbA_1c_-Q4, \documentclass[12pt]{minimal} \usepackage{amsmath} \usepackage{wasysym} \usepackage{amsfonts} \usepackage{amssymb} \usepackage{amsbsy} \usepackage{mathrsfs} \usepackage{upgreek} \setlength{\oddsidemargin}{-69pt} \begin{document}$$\:\ge\:$$\end{document} 39 mmol/mol) were older, more likely to be postmenopausal, had higher BMI, and more comorbidity. Patients in HbA_1c_-Q4 had larger tumors, more often exhibited ductal carcinomas, and were less likely to undergo chemotherapy. The characteristics of the patients with complete data (Model 2, N=2336) were similar to those in the crude analyses (N = 2514) (Supplementary Table 1).
Table 1. Characteristics of 2514 women with incident stage I-III breast cancer included in the final cohortCharacteristicsTotalN = 2,514HbA_1c_-Q1 21–33 mmol/molN = 649HbA_1c_-Q234-36 mmol/molN = 794HbA_1c_-Q337-38 mmol/molN = 485HbA_1c_-Q4 \documentclass[12pt]{minimal} \usepackage{amsmath} \usepackage{wasysym} \usepackage{amsfonts} \usepackage{amssymb} \usepackage{amsbsy} \usepackage{mathrsfs} \usepackage{upgreek} \setlength{\oddsidemargin}{-69pt} \begin{document}$$\:\ge\:$$\end{document} 39 mmol/N = 586Age,** median (IQR)62 (52–69)52 (47–64)61 (52–68)64 (58–71)67 (59–73)Age (years), categories**< 50441 (17.5%)229 (35.3%)137 (17.3%)42 (8.7%)33 (5.6%)50–59639 (25.4%)181 (27.9%)228 (28.7%)112 (23.1%)118 (20.1%)60–69852 (33.9%)156 (24.0%)274 (34.5%)198 (40.8%)224 (38.2%) \documentclass[12pt]{minimal} \usepackage{amsmath} \usepackage{wasysym} \usepackage{amsfonts} \usepackage{amssymb} \usepackage{amsbsy} \usepackage{mathrsfs} \usepackage{upgreek} \setlength{\oddsidemargin}{-69pt} \begin{document}$$\:\ge\:$$\end{document} 70582 (23.2%)83 (12.8%)155 (19.5%)133 (27.4%)211 (36.0%)Missing00000Body Mass Index (kg/m^2^),** median (IQR)24.74 (22.20-28.09)23.51 (21.56–25.94)24.34 (22.04–27.48)25.06 (22.15–28.24)27.10 (24.11–31.23)Body Mass Index, categories (kg/m**^2^**)**Underweight < 18.562 (2.5%)16 (2.5%)22 (2.8%)15 (3.1%)9 (1.6%)Normal weight 18.5 \documentclass[12pt]{minimal} \usepackage{amsmath} \usepackage{wasysym} \usepackage{amsfonts} \usepackage{amssymb} \usepackage{amsbsy} \usepackage{mathrsfs} \usepackage{upgreek} \setlength{\oddsidemargin}{-69pt} \begin{document}$$\:\le\:$$\end{document} to < 251,229 (49.6%)406 (63.6%)418 (53.4%)219 (45.6%)186 (32.3%)Overweight 25 ≤ to < 30769 (31.1%)163 (25.5%)231 (29.5%)171 (35.6%)204 (35.5%)Obesity ≥ 30416 (16.8%)53 (8.3%)112 (14.3%)75 (15.6%)176 (30.6%)Missing381111511 Menopausal status Premenopausal584 (23.5%)276 (43.0%)195 (25.0%)64 (13.2%)49 (8.5%)Postmenopausal1902 (76.5%)366 (57.0%)586 (75.0%)420 (86.8%)530 (91.5%)Missing2871317 Charlson Comorbidity Index 0341 (13.6%)106 (16.3%)105 (13.2%)63 (13.0%)67 (11.4%)1–2 (mild)1824 (72.6%)471 (72.6%)599 (75.4%)365 (75.3%)389 (66.4%) \documentclass[12pt]{minimal} \usepackage{amsmath} \usepackage{wasysym} \usepackage{amsfonts} \usepackage{amssymb} \usepackage{amsbsy} \usepackage{mathrsfs} \usepackage{upgreek} \setlength{\oddsidemargin}{-69pt} \begin{document}$$\:\ge\:$$\end{document} 3 (moderate/severe)349 (13.9%)72 (11.1%)90 (11.3%)57 (11.8%)130 (22.2%)Missing00000 Tumor size 0–20 mm1782 (71.0%)474 (73.1%)578 (73.1%)345 (71.1%)385 (65.8%)21–50 mm675 (26.9%)162 (25.0%)197 (24.9%)132 (27.2%)184 (31.5%)> 50 mm52 (2.1%)12 (1.9%)16 (2.0%)8 (1.6%)16 (2.7%)Missing51301 Lymph node metastases 01560 (62.6%)387 (60.2%)496 (62.9%)304 (63.2%)373 (64.3%)1–3693 (27.8%)196 (30.5%)218 (27.6%)130 (27.0%)149 (25.7%)4–9167 (6.7%)42 (6.5%)52 (6.6%)34 (7.1%)39 (6.7%) \documentclass[12pt]{minimal} \usepackage{amsmath} \usepackage{wasysym} \usepackage{amsfonts} \usepackage{amssymb} \usepackage{amsbsy} \usepackage{mathrsfs} \usepackage{upgreek} \setlength{\oddsidemargin}{-69pt} \begin{document}$$\:\ge\:$$\end{document} 1073 (2.9%)18 (2.8%)23 (2.9%)13 (2.7%)19 (3.3%)Missing216546 Histological classification Ductal1892 (75.3%)474 (73.0%)593 (74.7%)373 (76.9%)452 (77.1%)Lobular309 (12.3%)89 (13.7%)101 (12.7%)57 (11.8%)62 (10.6%)Other^a^313 (12.5%)86 (13.3%)100 (12.6%)55 (11.3%)72 (12.3%)Missing00000 Histological grade Not graded^b^154 (6.2%)43 (6.7%)50 (6.5%)33 (6.9%)28 (4.9%)Grade 1579 (23.5%)151 (23.6%)185 (23.9%)108 (22.5%)135 (23.4%)Grade 21140 (46.2%)282 (44.1%)350 (45.2%)233 (48.5%)275 (47.7%)Grade 3596 (24.1%)163 (25.5%)189 (24.4%)106 (22.1%)138 (24.0%)Missing451020510 ER status (% positive cells) 0% (negative)252 (10.1%)89 (13.7%)67 (8.5%)45 (9.3%)51 (8.8%)1-100% (positive)2249 (89.9%)559 (86.3%)722 (91.5%)438 (90.7%)530 (91.2%)Missing131525 HER2 status Negative2200 (89.3%)565 (88.1%)701 (90.2%)423 (89.8%)511 (89.0%)Positive263 (10.7%)76 (11.9%)76 (9.8%)48 (10.2%)63 (11.0%)Missing518171412 Final primary surgery ^c^ Mastectomy829 (33.2%)219 (33.9%)253 (32.1%)151 (31.2%)206 (35.4%)Lumpectomy1671 (66.8%)427 (66.1%)535 (67.9%)333 (68.8%)376 (64.6%)Missing143614 Adjuvant radiotherapy ^d^ No488 (20.0%)121 (19.1%)152 (19.7%)90 (19.1%)125 (22.2%)Yes1950 (80.0%)512 (80.9%)619 (80.3%)380 (80.9%)439 (77.8%)Missing7616231522 Endocrine therapy ^d^ No475 (19.5%)146 (23.1%)133 (17.3%)92 (19.6%)104 (18.4%)Yes1963 (80.5%)487 (76.9%)638 (82.7%)378 (80.4%)460 (81.6%)Missing7616231522 Anti-HER2 therapy ^d^ No2179 (89.2%)559 (88.0%)696 (90.2%)421 (89.8%)503 (88.9%)Yes263 (10.8%)76 (12.0%)76 (9.8%)48 (10.2%)63 (11.1%)Missing7214221620 Adjuvant chemotherapy ^d^ No1199 (49.2%)235 (37.1%)378 (49.0%)258 (54.9%)328 (58.2%)Yes1239 (50.8%)398 (62.9%)393 (51.0%)212 (45.1%)236 (41.8%)Missing7616231522a: “Other” refers to patients without registration of either invasive ductal or lobular carcinomab: In total, 154 patients’ tumors were not graded during the histological assessment, e.g. due to nonductal and nonlobular carcinomas were not graded for part of the study period or insufficient amount of tumor tissue for grading. We did not treat “Not graded” as a missing value in the multivariable modelsc: Final primary surgery refers to the last breast surgery procedure for the primary breast cancerd: Intention-to-treat variables based on the Danish Breast Cancer Group protocol allocationAbbreviations: Q1, Quartile 1; IQR, Interquartile range; ER, Estrogen receptor; HER2, Human Epidermal Growth Factor Receptor 2
Among the 2514 patients with BC, we registered 230 new BC events (195 recurrences and 35 contralateral BCs) during 14,126 person-years of follow-up for new BC events (median follow-up of 5.6 years). In follow-up for all-cause mortality, 267 deaths occurred during 14,913 person-years (median follow-up of 6.0 years).
Figure 2 displays the cumulative new BC event and all-cause mortality incidences across HbA_1c_ quartiles.
Fig. 2. Cumulative new breast cancer event and all-cause mortality incidences across HbA_1c_ quartiles. a: Cumulative new breast cancer event (BC recurrence or contralateral BC) incidences across HbA_1c_ quartiles (Aalen-Johansen estimator). Competing events: new primary cancer other than BC and death. b: Cumulative all-cause mortality incidences across HbA_1c_ quartiles (Kaplan-Meier estimator). Abbreviations: BC, Breast cancer; HbA1c Q1, HbA_1c_ quartile 1
The highest BC events and mortality incidences were observed in HbA_1c_-Q4. Table 2 provides the estimated HRs for a new BC event, distant recurrence, and all-cause mortality across HbA_1c_ quartiles. Among the 230 new BC events, the bulk occurred in HbA_1c_-Q4 (N = 71; 30.9%). An increased risk of a new BC event with rising HbA_1c_ quartiles was observed (Model 1, HbA_1c_-Q2: adjusted HR = 1.09, 95% CI = 0.75–1.60; HbA_1c_-Q3: adjusted HR = 1.35, 95% CI = 0.88–2.07; HbA_1c_-Q4: adjusted HR = 1.69, 95% CI = 1.13–2.54). Similarly, a higher hazard of distant recurrence was observed in HbA_1c_-Q4 compared to HbA_1c_-Q1 (Model 1, HbA_1c_-Q4, adjusted HR = 2.09 [95% CI = 1.23–3.56]). Out of the 267 recorded deaths, the majority were in HbA_1c_-Q4 (N = 91; 34.1%). No clearly increased mortality risk across quartiles compared to HbA_1c_-Q1 was noted (Model 1, HbA_1c_-Q2: adjusted HR = 0.75, 95% CI = 0.52–1.07; HbA_1c_-Q3: adjusted HR = 0.82, 95% CI = 0.55–1.21; HbA_1c_-Q4: adjusted HR = 1.06, 95% CI = 0.74–1.53). When considering HbA_1c_ as a continuous variable, an association between an increase in log2(HbA_1c_) and increased risk of new BC events (Model 1, adjusted HR = 1.95 [95% CI = 0.92–4.12]) and distant recurrence (Model 1, adjusted HR = 2.50 [95% CI = 1.01–6.20]) was observed.
Table 2. Outcome estimates according to HbA_1c_ quartiles and log2(HbA_1c_) in the 2514 breast cancer patientsPerson-yearsNumber of eventsIncidence rate per 1000 person-years (95% CI)Crude hazard ratio (95% CI) (N = 2514)Model 1: Hazard ratio adjusted for confounders based on directed acyclic graph (95% CI)^a^ (N = 2448)Model 2: Adjusted hazard ratio (95% CI)^b^ (N = 2336) New breast cancer event Q1 (21–33 mmol/mol) (N = 649)37914912.93 (9.77–17.10)1 [Reference]1 [Reference]1 [Reference]Q2 (34–36 mmol/mol) (N = 794)45476414.08 (11.02–17.98)1.09 (0.75–1.58)1.09 (0.75–1.60)1.24 (0.83–1.86)Q3 (37–38 mmol/mol) (N = 485)25934617.74 (13.29–23.68)1.37 (0.92–2.05)1.35 (0.88–2.07)1.37 (0.87–2.15)Q4 ( \documentclass[12pt]{minimal} \usepackage{amsmath} \usepackage{wasysym} \usepackage{amsfonts} \usepackage{amssymb} \usepackage{amsbsy} \usepackage{mathrsfs} \usepackage{upgreek} \setlength{\oddsidemargin}{-69pt} \begin{document}$$\:\ge\:$$\end{document} 39 mmol/mol) (N=586)31957122.22 (17.61–28.04)1.72 (1.19–2.47)1.69 (1.13–2.54)1.82 (1.17–2.81)Total (N = 2514)14,126230^c^Per HbA_1c_ log2 increase2.28 (1.18–4.41)1.95 (0.92–4.12)1.86 (0.84–4.10) Distant recurrence Q13791277.12 (4.88–10.39)1 [Reference]1 [Reference]NAQ24547388.36 (6.08–11.49)1.18 (0.72–1.93)1.23 (0.75–2.04)NAQ325932610.03 (6.83–14.73)1.42 (0.83–2.44)1.53 (0.87–2.70)NAQ431954614.40 (10.78–19.22)2.04 (1.27–3.28)2.09 (1.23–3.56)NATotal14,126137^d^Per HbA_1c_ log2 increase2.93 (1.31–6.52)2.50 (1.01–6.20)NA All-cause mortality Q139875714.30 (11.03–18.53)1 [Reference]1 [Reference]1 [Reference]Q247876513.58 (10.65–17.31)0.95 (0.67–1.36)0.75 (0.52–1.07)0.81 (0.55–1.20)Q327235419.83 (15.19–25.89)1.41 (0.97–2.05)0.82 (0.55–1.21)0.79 (0.52–1.20)Q434159126.65 (21.70-32.73)1.88 (1.35–2.61)1.06 (0.74–1.53)1.10 (0.75–1.62)Total14,913267Per HbA_1c_ log2 increase2.85 (1.62–5.02)1.05 (0.51–2.17)0.96 (0.45–2.05)a: Adjusted for age, menopausal status, comorbidities, and body mass indexb: Adjusted for age, menopausal status, comorbidities, body mass index, estrogen receptor status, HER2 receptor status, histological grade, tumor size, lymph node metastases, histological classification, surgery, radiotherapy, and systemic treatment (endocrine therapy, chemotherapy, and anti-HER2 therapy)c: 195 breast cancer recurrences, 35 contralateral breast cancersd: 83 visceral metastases and 54 bone metastases
HRs for new BC events, distant recurrence, and all-cause mortality excluding patients with HbA_1c_ \documentclass[12pt]{minimal} \usepackage{amsmath} \usepackage{wasysym} \usepackage{amsfonts} \usepackage{amssymb} \usepackage{amsbsy} \usepackage{mathrsfs} \usepackage{upgreek} \setlength{\oddsidemargin}{-69pt} \begin{document}$$\:\ge\:$$\end{document} 48 mmol/mol are presented in Supplementary Table 2, where the increased risk of new BC events and distant recurrence in HbA_1c_-Q4 compared to HbA_1c_-Q1 is replicated– similar to Table 2’s results. In Supplementary Table 3, we present HRs for a new BC event, distant recurrence, and all-cause mortality using HbA_1c_ cut-off points according to the International Expert Committee and American Diabetes Association [22, 33]. The pre-diabetes groups (International Expert Committee: HbA_1c_=42–47 mmol/mol; American Diabetes Association: HbA_1c_=39–47 mmol/mol) had the highest risk of inferior BC prognosis, similar to results in Table 2 and Supplementary Table 2 [22, 33]. In the ER-stratified analyses, patients in HbA_1c_-Q4 had the highest risk of a new BC event regardless of ER status (Supplementary Table 4).
In Supplementary Figs. 2 and 3, we present BMI-stratified cumulative BC event and all-cause mortality incidences according to HbA_1c_ quartiles. For patients with normal weight, we observed the highest BC event and mortality incidences in HbA_1c_-Q4 compared to other quartiles. Similar results were observed in patients with obesity, but not overweight. In Supplementary Table 5, we report estimated HRs across HbA_1c_ quartiles in BMI groups. We saw a tendency of increased risk of new BC events with increasing HbA_1c_ quartiles in patients with normal weight or obesity. Increasing HbA_1c_ quartiles were not associated with mortality across BMI groups.
Discussion
In BC patients without diabetes at baseline, we found an escalating risk of new BC events (recurrence or contralateral BC) with increasing HbA_1c_ quartiles. In the highest quartile (HbA_1c_ \documentclass[12pt]{minimal} \usepackage{amsmath} \usepackage{wasysym} \usepackage{amsfonts} \usepackage{amssymb} \usepackage{amsbsy} \usepackage{mathrsfs} \usepackage{upgreek} \setlength{\oddsidemargin}{-69pt} \begin{document}$$\:\ge\:$$\end{document} 39 mmol/mol), patients had a 69% enhanced risk of a new BC event and twice the risk of distant recurrence compared with patients in the lowest HbA_1c_ quartile. However, elevated HbA_1c_ (HbA_1c_ \documentclass[12pt]{minimal} \usepackage{amsmath} \usepackage{wasysym} \usepackage{amsfonts} \usepackage{amssymb} \usepackage{amsbsy} \usepackage{mathrsfs} \usepackage{upgreek} \setlength{\oddsidemargin}{-69pt} \begin{document}$$\:\ge\:$$\end{document} 39 mmol/mol) was not independently related to an increased risk of all-cause mortality.
Previous literature has reported inconsistent findings on the relationship between HbA_1c_ and BC prognosis. In patients with diabetes at BC diagnosis, Laurberg et al. (N = 1978) and Boursi et al. (N = 1382) found no association between HbA_1c_ and overall survival [18, 19]. Similarly, Tobe et al. (N = 98) found no association with overall or distant metastasis-free survival [17]. For patients with mixed diabetes status (i.e., patients with or without diabetes), Erickson et al. [14] reported an increased risk of all-cause mortality and slightly increased risk of a new BC event (recurrence or new primary BC) for patients with HbA_1c_ ≥ 53 mmol/mol compared to HbA_1c_ < 48 mmol/mol in a cohort of 3003 BC patients. Similarly, Chang et al. [15] found an increased risk of BC-specific and all-cause mortality in BC patients with diabetes and HbA_1c_ > 75 mmol/mol compared to patients without diabetes (N = 2812). Conversely, no association between HbA_1c_ and overall survival was found by Jousheghany et al. [20] in patients with unknown diabetes status at BC diagnosis (N = 82). Two studies explored the relationship between HbA_1c_ and BC prognosis in patients without diabetes at enrolment [16, 21]. Yoo et al. [16] found a slightly increased risk of BC-specific mortality for patients with the highest HbA_1c_-quintile (39–46 mmol/mol) compared to the lowest quintile among 589,457 patients. The number of BC-specific mortalities and the precision of the estimate were low [16]. Conversely, Joshu et al. [21] found no association between HbA_1c_ and BC-specific mortality in 336 BC patients.
Direct comparison between our results and prior studies is challenging due to differences in study design, the timing of HbA_1c_ measurement, diverse endpoints, and exposure thresholds, and the inclusion/exclusion of patients with diabetes. As in the most comprehensive study on BC patients [14], we noted an increased risk of new BC events within the highest HbA_1c_ group, though no association with mortality was found. In contrast, Erickson et al. [14] incorporated patients with self-reported diabetes, and used HbA_1c_ \documentclass[12pt]{minimal} \usepackage{amsmath} \usepackage{wasysym} \usepackage{amsfonts} \usepackage{amssymb} \usepackage{amsbsy} \usepackage{mathrsfs} \usepackage{upgreek} \setlength{\oddsidemargin}{-69pt} \begin{document}$$\:\ge\:$$\end{document} 53 mmol/mol as the exposure threshold. Also, HbA_1c_ was measured in samples taken on average two years post-BC diagnosis [14]. Like Tobe et al. [17], Laurberg et al. [18], and Boursi et al. [19], we did not observe a link between HbA_1c_ and risk of all-cause mortality, but in contrast to our study, all three studies only included patients with diabetes. Contrary to Tobe et al. [17], we found an association between HbA_1c_ and distant recurrence risk. Comparing our results to Chang et al. [15] is problematic, since their exposure was HbA_1c_ levels in patients with diabetes, and patients without diabetes were the reference group. Yoo et al. [16] and Joshu et al. [21] included individuals without cancer at start, measuring HbA_1c_ before BC diagnosis, contrasting with our design. Furthermore, Yoo et al. [16] provided no information on the number of BC cases.
Our study is the first to report results on the association between HbA_1c_ at BC diagnosis and BC prognosis in patients without diabetes at baseline. The majority of studies on HbA_1c_ and BC prognosis have investigated HbA_1c_ synonymous with diabetes as exposure (HbA_1c_ \documentclass[12pt]{minimal} \usepackage{amsmath} \usepackage{wasysym} \usepackage{amsfonts} \usepackage{amssymb} \usepackage{amsbsy} \usepackage{mathrsfs} \usepackage{upgreek} \setlength{\oddsidemargin}{-69pt} \begin{document}$$\:\ge\:$$\end{document} 48 mmol/mol) [14, 15, 17, 20, 22]. Erickson et al. [14] questioned whether there was a threshold of glycemic status at which the risk of poor BC prognosis significantly increases. Our study indicates that HbA_1c_ in the non-diabetic range (HbA_1c_<48 mmol/mol) is associated with inferior prognosis in BC patients. Therefore, diabetes cut-off points for HbA_1c_ might be insufficient in BC, however, HbA_1c_ in the non-diabetic range may not affect mortality risk, as we saw no association between HbA_1c_-Q4 and all-cause mortality, opposite to Erickson et al. [14].
Our observed increased risk of new BC events and distant recurrences associated with HbA_1c_-Q4 could be attributed to several factors. In BC cell lines, high glucose induced BC cell invasion through epithelial-to-mesenchymal transition [12, 40, 41], a critical element in cancer metastasis [42]. This could explain the heightened risk of distant recurrence. Moreover, high glucose may increase the proliferation of BC cells, leading to larger tumors in HbA_1c_-Q4 [12, 41]. Additionally, elevated HbA_1c_ could suggest hyperinsulinemia and systemic inflammation, as these conditions are frequently observed in patients with type 2 diabetes [2, 43, 44]. Since hyperinsulinemia and systemic inflammation are associated with poor BC outcomes, they could account for the association between increased HbA_1c_ and unfavorable BC prognosis [8, 45, 46].
Our study may have clinical implications. HbA_1c_ within the non-diabetic range could be included in the clinical evaluation of the risk of new BC events. Furthermore, as high HbA_1c_ levels were associated with an increased risk of new BC events in patients with normal weight, HbA_1c_ levels may help identify patients who are not metabolically healthy to an extent that affects cancer prognosis even if the patient has a “healthy” BMI. Also, despite a lower precision of the estimate in patients with obesity, HbA_1c_ may be a relevant prognostic marker in this group, too. It should be noted that all BMI-stratified results have low precision due to few events.
Limitations
This study has certain limitations. Our cohort encompassed only those patients diagnosed and treated for BC at one institution, who agreed to participate [23]. We lack information on the number of patients who declined to donate blood to the biobank. Nevertheless, when comparing our cohort to the number of breast cancer patients registered in the annual reports by the DBCG [47], and seen at the BC surgery department at Aarhus University Hospital during our inclusion period, the participation rate exceeds 90%. This is our best estimate, but still, we cannot overlook potential selection issues. Additionally, there may be some misclassification at baseline among the patients included, considering the majority, but not all patients with diabetes in Denmark, are registered in the Danish Adult Diabetes Registry [48]. Furthermore, HbA_1c_ was only assessed once. Also, the blood samples were stored in the freezer for a median of 8.1 years, which could affect the reliability of the HbA1c measurements. However, according to Selvin et al., HbA_1c_ levels in long-term stored frozen whole blood samples correlate highly with measurements done before the storage of the samples [49, 50]. Lastly, the possibility of residual confounding, such as hyperinsulinemia and inflammation, cannot be excluded.
Conclusions
In BC patients without known diabetes, elevated HbA_1c_ levels (HbA_1c_ \documentclass[12pt]{minimal} \usepackage{amsmath} \usepackage{wasysym} \usepackage{amsfonts} \usepackage{amssymb} \usepackage{amsbsy} \usepackage{mathrsfs} \usepackage{upgreek} \setlength{\oddsidemargin}{-69pt} \begin{document}$$\:\ge\:$$\end{document} 39 mmol/mol) were associated with an increased risk of new BC events, but not with all-cause mortality. These findings imply that HbA_1c_ levels might have prognostic value for BC assessment, even in the non-diabetic range, thereby helping clinicians identify patients with a poorer BC prognosis. Consequently, these results also prompt the question of whether closer monitoring and treatment of pre-diabetic hyperglycemia could improve BC prognosis.
Electronic supplementary material
Below is the link to the electronic supplementary material.
Supplementary Material 1
The reference list from the paper itself. Each links out to its DOI / PubMed record.
- 1International Diabetes Federation. Facts & figures [Internet]. 2024 [cited 2024 Apr 15]. Available from: https://idf.org/about-diabetes/diabetes-facts-figures/
- 2World Health Organization. Obesity and overweight [Internet]. 2024 [cited 2024 Jan 9]. Available from: https://www.who.int/news-room/fact-sheets/detail/obesity-and-overweight
- 3National Cancer Institute. Obesity and Cancer [Internet]. 2024 [cited 2024 Mar 18]. Available from: https://www.cancer.gov/about-cancer/causes-prevention/risk/obesity/obesity-fact-sheet#r 23
- 4Sundhedsdatastyrelsen. National health registers [Internet]. [cited 2025 Feb 10]. Available from: https://english.sundhedsdatastyrelsen.dk/health-data-and-registers/national-health-registers
- 5Regionernes Kliniske Kvalitetsudviklingsprogram. In English [Internet]. 2022 [cited 2024 Apr 11]. Available from: https://www.rkkp.dk/in-english/
- 6Bio- and Genome Bank Denmark. Bio- and Genome Bank Denmark [Internet]. 2022 [cited 2024 Apr 11]. Available from: https://www.regioner.dk/rbgben
- 7SEBIA. CAPILLARYS 3 TERA TLA [Internet]. 2024 [cited 2024 Apr 9]. Available from: https://www.sebia.com/instruments/capillarys-3-tera-tla/
- 8Weir CB, Jan A. In: Stat Pearls, editor. BMI classification percentile and cut off points. Treasure Island (FL): Stat Pearls Publishing; 2023.31082114 · pubmed ↗