PSMG2 role in tumorigenesis and stemness mediated by protein accumulation, reticulum stress and autophagy
Asunción Espinosa-Sánchez, Elena Blanco-Alcaina, Amancio Carnero

TL;DR
This study shows that high PSMG2 levels in head and neck cancer are linked to poor outcomes and that reducing PSMG2 decreases cancer growth and stemness.
Contribution
The study reveals PSMG2's role in proteasome assembly, ER stress, and autophagy in cancer stemness and tumorigenesis.
Findings
High PSMG2 levels correlate with poor prognosis in head and neck cancer patients.
PSMG2 knockdown reduces tumor growth and stemness in HNSCC cell lines.
Reduced PSMG2 increases ER stress and activates autophagy and apoptosis.
Abstract
The analysis of the dedifferentiation process has suggested that differentiated tumor cells undergo transformation toward cancer stem cells, accompanied by an increase in resistance to current chemotherapeutic treatments. Head and neck cancer (HNSCC) is a tumor with a high incidence and bad prognosis, and it is necessary to identify genes with alterations that can be explored therapeutically. PSMG2 is a chaperone protein that forms a heterodimer with PSMG1 and promotes the assembly of the 20S proteasome. Here, we characterized the effect of PSMG2 downregulation on tumorigenesis and the dedifferentiation process in head and neck cancer cell lines. We observed that high PSMG2 levels are associated with poor prognosis and survival in patients with HNSCC. Knockdown of PSMG2 reduced proliferation in vitro and in vivo in HNSCC cell lines. Moreover, the downregulation of PSMG2 diminished…
Genes, proteins, chemicals, diseases, species, mutations and cell lines named across the full text — each resolved to its canonical identifier and authoritative record.
Click any figure to enlarge with its caption.
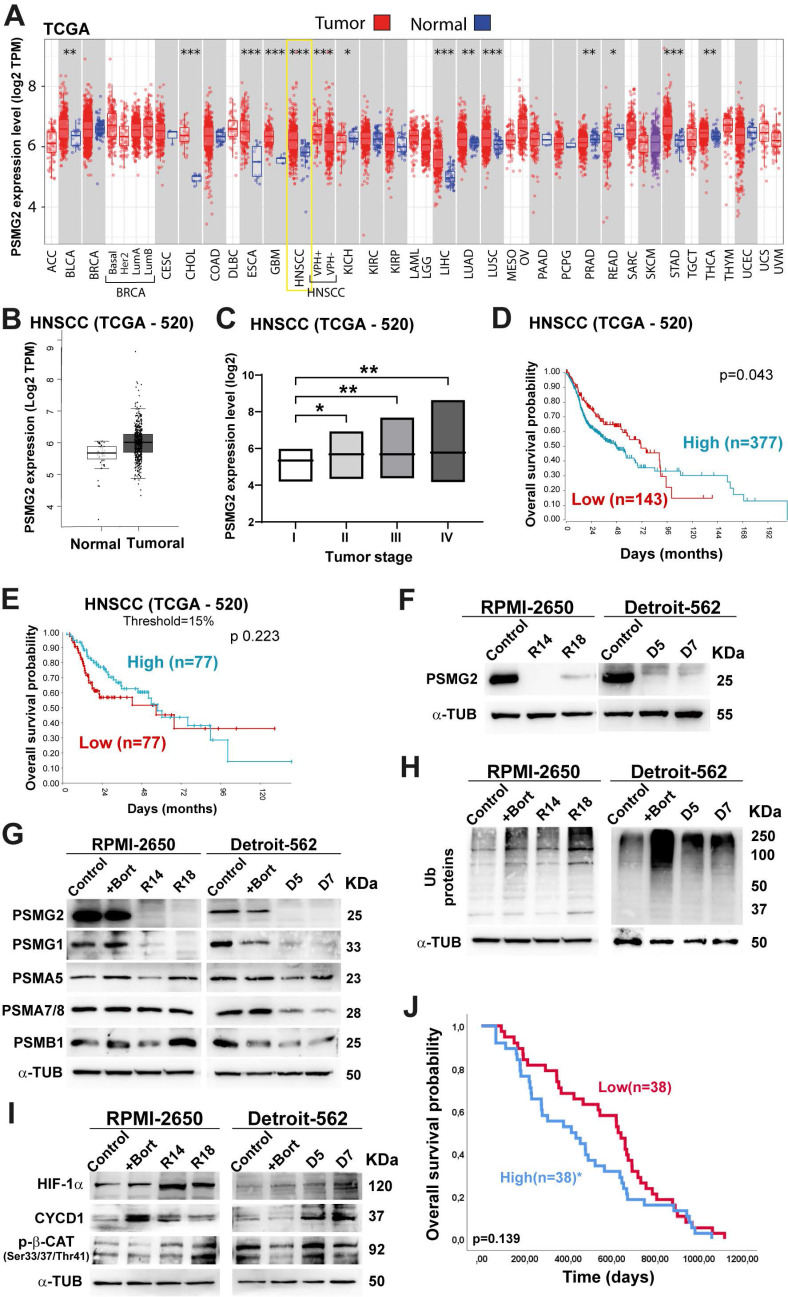 Figure 1
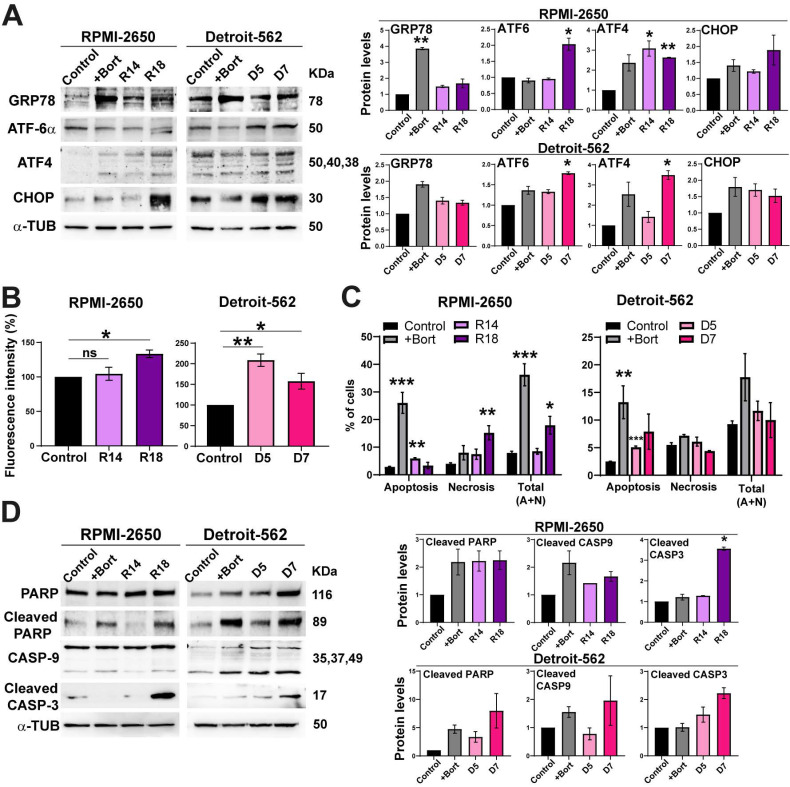 Figure 2
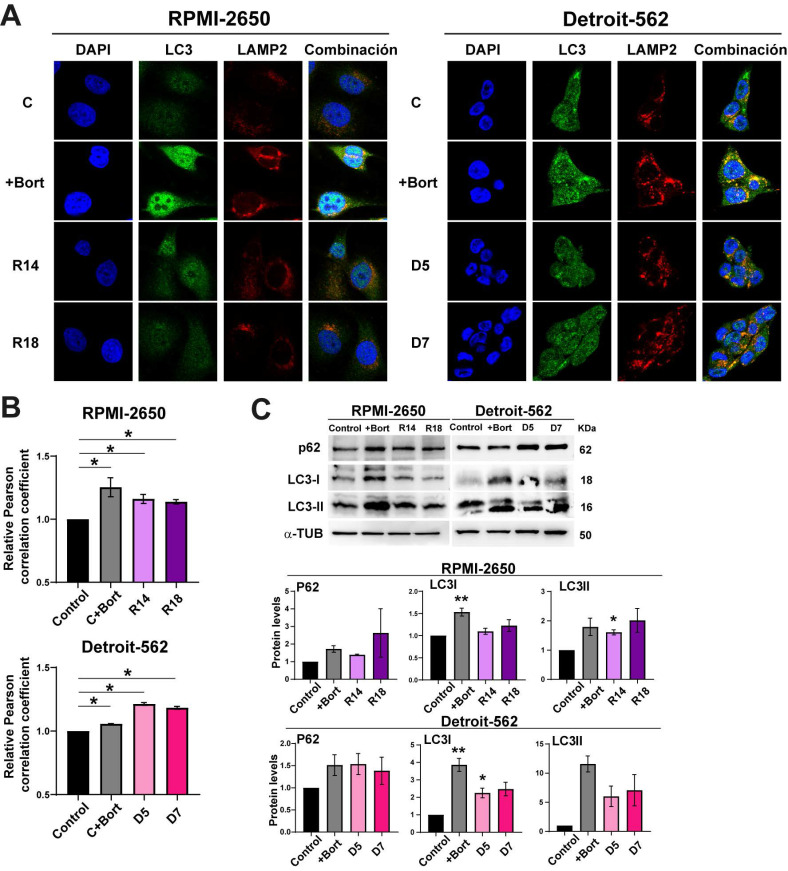 Figure 3
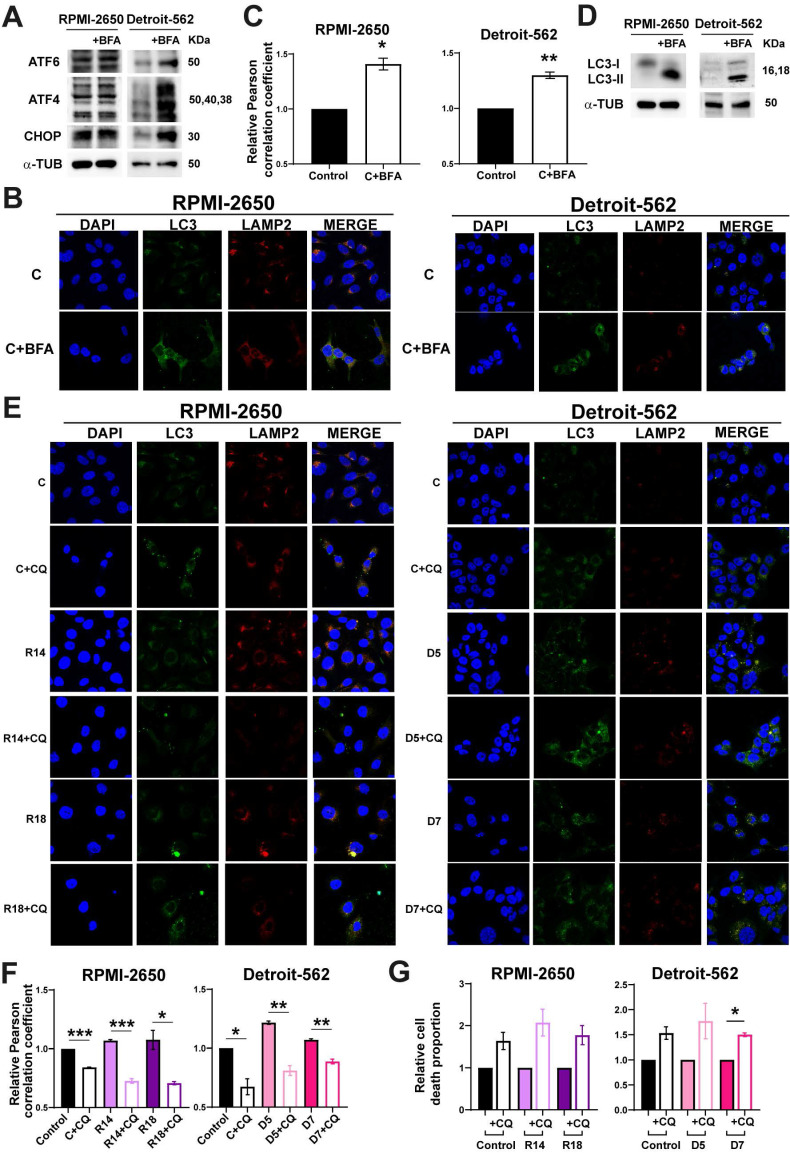 Figure 4
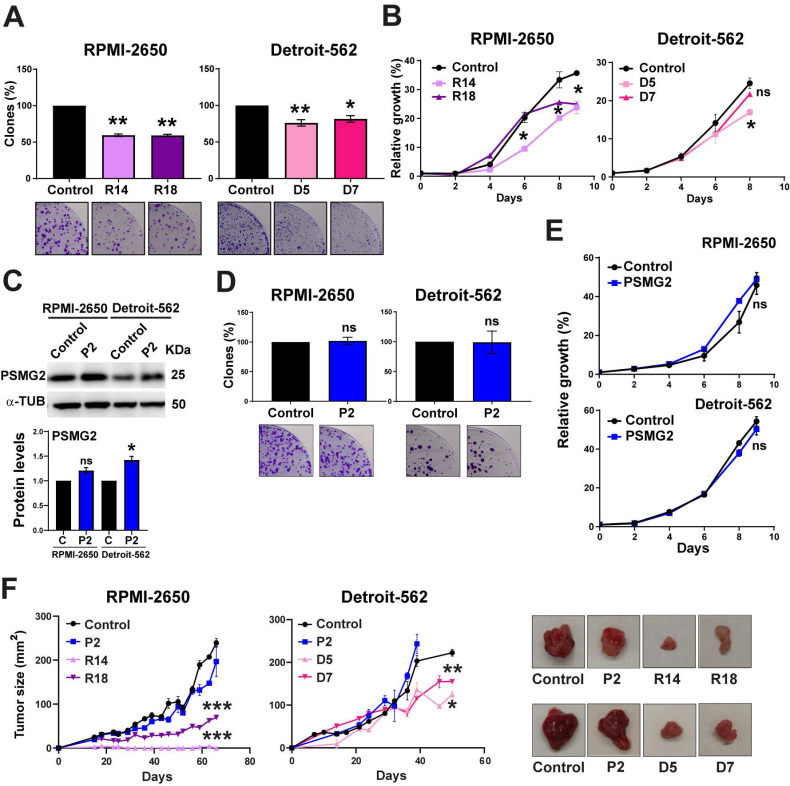 Figure 5
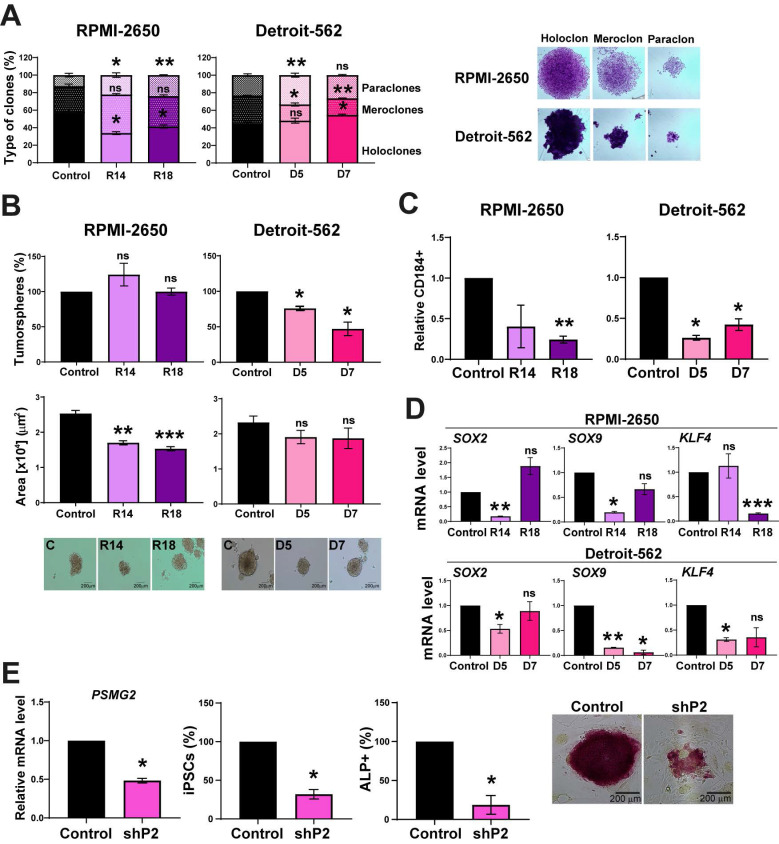 Figure 6
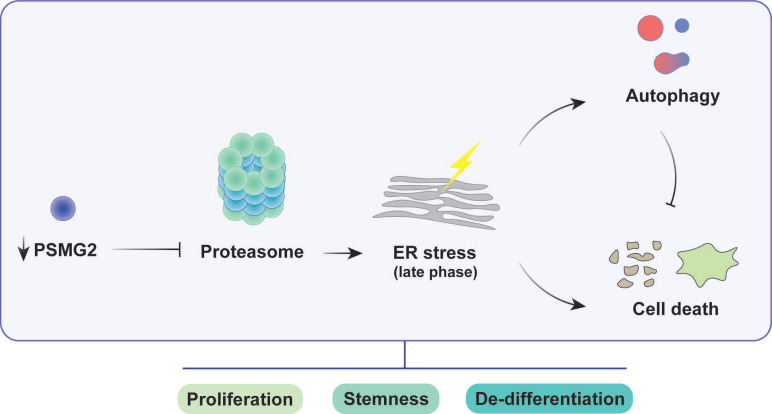 Figure 7
Peer Reviews
No public reviews on file for this paper yet. If you reviewed it on a platform where reviews are public (OpenReview, ICLR, NeurIPS, ICML), you can paste yours below so the community can read it here.
Videos
No videos yet. Explain this paper in a talk, walkthrough, or lecture? Add one.
Taxonomy
TopicsEndoplasmic Reticulum Stress and Disease · Peptidase Inhibition and Analysis · Autophagy in Disease and Therapy
Introduction
The dedifferentiation process or cellular plasticity is the process in which differentiated or somatic cells are converted into undifferentiated cells of their own lineage and develop self-renewal and pluripotency properties 1, 2. Numerous theories have been formulated to explain the appearance of cancer 3-5. The hierarchical model of cancer is based on cancer stem cells (CSCs), which show pluripotency and self-renewal properties. CSCs remain in the tumor indefinitely by self-renewal and differentiate into the different cell subtypes that form the tumor bulk 6. CSCs are responsible for the initiation, development and appearance of tumor recurrence and/or metastasis 3. Identification of the cellular dedifferentiation process has suggested that differentiated tumor cells, through the direct or indirect activation of oncogenic transcription factors, undergo a transformation toward CSCs, acquiring self-renewal and pluripotency properties 7-10. These signs of dedifferentiation are accompanied by an increase in resistance to current chemotherapeutic treatments 11, 12 and, in some cases, to radiotherapy 13, 14. Another important characteristic of CSCs is their ability to switch to a dormant or inactive state. CSCs can enter the G0 phase of the cell cycle (quiescent) 15, and since most of the current cancer therapies require a high rate of proliferation, G0-arrested cancer stem cells can escape these treatments. CSCs would be able to recover their most proliferative state when conditions are favorable and regenerate the tumor 16-20. Consequently, CSCs represent a problem in the therapeutic approach, being one of the main causes of tumor relapses. In recent years, studies have focused on the search for surface markers and transcriptional signatures specific to the cancer stem cell phenotype and mechanisms to eliminate these cells from the body.
Head and neck cancer (HNSCC) is the seventh most common tumor with the highest incidence worldwide. Approximately 1,000,000 new cases of HNSCC are diagnosed each year and are often diagnosed in advanced stages 21. Head and neck cancer comprises a group of tumors in different anatomical locations, including the oral cavity, tongue, pharynx, nasopharynx, oropharynx, hypopharynx, larynx, and salivary glands. The most common head and neck cancers originate in the mucosal epithelium of the oral cavity, pharynx, and larynx. Generally, cancers of the oral cavity and larynx are associated with tobacco consumption and alcohol abuse 22-25. Pharyngeal tumors are currently attributed to human papillomavirus (HPV) infection 26. Head and neck cancers can have a relatively poor prognosis due to several factors. They are detected at late stages, making it more difficult to treat and reducing the chances of a favorable outcome. They have a tendency to spread locally, increasing the risk of recurrence and making surgical removal of the tumor more challenging. Individuals with head and neck cancers are at an increased risk of developing second primary tumors in the head and neck region or other areas of the body. The occurrence of multiple primary tumors can complicate treatment and reduce overall survival rates. Finally, the treatment options available are currently very limited, mostly involving surgery and radiation therapy, and limited chemotherapy options limit the survival of patients. Therefore, it is necessary to explore the biology and pathology of these tumors to identify vulnerabilities that can be explored therapeutically.
PSMG2 is a chaperone protein that forms a heterodimer with PSMG1. This heterodimer promotes assembly of the 20S proteasome and prevents the dimerization of the α ring 27. The assembly of the 20S proteasome (core particle) is mediated by at least 5 extrinsic chaperones, PSMG1-4 and UMP1/POMP, in mammals 27. The process begins with the formation of the alpha ring supported by the complex of the heterodimeric chaperones PSMG1-PSMG2 and PSMG3-PSMG4 28-32. When the α ring is complete, the β subunits are incorporated onto it. This process is mediated by propeptides, the C-terminal group of β subunits and assembly chaperones. The order of incorporation of the β subunits is as follows: β2, β3, β4, β5, β6, β1 and β7 33-35. β2 recruitment is dependent on the UMP1 chaperone 34, 36. The PSMG3-PSMG4 complex dissociates from the α ring when β3 is incorporated. The dimerization of the 20S proteasome occurs after the incorporation of the last subunit, β7, forming a mature 20S subunit. Finally, the propeptides of the β-subunit and the heterodimer PSMG1-PSMG2 are cleaved and degrade UMP1/POMP 28, 37. The proteasome is a multienzymatic complex that maintains cellular homeostasis by degrading nonfunctional, misfolded, damaged and/or foreign proteins. The ubiquitin‒proteasome system (UPS) is the major quality control system in eukaryotic cells and is responsible for approximately 80-90% of protein degradation. The 26S proteasome is composed of a 20S core catalytic unit and two 19S regulatory units. The 19S regulatory units are responsible for recognizing and cleaving the ubiquitin chains, unfolding the proteins to be degraded and sending them to the central cavity of the 20S catalytic subunit to be degraded. The proteasome plays an essential role in many basic cellular processes, such as cell cycle progression, signal transduction, cell death, immune responses, protein processing and quality control 27.
We described here that high PSMG2 levels are associated with poor prognosis and survival in HNSCC. Moreover, the response to proteasome inhibitors could be altered according to the level of PSMG2. To explore the role of PSMG2 in tumorigenesis and the dedifferentiation process, we performed functional assays with the knockdown of PSMG2 in vitro and in vivo in two head and neck cancer cell lines. We focused on the alteration of proteasome activity when the level of PSMG2 was reduced and the activation of various mechanisms to maintain cellular homeostasis, such as endoplasmic reticulum stress, apoptosis and autophagy.
Results
Differential PSMG2 expression and prognostic implications in cancer
The TCGA database was employed to examine the differential expression of PSMG2 in normal adjacent tissues and tumor tissues across multiple cancer types. Our findings showed a significant increase in PSMG2 expression within tumor tissues compared to normal tissues in most cancers examined (Figure 1A; acronyms defined in File S1). Notably, head and neck cancer exhibited a particularly marked difference in PSMG2 expression (p<0.001) (Figure 1A-B). Moreover, PSMG2 expression exhibited a progressive increase with advancing tumor stage, demonstrating significant differences between stage I and the later stages (II, III, and IV) (Figure 1C). Kaplan-Meier survival analysis was performed on the HNSCC TCGA dataset based on PSMG2 expression. Overall survival appeared to be worse in tumors with high PSMG2 expression. This trend was observed not only in the entire patient cohort (Figure 1D) but also when focusing on the subgroups of patients with the top 15% highest and bottom 15% lowest PSMG2 expression levels, whose survival outcomes were specifically evaluated (Figure 1E). These data suggest that PSMG2 is frequently overexpressed in tumor tissues compared to normal tissues, especially in head and neck cancer, and may be linked to a poorer patient prognosis.
In consequence, we explored the potential effects of decreasing PSMG2 expression on the tumorigenic capabilities of the RPMI-2650 and Detroit-562 head and neck cancer cell lines.
The downregulation of PSMG2 inhibits proteasome activity
To study the effect of reduced PSMG2 expression on the tumorigenic properties of our HNSCC cell lines. First, we generated PSMG2 knockdown models using the CRISPR/Cas9 system. The clones R14 and R18 in RPMI-2650 cells and D5 and D7 in Detroit-562 cells were validated at the protein level by western blot analysis (Figure 1F) and the mRNA level by RT‒qPCR (Supplementary Figure S1A) and sequencing (Supplementary Figure S1B).
As PSMG2 is involved in the assembly of the 20S proteasome, we evaluated the alterations in this mechanism when PSMG2 expression is reduced. First, we observed that the PSMG1 protein level was diminished in the CRISPR PSMG2 cells compared to the control cells and the control cells treated with bortezomib (+Bort, an inhibitor of the proteasome) for both cell lines (Figure 1G). Moreover, PSMA5 and PSMA7/8 protein levels were reduced upon the downregulation of PSMG2 compared with those of the control cells of both cell lines (Figure 1G), as well as the protein level of PSMB1 in the Detroit-562 cells compared to the control cells (Figure 1G). Consequently, the level of ubiquitinated proteins increased in the CRISPR PSMG2 cells, as also observed in the controls treated with bortezomib in both cell lines (Figure 1H).
Additionally, we measured some target proteins that are degraded by the proteasome, such as HIF1α, CYCD1 and phospho-β-catenin. The levels of these proteins increased in the PSMG2- downregulated cells, as also observed in the controls treated with bortezomib in both cell lines (Figure 1I). These results showed that the downregulation of PSMG2 affects the assembly of the 20S proteasome and its activity, which triggers the accumulation of ubiquitinated proteins.
According to the relationship between PSMG2 and the proteasome, we studied the possible correlation between the response to proteasome inhibitor drugs and the expression level of PSMG2. The cytotoxic effects of several proteasome inhibitor drugs (bortezomib, ixazomib, and MG132), all of which target the 20S proteasome subunit, were evaluated in PSMG2 knockdown cells using IC50 cytotoxic assays. The Detroit-562 cell line, with low PSMG2 (CRISPR) cells were more sensitive to the drug effects than control cells (Supplementary Figure S2), however we did not observe variations in the RPMI-2650 cell line. Then, we analyzed the GSE9782 study which included patients with multiple myeloma in phases 2 and 3 treated with bortezomib. The survival of patients with high expression levels of PSMG2 was lower than that of patients with low expression levels of this gene (Figure 1J). These results suggest that the downregulation of PSMG2 could be a good prognostic and predictive biomarker for the response to treatment with proteasome inhibitor drugs.
However, due to the heterogeneity of HNSCC tumors, PSMG2 might be a good marker for the activity of proteasome inhibitors only in a subset of tumors, since only one cell line is more sensitive to proteasome inhibitors. Additionally, it can be a good marker in other tumors, such as multiple myeloma.
ER stress and apoptosis are activated when PSMG2 is downregulated
Inhibition of the proteasome causes an accumulation of proteins that triggers endoplasmic reticulum stress. The endoplasmic reticulum (ER) is responsible for making and modifying approximately one-third of cellular proteins 38. Stress in cells that affects this cell organelle disrupts protein processing and induces the unfolded protein response (UPR) 39. Glucose-regulated protein 78 (GRP78) binds to the hydrophobic domain of some proteins, located in the ER lumen, and protects against protein misfolding. In response to ER stress, GRP78 dissociates from these proteins, and different mechanisms are activated. ATF-6α is one of these proteins that is cleaved in the Golgi apparatus, translocates into the nucleus and activates gene transcription 40. Another of these proteins is PERK, which phosphorylates and activates the eI2F factor that activates ATF4 and the homologous protein C/EBP- (CHOP) 40. These proteins were analyzed to determine the existence of ER stress with PSMG2 downregulation. In both cell lines, we observed in general an increase in the protein levels of GRP78, ATF4, ATF-6α and CHOP in CRISPR clones and in the control cells treated with bortezomib compared to the control cells untreated (Figure 2A).
Moreover, ER stress can induce an increase in reactive oxygen species (ROS) 41. For this reason, we measured the fluorescence intensity of the carboxy-H2DCFDA molecule to detect alterations in the generation of ROS. The RPMI-2650 cell line showed a significant increase in fluorescence in clone R18 compared to the control (Figure 2B). In the Detroit-562 cell line, we observed a significant increase in the fluorescence intensity in both CRISPR clones (Figure 2B). These results indicate that the downregulation of PSMG2 causes ER stress and consequently increases the generation of reactive oxygen species (ROS).
When the cell cannot restore ER functionality, pathways such as apoptosis are triggered to eliminate damaged or dysfunctional cells 41. Cell death was analyzed using annexin V and propidium iodide markers by flow cytometry, allowing us to distinguish between apoptosis and necrosis. In both cell lines, we observed a significant increase in the percentage of apoptotic cells in the CRISPR clones (R14 and D5) and in the bortezomib-treated control cell line compared to the control cells. Regarding necrosis, the CRISPR clone R18 showed a significant increase in the percentage of necrotic cells (Figure 2C). Notably, the combined analysis of apoptosis and necrosis revealed an overall increase in cell death in the CRISPR clones compared to the control cells. In both cell lines, we observed an increase in cleaved PARP, CASP-9 and CASP-3 in CRISPR clones and in the bortezomib-treated controls (Figure 2D). These data suggest that the reduction in PSMG2 levels triggers an increase in apoptosis by increasing ER stress.
Low levels of PSMG2 increase cytoprotective autophagy
Inhibition of the proteasome causes apoptosis increasing ER stress, but also the activation of compensatory mechanisms to maintain cellular homeostasis. One of these processes is the lysosome-autophagy (ALP) degradation pathway, which is responsible for approximately 10-20% of protein degradation 42, 43. Effective autophagy requires fusion of the autophagosome with lysosomes; therefore, we analyzed autophagy using co-immunofluorescence staining of the autophagosome marker LC3 II and the lysosomal marker LAMP-2 (Figure 3A). We found that bortezomib treatment as a control induced autophagy in both cell lines (Figure 3A). As well, the downregulation of PSMG2 increased autophagy (Figure 3A). We measured the Pearson correlation coefficient of the colocalization of LC3 and LAMP2 using ImageJ JacoP software. We observed an increase in this coefficient in the CRISPR PSMG2 cells and bortezomib-treated controls in both cell lines compared to the controls (Figure 3B).
One of the proteins that connects the proteasome and autophagy is P62, which is a substrate for autophagy 42, 43. P62 (SQSTM1) can bind to ubiquitinated proteins to facilitate their degradation in the autophagosome. This process could limit the toxicity of undegraded proteins due to proteasome inhibition. Higher amounts of LC3-II correlate with an increase in the autophagy process. LC3-I is a substrate of the proteasome; therefore, the inhibition of the proteasome could cause the accumulation of this protein. Inhibition of the proteasome causes an increase in the phosphorylation of P62 at Ser405 and Ser409 and its transcription 44, 45. Therefore, we analyzed LC3 and P62 by Western blotting (Figure 3C). We observed that the protein levels of P62, LC3-I and LC3-II increased in the controls treated with bortezomib and in the CRISPR PSMG2 cells in both cell lines (Figure 3C). These results confirm the activation of autophagy in response to the downregulation of PSMG2.
Inducing ER stress in HNSCC cell lines caused the activation of autophagy and apoptosis
According to previous results, the reduction of PSMG2 caused an increase of apoptosis and autophagy process. To study whether these effects are caused by increases in ER stress, we treated cells with Brefeldin-A (BFA), an inductor of ER stress in parental cell lines, and TUDCA, an inhibitor of ER stress in control and CRISPRs of PSMG2.
First, RPMI-2650 and Detroit-562 cells were treated with Brefeldin-A to induce ER stress. We observed the treatment with Brefeldin-A (BFA) caused an increase of the proteins involved in ER stress (Figure 4A). Autophagy was analyzed by co-immunofluorescence and Western-blot. The co-localization of LC3 and LAMP2 proteins had a significative increase when cells were treated with BFA in both cell lines (Figure 4B-C). Furthermore, we observed an increase in the protein level of LC3 in cells treated with BFA compared to the controls in both cell lines (Figure 4D).
To study whether ER stress is the cause of cellular death observed when PSMG2 levels are reduced, we treated cells with TUDCA. We observed that control and CRISPRs of PSMG2 had a reduction in the percentage of apoptotic, necrotic and total cell death in RPMI-2650 and in apoptotic cells in Detroit-562 (Figure S3A). Total cell death refers to the combined percentages of both apoptosis and necrosis, highlighting the overall decrease in cell death when treated with TUDCA. On the other hand, we analyzed cell death in BFA-treated cells and observed that the induction of ER stress led to a higher proportion of apoptotic and necrotic cells (Fig. S3B). Additionally, cleaved PARP levels increased under these conditions in both cell lines (Fig. S3C). In turn, these results suggest that ER stress could be one of the causes of the increased apoptosis observed upon PSMG2 reduction. To test the relationship between autophagy and apoptosis process when proteasome was inhibited, we employed chloroquine (CQ), an inhibitor of autophagy process. The treatment with CQ caused the reduction of the co-localization of LC3 an LAMP2 in controls and CRISPRs of PSMG2 treated with CQ (Figure 4E-F). Cell death was studied by flow cytometry analyzing Annexin-V and propidium iodide markers to distinguish between apoptotic, necrotic and total cell death. We observed that both controls and PSMG2 CRISPRs treated with CQ increased the cell death (Figure 4G). These results suggest that autophagy in our model acts as a protective mechanism, mitigating cellular stress and enhancing cell survival.
Effect of PSMG2 downregulation on the tumorigenic properties of HNSCC cell lines
To study the effect of reduced PSMG2 expression on the tumorigenic properties of our HNSCC cell lines, we performed some functional assays, growth curve and clonability assay. We observed that the PSMG2 knockdown cells formed fewer colonies (Figure 5A) and grew slower than the control cells of both HNSCC cell lines (Figure 5B). On the other hand, we overexpressed the level of PSMG2. The overexpression PSMG2 was validated by Western-blot analysis (Figure 5C) and RT-q-PCR (Figure S4A). The overexpression of PSMG2 did not cause any alterations in the proliferation properties of RPMI-2650 and Detroit-562 cell lines (Figure 5D-E). The absence of effects on tumor properties upon overexpression of PSMG2 may be due to the saturated expression levels of PSMG2 in our cell lines. As shown in the bioinformatic analysis, tumors from patient samples exhibit elevated levels of this gene, suggesting that most head and neck cancer cell lines may already have saturated levels of PSMG2. Regarding the in vivo assays, it was shown that PSMG2 CRISPRs formed smaller tumors and grew more slowly than the control cells (Figure 5F). Overexpression of PSMG2, however, resulted in a similar behavior to the control cells (Figure 5F). These findings further support that reducing PSMG2 levels decreases the tumorigenic properties of HNSCC cell lines both in vitro and in vivo.
Effect of the reduction in PSMG2 levels on the stemness properties of HNSCC cell lines
PSMG2 forms part of the proteasome, which has been previously related to stemness 46-50. To explore the effect of the downregulation of PSMG2 on the stemness capability of the cells, we performed a clonability assay to measure the phenotypes of the clones as described in 51-53. We found that the PSMG2 CRISPR cells formed a lower percentage of holoclones (clones enriched in CSCs and able to regenerate the culture) and a higher percentage of paraclones (clones enriched in differentiated tumor cells and unable to regenerate the culture) compared to the control cells of both cell lines (Figure 6A). We also observed that the PSMG2-reduced cells formed smaller tumorspheres in the RPMI-2650 group and a lower number of tumorspheres in the Detroit-562 group (Figure 6B). In addition, we analyzed the positive cells for CD184, a CSCs surface marker. In previous results of the group, we validated the percentage of cells positive for some markers as CD44, CD166 in RPMI-2650 and Detroit-562 54. All the populations were positive to CD44 and CD166, so they could not be good markers for these cell lines 54. In addition, it was validated the effect of CD184 by in vivo assay and we observed that the tumors formed from CD10 +, CD184 + or CD166 + cells grew faster and more aggressively than the tumors formed from negative cells 54. Therefore, CD184 is a good marker related to cancer stem-like cells in our cell lines. Downregulated PSMG2 cells showed a lower percentage of CD184 positive cells in both cell lines (Figure 6C). These data confirm the functional role of PSMG2 and CSCs in HNSCC.
In cells with lower PSMG2 levels, the mRNA expression of some CSC markers, such as SOX2, SOX9 and* KLF4,* was downregulated (Figure 6D). These data indicate that the downregulation of PSMG2 reduces stemness in HNSCC cell lines, probably by reducing pluripotency transcription factors.
To study the role of PSMG2 in the dedifferentiation process, we transfected MEFs with 4 Yamanaka factors (OCT4, KLF4, SOX2 and* MYC*) and the shRNA scramble (control) or shRNA PSMG2 (shPSMG2) to analyze the possible alterations in reprogramming. We observed that the downregulation of PSMG2 caused a reduction in the number of iPS cells formed with shPSMG2 compared with the control (Figure 6E). Moreover, the number of alkaline phosphatase (ALP)-positive cells, a marker commonly used to identify induced pluripotent stem cells (iPSCs) as part of the reprogramming process from MEFs, was reduced in the shPSMG2 cells compared to the control cells (Figure 6E). This result suggests that PSMG2 is involved in the dedifferentiation process and that the reduction in the level of PSMG2 affects reprogramming MEFs.
On the other hand, the overexpression of PSMG2 did not cause alterations in the stemness properties of the RPMI-2650 and Detroit-562 cell lines (Figure S4), probably because the cells could have saturated expression of PSMG2 and proteasomal activity and, consequently, do not respond to further increases in PSMG2 levels.
Discussion
PSMG2 is involved in the assembly of the 20S proteasome, forming a heterodimer with PSMG1. The assembly process begins with the formation of the α ring supported by the complex of the heterodimeric chaperones PSMG1-PSMG2 and PSMG3-PSMG4 28-32. The exact mechanism of α ring assembly is unknown. The downregulation of PSMG3 and PSMG4 caused a reduction in α ring formation 29, 31. Moreover, the PSMG1-PSMG2 heterodimer acts only on the α ring and is responsible for preventing its dimerization, which could cause arrest in the biogenesis of the 20S proteasome subunit 27. This heterodimer interacts directly with the α5 and α7 subunits 28. The reduction in PSMG1 or PSMG2 caused the accumulation of α ring dimers 28. The proteasome is a cellular multienzymatic machinery responsible for the degradation of nonfunctional, misfolded, damaged and/or foreign proteins 27. The normal activity of the proteasome is very important in cells to maintain cellular homeostasis 27. It plays an essential role in numerous cellular processes, such as signal transduction, cell death, and protein quality control 27.
The differential expression of PSMG2 in various databases indicates that this gene is upregulated in tumors compared to normal tissue. Specifically, in HNSCC, PSMG2 is significantly overexpressed in tumor tissue, with its expression increasing as the tumor stage progresses and correlating with poorer overall survival, suggesting its potential oncogenic role. Consistent with this, downregulation of PSMG2 in the HNSCC cell lines RPMI-2650 and Detroit-562 led to a significant reduction in proliferation in vitro and tumor growth in vivo, further supporting its potential as a prognostic biomarker and therapeutic target for these tumors.
An extensive analysis of PSMG2 interactions was performed using the BioGRID and IntAct databases. Genes that were common to both databases were selected for subsequent functional analysis: Gene Ontology (GO) enrichment analysis (Figure S4C) and Reactome pathway analysis (Figure S4D). The results revealed that, as expected, the ubiquitin-proteasome system (UPS) was strongly associated, along with other processes such as the cell cycle, apoptosis, and NF-κB signaling.
To elucidate the potential mechanisms underlying PSMG2's oncogenic function, we studied its role in proteasome-mediated protein degradation. We observed a reduction in PSMG1 levels when PSMG2 was downregulated. The lack of one of these two proteins causes a reduction in the other, as they are not stable without forming a heterodimer. These proteins have a very short half-life, approximately 40 minutes 28. We also observed a reduction in the protein levels of α5 and α7 subunits (PSMA5 and PSMA7/8) in the downregulation of PSMG2. Most likely, the α ring cannot be formed correctly due to the lack of the PSMG1-PSMG2 heterodimer, and α ring dimers are generated without the ability to follow the assembly process 28. When the levels of PSMG2 were reduced, we observed an accumulation of ubiquitinated proteins, indicating that the proteasome was deficient and not fully functional and that the proteins could not be degraded when PSMG2 was downregulated. Previously, it had been reported that reduced PSMG1 levels also caused an increase in short-lived proteins such as p35 and HIF1α, accumulating mainly in their ubiquitinated form 55. Due to the spread spectrum of proteins that are degraded by the proteasome, a large number of cellular responses and signaling pathways are expected to be affected by its inhibition.
Inhibition of the proteasome has emerged as a potential cancer therapy by disrupting protein degradation, leading to cellular stress and apoptosis. While proteasome inhibitors have shown success in certain type of cancers, their effectiveness can be influenced by compensatory mechanisms such as autophagy and ER stress 56. Bortezomib was approved for the treatment of multiple myeloma. The GSE9782 study, which included multiple myeloma patients in phases 2 and 3 treated with bortezomib, allowed us to obtain a gene expression profile. The analysis of PSMG2 expression and response to treatment showed that patients with lower levels of PSMG2 treated with bortezomib had better survival than patients with high levels. Furthermore, the downregulation of PSMG2 caused an increase in chemosensitivity to treatment with bortezomib, ixazomib and MG-132 in at least one HNSCC cell line. These responses may be linked to the role of PSMG2 in the regulation of proteasome activity and cellular stress responses. The reduction of PSMG2 could disrupt these protective mechanisms, making cancer cells more vulnerable to therapeutic agents. Therefore, PSMG2 could be used as a prognostic and predictive marker of response to treatment with proteasome inhibitor drugs.
Inhibition of the proteasome exposes cells to endoplasmic reticulum (ER) stress by preventing the removal of misfolded proteins 56. Approximately one-third of all cellular proteins are synthesized and modified in the ER 38. Peptides are folded and acquire their tertiary conformation within the lumen of this organelle 38. Therefore, stimuli that disrupt the processing of these peptides can lead to an accumulation of misfolded or unfolded proteins, causing ER stress and inducing the unfolded protein response (UPR) 39. This mechanism is activated to restore ER activity and is characterized by increased degradation of misfolded proteins by the proteasome, decreased global protein synthesis, and transcriptional and protein upregulation of chaperones and foldases 57. In our results, we observed that proteins activated under ER stress, such as GRP78 and ATF-6, were increased in PSMG2-downregulated cells, confirming that ER stress was occurring. Moreover, the generation of reactive oxygen species (ROS) was increased when PSMG2 was reduced, confirming the increase in cellular stress. If this stress cannot be restored, escape pathways such as apoptosis are activated to re-establish cellular homeostasis 56. In our case, apoptosis was analyzed using both flow cytometry and Western blot showing that the reduction in PSMG2 increased apoptosis. Moreover, the employ of TUDCA, an inhibitor of ER stress, in our conditions reduced the death cells in RPMI-2650 suggesting that the activation of apoptosis is produced by the ER stress.
Proteasome inhibition also triggers activation of the lysosome-autophagy degradation pathway as a compensatory mechanism to diminish proteotoxic stress and avoid cell death 42. This activation could be produced by the induction of ER stress because of the treatment with BFA, an inductor of ER stress, in our HNSCC cell lines caused the activation of autophagy process. The p62 protein can act as a mediator signal between the UPS and autophagy. This molecule is responsible for transporting them to their corresponding degradation destination, the proteasome or autophagy 58. In our results, we observed an increase in P62, LC3-I and LC3-II protein levels when PSMG2 was reduced. Given that p62 is also degraded via autophagy, its accumulation suggests that while autophagy is active, the lysosomal degradation step may be compromised or overwhelmed due to the high protein load. This aligns with previous studies demonstrating that proteasomal inhibition triggers compensatory autophagy, which may not be sufficient to handle excessive protein accumulation. LC3-I is a substrate of the proteasome, which explains its accumulation. The colocalization of LC3 and LAMP2, which confirms the fusion of autophagosomes with lysosomes, was higher in the downregulation of PSMG2. However, despite this increased co-localization, the accumulation of LC3-II and p62 suggests that the final degradation step may be impaired or that the autophagic system is overloaded and unable to clear all accumulated substrates efficiently. This behavior is also observed with bortezomib treatment, reinforcing the idea that proteasomal inhibition by downregulation PSMG2 triggers a compensatory but possibly insufficient autophagic response. The relationship between autophagy and cell death was examined through chloroquine treatment to determine whether these mechanisms are interconnected or occur independently. In our model, inhibition of autophagy resulted in a significant increase in cell death, indicating that autophagy acts as a protective mechanism under these conditions.
In terms of stem cell properties, we observed that the downregulation of PSMG2 decreases stemness. In addition, we observed a lower number of positive cells for the markers CD184. CD184 marker has previously been proposed as markers of CSCs in HNSCC 54, 59-61. The reduction in PSMG2 levels in MEFs caused a reduction in the efficiency of iPS formation, which could mean a partial inhibition of cell reprogramming. This result could be because the reduction in PSMG2 alters the activity of the proteasome, an essential mechanism that acts as a regulator of pluripotency 46-50, 62-66. In mESCs, the activity of the proteasome was produced via tissue-specific transcription factors and/or RNA polymerase II to inhibit the transcription of these targets. The inhibition of the proteasome or the silencing of proteasome subunits improved the binding of specific transcription factors and activated RNA polymerase II to start the differentiation process 49. Furthermore, the 20S proteasome plays a crucial role in degrading proteins and regulatory complexes involved in the maintenance of transcriptional elongation. This finding suggests that the proteasome acts as a transcriptional silencer in mESCs to preserve pluripotency 49. Silencing Psmd14/Rpn11, a deubiquitinating enzyme expressed in mESCs, decreases reprogramming efficiency and pluripotency, while its overexpression enhances the pluripotent state and inhibits differentiation 50. In hESCs, the proteasome could also play an essential role in regulating the dedifferentiation process. The expression of one crucial subunit, PSMD11/RPN6, is high in hESCs and iPSCs but decreases during cellular differentiation, resulting in a reduction in proteasome assembly and activity 67. Inhibition of the proteasome in pluripotent cells downregulates stemness-related genes (OCT4, SOX2, NANOG and c-MYC) and upregulates differentiation markers (FGF5 and GATA4) 67. Moreover, MG-132 treatment at low concentrations over a long period of time (3 and 14 days) 50 and specific proteasome inhibitors, such as UK101 and PK957, caused the inhibition of cellular reprogramming and induced the loss of self-renewal 68, which is consistent with our results.
Conclusions
The reduction in PSMG2 altered the activity of the proteasome, which was decreased. In the process of tumorigenesis, the inactivity of the proteasome induces ER stress due to the accumulation of misfolded and ubiquitinated proteins. ER stress activated ROS production and apoptosis. In addition, the inhibition of the proteasome generated an increase in autophagy as a compensatory mechanism to maintain cell homeostasis. Regarding stem cell properties, inhibition of the proteasome reduced the number of tumorspheres and the transcriptional expression of genes related to the stem cell phenotype, such as SOX2 and SOX9. This observed phenotype could be due to the involvement of the proteasome in the pluripotency and differentiation process. In addition, the reduction in PSMG2 caused low efficiency of the cellular reprogramming of MEFs. Therefore, the decrease in PSMG2 levels could inhibit the dedifferentiation process.
Materials and methods
Cell culture
RPMI-2650 and Detroit-562 cell lines were obtained from the ECACC commercial repository. No further authentication was conducted by the authors. Cells were negative for mycoplasma. RPMI-2650 and Detroit-562 cell lines were maintained in DMEM (Gibco) with 10% fetal bovine serum (FBS) (Gibco), penicillin, streptomycin and fungizone (Sigma). MEFs (mouse embryonic fibroblasts) were maintained in DMEM (Gibco) with 10% fetal bovine serum (FBS) (Gibco), penicillin and streptomycin (Sigma). Feeder layer (SNL) was maintained in DMEM (Gibco) with 15% fetal bovine serum (FBS) (Gibco), penicillin and streptomycin (Sigma).
Retroviral infection
Retroviral vectors and gene transfer were performed as previously described in 69.
CRISPR/Cas9 to generate PSMG2 knockout
An sgRNA targeting the PSMG2 sequence TTCCGGTACCTACTTACACC (exon 5) was used to generate knockout models from VectorBuilder (pLV[CRISPR]-hCas9:T2A:Puro-U6>hPSMG2[gRNA#6615]). First, we infected the cells with virus containing PSMG2-sgRNA and drug selection. Then, the cells were isolated by single-cell sorting by FACS Jazz (BD Biosciences) in 96-well plates. One month later, each well that grew was amplified and validated by western blot analysis. The selected CRISPRs were sequenced in the Genomics and Sequencing service at IBiS.
RT‒qPCR
Total RNA from cell lines was extracted and purified using the ReliaPrepTM RNA Tissue Miniprep System (Promega), and reverse transcription was performed with 3 µg of mRNA using the High Capacity cDNA Reverse Transcription kit (Life Technologies) according to the manufacturer's instructions. The PCR mixture (10 µL) contained 2 µL of the reverse transcriptase reaction product diluted 1:10, 2.5 µL of water, 5 µL of GoTaqR Probe qPCR Master Mix (Promega) and 0.5 µL of the appropriate TaqMan Assay (20X) (Applied Biosystems). We used the following probes: GAPDH (Hs03929097_g1) as an endogenous control, PSMG2 (Hs.PT.58.27209203.g), SOX2 (Hs01053049_s1), SOX9 (Hs01001343_g1) and KLF4 (Hs00358836_m1).
Protein isolation and Western blot analysis
Western blots were performed as previously described elsewhere. Membranes were incubated with the following primary antibodies: anti-PSMG2 (1:1000; Abcam, ab172909), anti-PSMG1 (1:2000; CSB-PA018921LA01HU), anti-PSMA7/8 (1:1000; Santa Cruz Biotechnologies, sc-166761), anti-PSMA5 (1:1000; Santa Cruz Biotechnologies, sc-137240), anti-PSMB1 (1:1000; Santa Cruz Biotechnologies, sc-374405), anti-ubiquitinated proteins (1:500; GeneTex, GTX128826), anti-HIF-1α (1:200; Cayman Chemical, 10006421), anti-CYCD1 (1:1000; Santa Cruz Biotechnologies, sc-8396), anti-phospho-β-catenin (1:1000; Cell signaling #9561), anti-ATF-6α (1:1000; Santa Cruz Biotechnologies, sc-166659), anti-ATF4 (1:1000; Santa Cruz Biotechnologies, sc-390063), anti-GRP78 (1:1000; Santa Cruz Biotechnologies, sc-13539), anti-CHOP (1:1000; Cell signaling #2895), anti-PARP (1:1000; Cell signaling #9532), anti-cleaved Caspase-3 (Asp175) (5A1E) (1:1000; Cell Signaling #9664), anti-Caspase-9 (1:1000; Cell Signaling #9502), anti-LC3B (1:1000; Abcam, ab48394), anti-SQSTM1/p62 (1:10000; Abcam, ab109012) and anti-α-tubulin (Sigma T9026) as a loading control. Horseradish peroxidase-labeled rabbit anti-mouse (Abcam ab97046) and goat anti-rabbit (Abcam ab97051) secondary antibodies were used. The proteins were detected using an ECL detection system (Amersham Biosciences) and a Bio-Rad ChemiDoc Touch.
Autophagy analyses
Cells were seeded onto glass coverslips, fixed with 4% paraformaldehyde for 20 minutes, and permeabilized with 0.5% Triton X-100 for 5 minutes. The coverslips were incubated with anti-LC3B (1 μg/mL; Abcam #ab48394) and anti-LAMP2 (1 μg/mL; Abcam #ab25631). Anti-rabbit Alexa Fluor 488 and anti-mouse Alexa Fluor 546 were used as secondary antibodies. The nuclei were counterstained with DAPI, and the slides were mounted with Prolong Gold Antifade (Life Technologies). The samples were visualized with a confocal ultraspectral microscope (Leica Stellaris 8) by sequential scanning of the emission channels. Autophagy was defined as colocalization of LAMP2 and LC3B. The mean intensity of the fluorescence was measured for a minimum of 200 cells per condition using ImageJ JaCoP Software. Statistical significance was calculated using Student's t test.
Measurement of ROS generation
To detect reactive oxygen species (ROS), we used the compound carboxy-H_2_DCFDA. This molecule is not fluorescent, but in the presence of ROS, it is oxidized by the peroxidase enzyme and becomes fluorescent green 70. First, cells were seeded in 96-well plates to 80% confluence the next day. At 24 hours, medium without phenol red with H_2_DCFDA was added to several wells, leaving control wells without this molecule. The samples were incubated for 15 minutes at 37 °C. Finally, fluorescence was measured at 10-minute intervals by a CLARIOstar microplate reader.
Apoptosis assay
To analyze the number of apoptotic cells, we employed the Annexin V FITC Apoptosis Detection Kit. A total of 1x10^6^ cells were trypsinized and resuspended in 200 μl of a mixture containing binding buffer (195 μl) and Annexin V (5 μl) and incubated for 15 minutes. After washing the cells with binding buffer, we suspended the cells in 100 µL of binding buffer (97.5 μl) and propidium iodide (2.5 μl). The cells were incubated for 5 minutes, and binding buffer was added. Finally, we analyzed the cells by FACS with a FACSCanto II cytometer (BD Biosciences). Experiments were repeated a minimum of three times independently in triplicate samples.
Growth curve
For measurement of the proliferative capacity, 2.5x10^3^ (RPMI-2650) or 8x10^3^ (Detroit-562) cells were seeded in 12-well plates in triplicate. At 24 h (Day 0), cells were fixed with 0.5% glutaraldehyde (Sigma), and every 48 h, a curve point was fixed up to 10 days. Once all the points were collected, plates were stained with 1% crystal violet (Sigma). Then, the violet crystal was dissolved in 20% acetic acid (AppliChem), and the relative number of cells was quantified by measuring the absorbance of the violet crystal at 595 nm by an absorbance reader (Bio-Rad). The values were represented referring to Day 0.
Clonogenic assay
For measurement of the ability of cells to form individual clones, 500 (RPMI-2650) or 5x10^3^ (Detroit-562) cells were plated in 10 cm plates in triplicate. Cells were fixed with 0.5% glutaraldehyde and stained with 1% crystal violet after 15 days. The number of colonies was counted, and types of clones were classified.
Tumorsphere assay
A total of 1×10^4^ (RPMI-2650) or 2×10^4^ (Detroit-562) cells were seeded in triplicate in 24-well ultralow attachment plates (Costar) containing 1 mL of MammoCult basal medium (Stem Cell Technologies) with 10% MammoCult proliferation supplement, 4 μg/mL heparin, 0.48 μg/mL hydrocortisone, penicillin and streptomycin. After 5-10 days, depending on the cell line, the number of primary tumorspheres formed was measured using an inverted microscope (Olympus IX-71).
Cytotoxic assay
A total of 1.5×10^4^ RPMI-2650 cells or 3×10^4^ Detroit-562 cells were seeded in 96-well plates. The cells were treated 24h later with different concentrations of the drugs: 1-0 μM Bortezomib, 10-0 μM ixazomib,10-0 μM MG132 and 1-0 μM Paclitaxel. After 96 h, the cells were stained with 0.5% crystal violet. Then, the violet crystal was solubilized in 20% acetic acid (Sigma) and quantified at 595 nm absorbance to measure the cell viability.
Fluorescence-activated cell sorting (FACS) analysis
For FACS analysis, 1x10^6^ cells were trypsinized and suspended in 100 µL of PBS containing 2% FBS and 5 mM EDTA. Cells were blocked with 10 µL of human blocking reagent (Miltenyi Biotec) for 10 min at 4 °C. Then, the cells were incubated with 2 µL of anti-CD184-PE (Miltenyi Biotec #130-117-690) for 30 min at 4 °C. After the cells were washed twice with PBS-FBS-EDTA, they were suspended in 500 µL of the same buffer and analyzed by FACS with the FACSCanto II cytometer (BD Biosciences). Experiments were repeated a minimum of three times independently in triplicate samples.
iPS generation assay
SNL cells and MEFs were used to generate iPS cells. First, PhoenixA cells were seeded in 10 cm diameter dishes and cultured for 24 hours. A retroviral infection of PhoenixA was performed with 80 μl PEI and 10 μg of one of the plasmids pMXs (Oct3/4, Sox2, Klf4, c-Myc and DsRed, this last one as a transfection control), followed by incubation for 20 hours. Lentiviral infection of HEK293-T cells was performed with 2 μg of pMD2G, 8 μg of psPAX2 and 10 µg of one of the following plasmids: pGreenZeo mNanog, control shRNA Plasmid-A (Santa Cruz Biotechnologies; sc-108060) and shRNA-PSMG2 (Santa Cruz Biotechnologies; sc-76033-SH). The mixture was incubated for 30 minutes and added dropwise to the cells. The sample was incubated for 24 hours. Medium from retrovirus- and lentivirus-producing cells was collected and filtered using a 0.45 µm acetate-cellulose filter. Polybrene was added to a final concentration of 4 µg/ml. Mixtures were made with different plasmids and added to MEFs previously seeded in a 6-well plate at 10^5^ cells per well. The cells were incubated for 24 hours, and the medium was changed. At 72 hours, 1700 infected MEFs were plated in 6-well plates containing a feeder layer of mitomycin-C-inactivated SNL cells (350,000 cells per plate). The next day, embryonic stem cell culture medium (ES medium) composed of DMEM with 15% FBS, 2 mM L-glutamine, 10^-4^ M nonessential amino acids, 10^-4^ M 2-mercaptoethanol, and 50 mg/ml penicillin and streptomycin solution were added to the wells. Eight days after the first iPS cell appeared, we performed the alkaline phosphatase assay. On Day 21, we counted Nanog-GFP-positive colonies under a fluorescence microscope.
Alkaline phosphatase assay (ALP)
We used the Alkaline phosphatase detection kit (Sigma), which contains two reagents: Fast Red Violet solution (FVR) (0.8 g/L stock) and naphthol AS-BI phosphate solution (4 mg/mL) in AMPD buffer (2 mol/L), pH 9.5. First, cells were fixed with paraformaldehyde in 4% PBS for 1 minute and rinsed with PBS-0.1% Tween. The mixture of reagents in the ratio 2 (FVR):1 (naphthol):1 (water) was added to the wells and incubated for 15 minutes in the dark. The cells were washed with PBS-0.1% Tween, and the pink colonies were observed under an inverted microscope.
Xenograft in nude mice
Tumorigenicity was assayed by the subcutaneous injection of 3×10^6^ RPMI-2650 cells or 2×10^6^ Detroit-562 cells into the right flanks of 4-week-old female athymic nude mice. Cells were suspended in 50 µL of Matrigel (Corning) prior to the injection. Animals were examined weekly until the tumor size was approximately 300 mm^3^, and mice were sacrificed. Tumors were extracted and stored at -80 °C. Tumor volume (mm^3^) was measured using calipers. All animal experiments were performed according to the experimental protocol approved by the IBIS and HUVR Institutional Animal Care and Use Committee (0309-N-15).
Public database analysis
The following public databases were employed in this article: TIMER 2.0 (http://timer.cistrome.org/) 71, GEPIA (http://gepia.cancer-pku.cn/) 72 and R2: Genomics Analysis and Visualization Platform (http:// r2.amc.nl), which were employed to gather information on tumors from HNSCC patients.
Interaction networks: BioGRID and IntAct
Interaction networks were constructed using the BioGRID and IntAct databases, along with the pandas packages to identify interactions with PSMG2. To visualize the networks, we employed the networkx and matplotlib packages in Python. Additionally, a Venn diagram was used to identify common protein interactions between the databases.
GO and reactome enrichment analysis
Gene Ontology (GO) and Reactome Pathway enrichment analyses were performed using Gene Ontology (GO) and Reactome Pathway enrichment analyses were performed using the gseapy package. In this study, we selected the biological process (BP) category for GO analysis. A significance threshold of adjusted p-value < 0.05 was applied. Enrichment results were visualized using bar plots generated with the ggplot2 library in R, representing the 10 most significant pathways.
Biocomputational analysis
To study the relationship between PSMG2 and the response to bortezomib, we analyzed the GSE9782 dataset. In this study, 188 patients received bortezomib as a treatment. The authors generated gene expression data during the course of American and international phases II and III clinical trials. The patients were classified based on relevant clinical variables, such as the days of tumor progression and the response to bortezomib. The MAS5.0-normalized data of the HG-U133A Affymetrix chip (GSE9782) were used in our study.
Statistical analysis
Statistical analyses of experiments were performed using GraphPad Prism (6.01 for Windows). Control samples and tested samples were compared using unpaired Student's t test or Student's t test with Welch's correction, as appropriate. Experiments were performed a minimum of three times independently and in triplicate samples. P values less than 0.05 were considered statistically significant and were represented according to the following classification: p <0.05 (), p <0.01 (), and p <0.001 ().
Supplementary Material
Supplementary figures.
The reference list from the paper itself. Each links out to its DOI / PubMed record.
- 1F Quail D, J. Taylor M, Postovit L-M Microenvironmental Regulation of Cancer Stem Cell Phenotypes. Current Stem Cell Research & Therapy 201271972162232958210.2174/157488812799859838 · doi ↗ · pubmed ↗
- 2Jopling C Boue S Belmonte JCI Dedifferentiation, transdifferentiation and reprogramming: three routes to regeneration Nature Reviews Molecular Cell Biology 20111279892125299710.1038/nrm 3043 · doi ↗ · pubmed ↗
- 3Hanahan D Weinberg RA Hallmarks of cancer: the next generation Cell 2011144646742137623010.1016/j.cell.2011.02.013 · doi ↗ · pubmed ↗
- 4Hahn WC Weinberg RA Rules for Making Human Tumor Cells New England Journal of Medicine 200234715936031243204710.1056/NEJ Mra 021902 · doi ↗ · pubmed ↗
- 5Nowell PC The Clonal Evolution of Tumor Cell Populations Science 197619423895984010.1126/science.959840 · doi ↗ · pubmed ↗
- 6Clarke MF Dick JE Dirks PB Eaves CJ Jamieson CHM Jones DL Cancer Stem Cells-Perspectives on Current Status and Future Directions: AACR Workshop on Cancer Stem Cells Cancer Res 2006669339441699034610.1158/0008-5472.CAN-06-3126 · doi ↗ · pubmed ↗
- 7Chaffer CL Brueckmann I Scheel C Kaestli AJ Wiggins PA Rodrigues LO Normal and neoplastic nonstem cells can spontaneously convert to a stem-like state Proc Natl Acad Sci U S A 2011108795052149868710.1073/pnas.1102454108 PMC 3093533 · doi ↗ · pubmed ↗
- 8Belgiovine C Chiodi I Mondello C Telomerase: cellular immortalization and neoplastic transformation. Multiple functions of a multifaceted complex Cytogenetic and Genome Research 2008122255621918869410.1159/000167811 · doi ↗ · pubmed ↗