Association between bone mineral density and lower back pain in the general United States population using the NHANES of 1999–2004
Yang Zhou, Chi Li, WangYing Dai, HongLin Teng, Yu Wang, MingYu Zhu, Jing Wang

TL;DR
This study finds a U-shaped relationship between bone mineral density and lower back pain in the U.S. population, suggesting both low and high BMD may increase LBP risk.
Contribution
The novel finding is the U-shaped association between bone mineral density and lower back pain, identified through a large population-based analysis.
Findings
A positive correlation was found between bone mineral density and lower back pain after controlling for covariates.
A U-shaped relationship was observed, with BMD values below and above 1.14 g/cm² associated with increased LBP risk.
Subgroup analyses confirmed the stability of the relationship between BMD and LBP.
Abstract
Lower back pain (LBP) is a prevalent health issue that has substantial effects on individuals and society. However, the association between bone mineral density (BMD) and LBP remains controversial. In this study we aimed to ascertain whether a relationship exists between BMD and LBP in the United States population. Data from the National Health and Nutrition Examination Survey (NHANES) spanning 1999–2004 were analyzed using a cross-sectional approach. BMD and LBP were assessed using multivariate logistic regression, smoothing curves, and generalized additive models. Subgroup analyses were also performed to ensure data stability and mitigate confounding factors. In this population-based study, the data of 107,570 adults were analyzed (mean age: 47.13 ± 18.38 years) and 36.74% of them had LBP. After controlling for all covariates, a positive correlation was established between BMD and…
Genes, proteins, chemicals, diseases, species, mutations and cell lines named across the full text — each resolved to its canonical identifier and authoritative record.
Click any figure to enlarge with its caption.
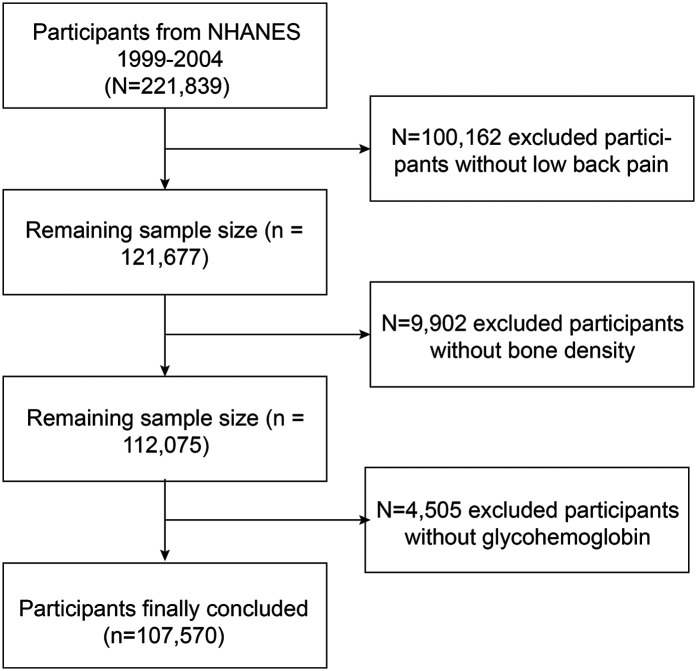 Figure 1
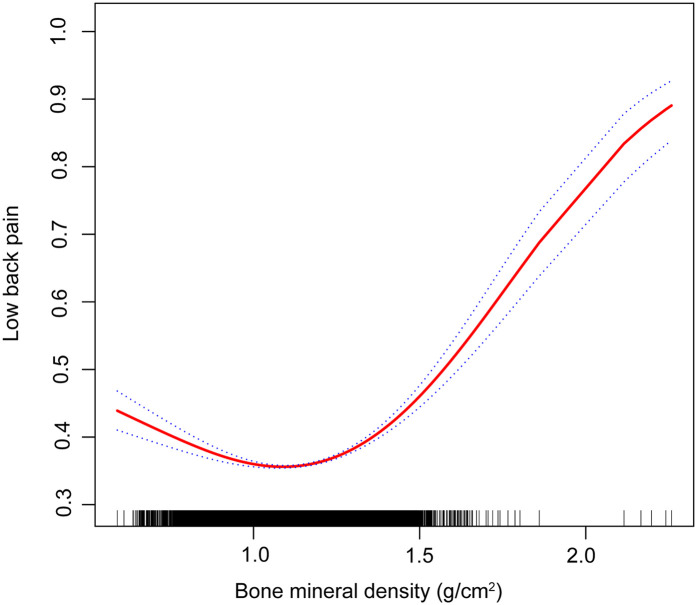 Figure 2
| Model | Low back pain (95% CI) | Adjusted analysis |
|---|---|---|
| Model 1 | 0.97 (0.62, 1.54) | 0.9243 |
| Model 2 | 1.39 (0.84, 2.41) | 0.2439 |
| Model 3 | 1.87 (1.00, 3.50) | 0.0470 |
| Characteristic | Low back pain | |||
|---|---|---|---|---|
| NO, | Yes, | |||
| Gender | ||||
| Male | 53.54 (52.14, 54.93) | 49.69 (47.61, 51.77) | <0.01 | 0.44 |
| Female | 46.46 (45.07, 47.86) | 50.31 (48.23, 52.39) | ||
| Age (years) | ||||
| <60 | 83.12 (81.83, 84.33) | 83.54 (81.80, 85.14) | 0.65 | 0.11 |
| >60 | 16.88 (15.67, 18.17) | 16.46 (14.86, 18.20) | ||
| Race (%) | ||||
| Mexican American | 6.01 (4.72, 7.63) | 5.37 (4.11, 6.99) | 0.04 | 0.39 |
| Other Hispanic | 5.00 (3.51, 7.07) | 5.83 (3.90, 8.62) | ||
| Non-Hispanic White | 74.84 (71.46, 77.95) | 76.76 (73.49, 79.74) | ||
| Non-Hispanic Black | 9.21 (7.61, 11.11) | 8.32 (6.63, 10.39) | ||
| Other race | 4.93 (3.90, 6.22) | 3.72 (2.73, 5.05) | ||
| Education (%) | ||||
| Less than high school | 13.03 (11.73, 14.44) | 17.02 (15.13, 19.09) | <0.01 | 0.42 |
| High school | 21.28 (19.50, 23.17) | 26.24 (23.53, 29.14) | ||
| More than high school | 65.57 (63.19, 67.86) | 56.70 (53.16, 60.17) | ||
| Not recorded | 0.13 (0.05, 0.33) | 0.05 (0.02, 0.11) | ||
| PIR (%) | ||||
| <1.3 | 14.02 (11.90, 16.45) | 17.97 (15.46, 20.78) | <0.01 | 0.72 |
| 1.3–3.5 | 29.47 (26.90, 32.17) | 33.37 (31.08, 35.75) | ||
| >3.5 | 49.75 (46.20, 53.31) | 42.21 (39.05, 45.43) | ||
| Not recorded | 6.76 (5.49, 8.30) | 6.46 (5.29, 7.86) | ||
| BMI (kg/m2) | ||||
| <18.5 | 1.73 (1.33, 2.26) | 1.72 (1.28, 2.30) | 0.04 | 0.18 |
| 18.5–25 | 36.89 (34.71, 39.13) | 33.53 (30.70, 36.49) | ||
| 25–30 | 35.48 (33.63, 37.38) | 35.79 (33.20, 38.47) | ||
| >30 | 25.21 (23.26, 27.28) | 28.37 (26.09, 30.75) | ||
| Smoke (%) | ||||
| Yes | 56.47 (53.89, 59.01) | 47.76 (43.78, 51.76) | <0.01 | 0.35 |
| No | 43.49 (40.95, 46.07) | 52.19 (48.21, 56.15) | ||
| Alcohol (%) | ||||
| Yes | 22.40 (18.46, 26.90) | 22.59 (18.46, 27.34) | 0.97 | 0.85 |
| No | 72.46 (68.09, 76.45) | 72.41 (67.87, 76.53) | ||
| Not recorded | 5.14 (4.22, 6.24) | 5.00 (3.72, 6.68) | ||
| Moderate PA in past 30 days | ||||
| Yes | 30.34 (27.97, 32.83) | 34.15 (31.02, 37.41) | <0.01 | 0.05 |
| No | 69.65 (67.16, 72.02) | 65.82 (62.56, 68.93) | ||
| Hyperlipidemia (%) | ||||
| Yes | 46.47 (43.79, 49.17) | 42.69 (40.55, 44.85) | <0.01 | 0.59 |
| No | 22.19 (20.39, 24.09) | 26.80 (24.66, 29.07) | ||
| Not recorded | 31.34 (28.25, 34.61) | 30.51 (27.78, 33.38) | ||
| Glycohemoglobin | 5.36 (5.32, 5.40) | 5.39 (5.35, 5.44) | 0.12 | |
| Low back pain | Adjusted OR (95% CI) | |
|---|---|---|
| Fitting by the standard linear model | 1.46 (1.30, 1.65) | <0.01 |
| Fitting by the two-piecewise linear model | ||
| Inflection point | 1.14 g/cm2 | |
| BMD < 1.14 g/cm2 | 0.55 (0.45, 0.68) | <0.01 |
| BMD ≥ 1.14 g/cm2 | 3.41 (2.83, 4.12) | <0.01 |
| P for Log-likelihood ratio | <0.01 | |
Peer Reviews
No public reviews on file for this paper yet. If you reviewed it on a platform where reviews are public (OpenReview, ICLR, NeurIPS, ICML), you can paste yours below so the community can read it here.
Videos
No videos yet. Explain this paper in a talk, walkthrough, or lecture? Add one.
Taxonomy
TopicsMusculoskeletal pain and rehabilitation · Bone health and osteoporosis research · Pregnancy-related medical research
Introduction
1
Defined as discomfort in the lower back, lumbosacral, and sacroiliac areas, lower back pain (LBP) frequently includes radiating pain in the lower limbs (1). It is a prevalent condition affecting approximately 84% of individuals during their lifetime (2). Globally, LBP poses substantial social and economic difficulties and causes extensive workplace absenteeism (3). LBP is estimated to incur annual costs of 100 billion (4). Given its widespread occurrence and substantial economic impact on healthcare systems, the implementation of early screening measures for LBP in populations at high risk using known risk factors, alongside the development of effective treatment protocols, is crucial.
Osteoporosis manifests as diminished bone mass and structural deterioration, leading to reduced skeletal stability and a higher probability of fracture (5). This condition in adults is defined as a bone mineral density (BMD) that is 2.5 standard deviations below their maximum bone density (6). Osteoporotic fractures, the primary complications of this disease, frequently occur in older adults and are associated with a significantly high mortality risk from major fractures (7, 8).
LBP is categorized into non-specific and specific types, depending on its origin. Prior research has pinpointed risk factors for nonspecific LBP, including sex, age, educational level, depression, seated posture, working hours, accidents, and genetic factors (9–11). Additionally, specific types of LBP may result from structural changes in the spine such as spinal stenosis, arthritis, disc degeneration, and kyphoscoliosis (12, 13). Despite numerous studies highlighting the risk factors for LBP, the role of osteoporosis as a contributing factor has often been ignored; however, it may be crucial.
Gaber et al. reported that small sample sizes showed a correlation between LBP and reduced bone density, indicating a potential risk of osteopenia (14). However, individuals with LBP may have higher lumbar BMD than those without, indicating a potential connection between issues such as rotational asymmetry or limited motion and increased bone density in the affected vertebrae (15). However, no consensus has been reached in the academic literature regarding the potential association between osteoporosis and LBP.
This study investigated the association between osteoporosis and LBP, using an extensive cross-sectional study derived from the National Health and Nutrition Examination Survey (NHANES) dataset.
Materials and methods
2
Study population
2.1
Owing to the limited data availability on LBP in recent years, supplementary data were collected from the NHANES iterations during 1999–2000, 2001–2002, and 2003–2004. A total of 221,839 individuals completed questionnaires on nutrition and health conditions and underwent health examinations. Only 107,570 participants were selected for inclusion in the study because of a lack of data on LBP (n = 100,162), BMD (n = 9,602), and glycohemoglobin levels (n = 4,505) (Figure 1). The database is now publicly accessible and authorized for researcher use, contingent on the acquisition of informed consent from all participants involved in the studies.
Flowchart of the participants selection from NHANES 1999–2004.
Association between bone mineral density and lower back pain (the solid red line represents the smooth curve fit between variables. Blue bands represent the 95% confidence interval from the fit).
Bone mineral density
2.2
The final analysis included dual-energy x-ray absorptiometry (DXA) examinations using Hologic QDR-4500A densitometers (Hologic, Marlborough, MA, USA) conducted by certified radiology technologists for all participants. Data were analyzed using Hologic APEX software (Hologic, Marlborough, MA, USA). Further information can be found on the NHANES website.
Lower back pain
2.3
Data on LBP was collected from participants aged ≥20 years who filled out pain questionnaires. Questions about LBP were answered based on the past 3 months. Furthermore, the pain was supposed to last a full day or longer and not just be mild or temporary. The specific survey questions were as follows: “During the past 3 months, did {you/SP} have LBP?” All the aforementioned data were processed as “not available” data because participants declined to respond, replied, “I do not know”, or were absent.
Other covariates
2.4
The covariates in our analysis were mostly classified into 3 categories: (1) Demographics: age, sex, racial/ethnic background (Mexican American, Other Hispanic, Non-Hispanic, Non-Hispanic Black people, Other race), family poverty-to-income ratio (PIR) (<1, 1–3, >3), and educational attainment (below high school, high school, above high school); (2) Medical conditions: Body mass index (BMI) (underweight if <18.5; normal weight if ≥18.5 and ≤24.9; overweight if ≥25 and ≤29.9; obese if ≥30), hyperlipidemia (whether or not the individual had been informed that their blood cholesterol level was high), glycohemoglobin; (3) Lifestyle variables included moderate physical activity over the past 30 days, alcohol consumption (individuals reporting the consumption of at least 12 alcoholic beverages per year), and smoking status (individuals reporting smoking at least 100 cigarettes over their lifetime).
Statistical analysis
2.5
Weights were produced for complicated sample designs using Mobile Examination Center (MEC) exam sampling weights, which were used to weigh all the data before analysis. Data with a weighting of zero were removed. Two-year sample MEC exam weights (WTMEC2YR) were used for data from the 2003–2004 cycle and four-year sample MEC exam weights (WTMEC4YR) were used for data from the 1999–2002 cycle. The weights were calculated using SDMVPSU and SDMVSTRA variables.
Categorical variables were presented as percentages, whereas continuous variables were described as means and standard deviations. The linear association between BMD and LBP was investigated using weighted multiple linear regression. Curve fitting and threshold effect analyses were used to determine the non-linear relationship between these variables. This research employed three distinct models: Model 1, without adjustment; Model 2, which included adjustments for age, sex, and race; and Model 3, which adjusted for all covariates, as detailed in Table 1. Additional subgroup analyses were also performed. To explore the non-linear dynamics between BMD and LBP, both a generalized additive model and a smoothing curve were applied. Upon detecting non-linearity, the inflection point was identified using a recursive algorithm, followed by the construction of separate binary linear regression models on either side of the point. The log-likelihood ratio test was used to evaluate the statistical significance of segmented logistic regression models. All analyses were performed using R software (version 4.0.3, available at https://www.R-project.org) and Empower Stats (version 6.0, available at https://www.empowerstats.com), with the significance threshold set at P < 0.05.
Results
3
Population characteristics
3.1
Table 2 presents the demographic profiles of the study participants. Among the adults surveyed, 36.74% reported experiencing LBP. These individuals had an average age of 47.13 ± 18.38 years, with men constituting 52.89% of the group. Typically, individuals with LBP tend to be women, predominantly non-Hispanic White people, with less education and lower PIRs. They also generally had higher BMIs, were nonsmokers, lacked hyperlipidemia, and engaged in moderate physical activity. Additionally, the age, drinking habits, and glycohemoglobin levels were similar between the two groups.
Association between BMD and LBP
3.2
The results of the multivariate regression analysis are presented in Table 1 and Figure 2. No significant relationship was observed between BMD and LBP in Models 1 and 2. After adjustment for all covariates, BMD was positively associated with LBP [1.8769 (1.005, 3.5024)]. As shown by smoothed curve fitting, BMD was associated with LBP with a U-shaped curve (P for Log-likelihood ratio <0.001, Table 3). A significant decline was observed in LBP risk with increasing BMD. The lowest incidence of LBP occurred at a BMD of 1.14 g/cm^2^, after which the trend in the curve was reversed. In the subgroup analyses, no significant interactions were noted among sex, age, race, education, hyperlipidemia, BMI, smoking, drinking, PIR, and physical activity.
Discussion
4
This study revealed that BMD was positively associated with LBP using data from the NHANES from between 1999 and 2004. In our cross-sectional study involving 107,570 participants, we observed a U-shaped relationship between BMD and LBP, with an inflection point at 1.14 g/cm^2^. When BMD was <1.14 g/cm^2^, a negative association was observed between elevated BMD and LBP. However, once the BMD levels surpassed 1.14 g/cm^2^, a positive association was detected between BMD and LBP.
A population-based cross-sectional study revealed that independent of factors such as age, education, and medical history, higher lumbar spine bone density correlated with increased LBP (16). Research involving Taiwanese adults found that LBP frequently accompanies osteoporosis, with elevated risks among women, those with lower educational levels, and individuals in blue-collar occupations (17). Manabe et al. noted a significant link between higher BMD and LBP among middle-aged women (18). Evidence suggests that patients with osteoporosis can experience back pain without fractures; however, treatments such as monthly ibandronate (19) and alendronate sodium (20) can alleviate pain. Nevertheless, the studies mentioned above have certain limitations. The sample sizes used in these investigations were not sufficiently large to ensure robust representativeness. Additionally, the studies did not account for a range of potential confounding variables such as age, sex, ethnicity, educational attainment, PIR, smoking habits, BMI, and BMD. These oversights might have undermined the reliability of the study outcomes.
LBP induced by osteoporosis is a complex, multifactorial issue.
Osteoporosis-induced LBP is associated with biomechanical alterations in the spine. Pan et al. determined that higher bone density in the lumbar facet joints may suggest increased stress on the joints and an uneven distribution of weight, possibly contributing to LBP (21). Andersen et al. found that patients with degenerative spondylolisthesis had lower spinal bone density than those with spinal stenosis, suggesting a possible connection between low BMD and the onset of degenerative spondylolisthesis (22).
An imbalance in bone metabolism is another possible cause of LBP in patients with osteoporosis. In addition to increasing bone resorption, reduced bone formation also increases fragility, making the spine more susceptible to stress and damage (23). Drugs, such as neridronate and alendronate, can alleviate LBP by improving bone density and reducing the bone turnover rate.
Disc herniation frequently emerges as the primary cause of back pain in patients with osteoporosis. This study corroborated previous findings linking higher BMD T-scores with increased spinal sclerosis in individuals experiencing LBP (24). Slowly progressive degenerative changes in the lower back impair the spine structure and functionality. Mechanical stress from spinal motion stimulates disc and facet joints, potentially leading to osteophyte development and endplate sclerosis. Additionally, microfractures contribute to a localized surge in bone turnover, enhancing trabecular density and reducing trabecular spacing (23, 26). These changes lead to increased bone density within the vertebral bodies, often marked by new osteophytes and endplate sclerosis (27). Recent findings indicate that higher bone density in the vertebral bodies correlates with intensified degeneration of the adjacent intervertebral discs. Research using micro-computed tomography has established a positive relationship between vertebral bone density and the severity of disc degeneration, which supports our conclusions (28). Consequently, while stiff vertebrae may subject neighboring discs to greater mechanical stress, osteoporotic vertebrae may offer some degree of protection against such degeneration (18).
During lumbar degeneration, the load distribution on the spinal functional unit is altered, resulting in greater pressure being placed on the intervertebral discs causing microfractures in the endplate. The nucleus pulposus material in the intervertebral disc penetrates these microfractures into the endplate, triggering local inflammatory reactions and ultimately leading to Modic changes (29). Significant differences exist in trabecular bone microstructure and bone remodeling indices among the different types of Modic changes. Modic type 1 changes exhibit higher bone turnover, likely due to inflammatory processes, whereas Modic type 2 changes are associated with reduced bone formation (30). Modic changes are associated with LBP. A cross-sectional study revealed that Modic type 1 changes are significantly associated with chronic LBP, with a higher frequency and severity of pain. In contrast, the relationship between Modic type 2 and 3 changes and the LBP is weaker (31). Other studies indicate that Modic type 1 changes are critical factors in patients with LBP, correlating with pain, functional deterioration, and unsuccessful return to work within 1 year. Among the 325 patients on sick leave owing to LBP, those with Modic type 1 changes reported more severe back pain and no improvement in pain or disability (32). We believe that Modic changes may be a pathway by which bone density influences LBP.
Our findings demonstrate a significant link between BMD and the occurrence of LBP. The data suggest that lower BMD is commonly associated with an increased incidence of LBP, which is consistent with prior studies that connect osteoporosis with such pain. In contrast, a higher BMD appears to increase the risk of developing LBP, likely due to degenerative alterations in the intervertebral discs and articular joints. Clinicians should consider incorporating measures of BMD into routine assessments for patients with or at risk of LBP. Future research should explore the underlying mechanisms linking BMD and LBP in more detail and evaluate the effectiveness of targeted interventions aimed at preventing and managing LBP. This could lead to the development of more effective, personalized treatment strategies that improve patient outcomes and reduce the burden of LBP on individuals and healthcare systems.
Our study had several limitations. First, the cross-sectional design prevented the establishment of causal links between bone BMD and LBP. Second, although numerous covariates were accounted for in the multivariate regression analysis, the possibility of residual confounding factors remained.
Conclusions
5
The results of this study revealed a non-linear relationship between BMD and the prevalence of LBP among adults in the United States, showing a notable threshold effect. The risk of LBP increases when BMD levels are either too low or too high. However, a deeper understanding of this relationship will significantly aid future research efforts.
The reference list from the paper itself. Each links out to its DOI / PubMed record.
- 1Zhu F Zhang M Wang D Hong Q Zeng C Chen W. Yoga compared to non-exercise or physical therapy exercise on pain, disability, and quality of life for patients with chronic low back pain: a systematic review and meta-analysis of randomized controlled trials. P Lo S One. (2020) 15(9):e 0238544. 10.1371/journal.pone.023854432870936 PMC 7462307 · doi ↗ · pubmed ↗
- 2Mu J Furlan AD Lam WY Hsu MY Ning Z Lao L. Acupuncture for chronic nonspecific low back pain. Cochrane Database Syst Rev. (2020) 12(12):Cd 013814. 10.1002/14651858.Cd 01381433306198 PMC 8095030 · doi ↗ · pubmed ↗
- 3Cui X Liang L Wang L Wang Z Li Y Gao Y Safety of Shujinjianyao pill in clinical real world: a prospective, observational, multicenter, large-sample study protocol. Medicine (Baltimore). (2019) 98(33):e 16853. 10.1097/md.000000000001685331415416 PMC 6831424 · doi ↗ · pubmed ↗
- 4Yao Y Zhou L Chen FQ Zhang R Pang XT Leng YF The effect and safety of thunder-fire moxibustion for low back pain: a meta-analysis of randomized controlled trials. Evid Based Complement Alternat Med. (2022) 2022:6114417. 10.1155/2022/611441735646143 PMC 9132655 · doi ↗ · pubmed ↗
- 5Tu Y Tang G Li L Ji R Tang R Wang S A preliminary study on degenerate characteristics of lumbar and abdominal muscles in middle-aged and elderly people with varying bone mass. BMC Musculoskelet Disord. (2023) 24(1):136. 10.1186/s 12891-023-06229-936810003 PMC 9942411 · doi ↗ · pubmed ↗
- 6Haseltine KN Chukir T Smith PJ Jacob JT Bilezikian JP Farooki A. Bone mineral density: clinical relevance and quantitative assessment. J Nucl Med. (2021) 62(4):446–54. 10.2967/jnumed.120.25618033310738 PMC 8049374 · doi ↗ · pubmed ↗
- 7Huntjens KM Kosar Svan Geel TA Geusens PP Willems P Kessels A Risk of subsequent fracture and mortality within 5 years after a non-vertebral fracture. Osteoporos Int. (2010) 21(12):2075–82. 10.1007/s 00198-010-1178-520162259 PMC 2974915 · doi ↗ · pubmed ↗
- 8Chau YT Nashi N Law LS Goh RKH Choo SX Seetharaman SK. Undertreatment of osteoporosis following hip fracture: a retrospective, observational study in Singapore. Arch Osteoporos. (2020) 15(1):141. 10.1007/s 11657-020-00816-232918196 · doi ↗ · pubmed ↗