Model-Based Characterization of the Metabolism of Recombinant Adeno-Associated Virus (rAAV) Production via Human Embryonic Kidney (HEK293) Cells
Somaiyeh Khodadadi Karimvand, Miroslava Cuperlovic-Culf, Amine A. Kamen, Miodrag Bolic

TL;DR
This paper develops a detailed metabolic model to understand and optimize the production of adeno-associated virus (AAV) using HEK293 cells.
Contribution
The novel contribution is a kinetic-metabolic model of AAV production that integrates multiple metabolic pathways and is validated with experimental data.
Findings
The model accurately represents metabolite profiles during AAV6 production in HEK293 cells.
Key metabolic parameters were identified as highly sensitive through global sensitivity analysis.
The model integrates glycolysis, TCA cycle, amino acid metabolism, and AAV-specific protein synthesis pathways.
Abstract
In this paper, we present a kinetic–metabolic model describing adeno-associated virus (AAV) production via HEK293 cells that encompasses the main metabolic pathways, namely, glycolysis, tricarboxylic acid cycle (TCA), pyruvate fates, the pentose phosphate pathway, anaplerotic reaction, amino acid metabolism, nucleotides synthesis, biomass synthesis, and the metabolic pathways of protein synthesis of the AAV (capsid and Rep proteins). For the modeling, Michaelis–Menten kinetics was assumed to define the metabolic model. A dataset from bioreactor cultures containing metabolite profiles of adeno-associated virus 6 (AAV6) production via triple transient transfection in a low-cell-density culture, including the concentration profiles of glutamine, glutamic acid, glucose, lactate, and ammonium, was utilized for fitting and computing the model parameters. The model that resulted from the…
Genes, proteins, chemicals, diseases, species, mutations and cell lines named across the full text — each resolved to its canonical identifier and authoritative record.
Click any figure to enlarge with its caption.
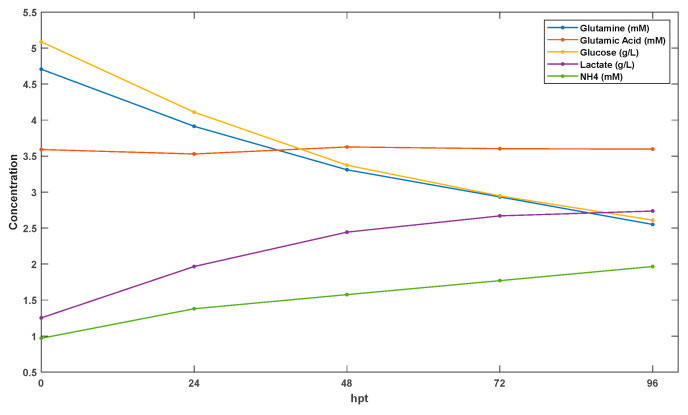 Figure 1
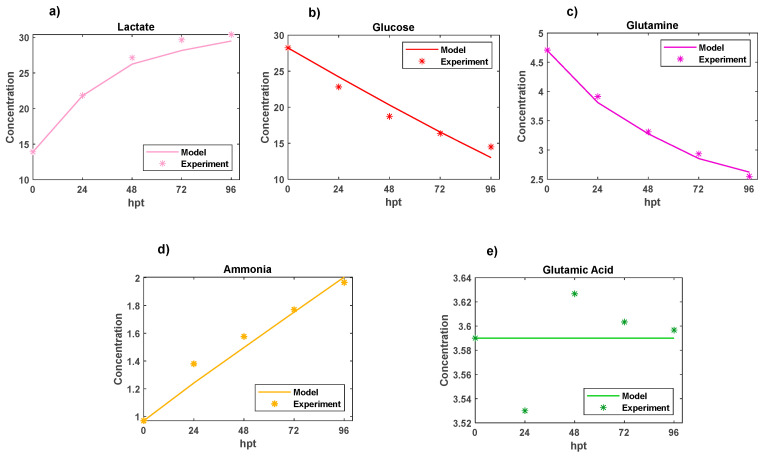 Figure 2
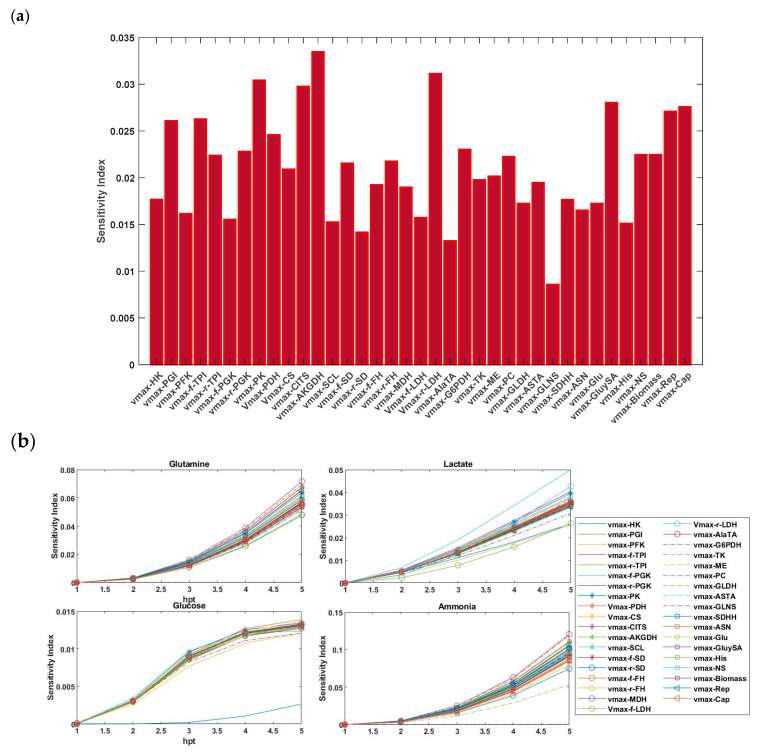 Figure 3
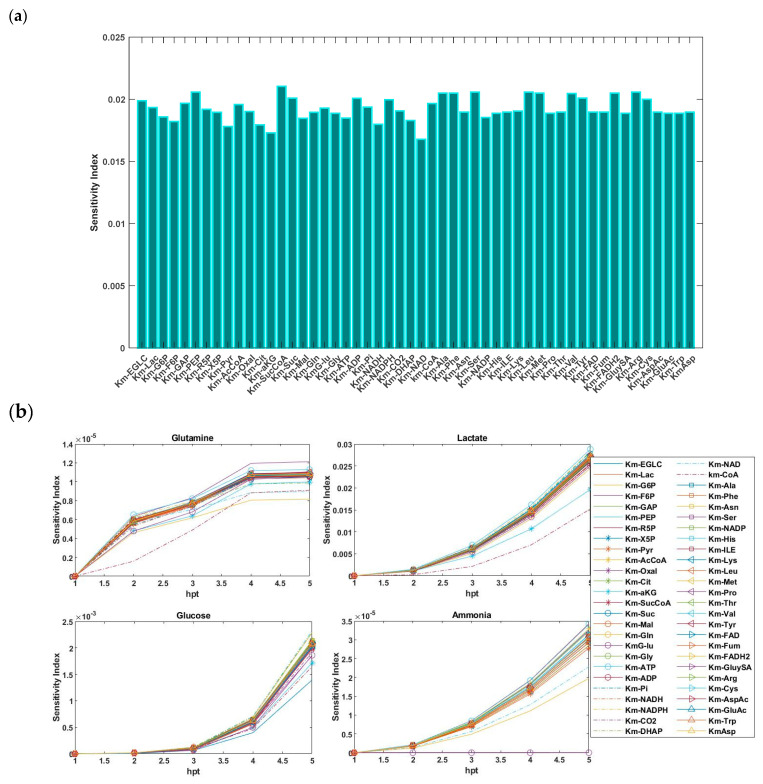 Figure 4
- —National Research Council Canada
Peer Reviews
No public reviews on file for this paper yet. If you reviewed it on a platform where reviews are public (OpenReview, ICLR, NeurIPS, ICML), you can paste yours below so the community can read it here.
Videos
No videos yet. Explain this paper in a talk, walkthrough, or lecture? Add one.
Taxonomy
TopicsViral Infectious Diseases and Gene Expression in Insects · Virus-based gene therapy research · CRISPR and Genetic Engineering
1. Introduction
Adeno-associated viruses (AAVs), which belong to the Parvoviridae family, are small single-stranded DNA viruses that are non-enveloped and inherently unable to replicate independently. Therefore, they need a helper virus (adenovirus or herpes simplex virus (HSV)) to provide the genes required for vector replication. The AAV is characterized by a small protein capsid that contains a single-stranded DNA genome. Due to their inability to generate disease, AAVs are excellent candidates for gene therapy [1]. Their high safety due to low toxicity, robust and long-term transgene expression, and the availability of viral serotypes have recently made recombinant adeno-associated virus (rAAV) vectors some of the most widely used outstanding choices for gene delivery vectors in the pre-clinical models of human disease. The increase in demand for gene therapy products has created the need to produce large quantities of rAAVs.
A mammalian cell culture platform, e.g., Chinese hamster ovary (CHO) cells and Human Embryonic Kidney 293 (HEK 293), has been successfully employed in the technology of industrial biopharmaceutical drugs through the advancements in their capability to express human proteins with proper processing. However, due to the lack of certain sugar-transferring enzymes, CHO cells cannot perform all types of human glycosylation [2]. Furthermore, by producing immunogenic glycan structures, CHO cells can increase the drug’s clearance and reduce the efficacy [3].
CHO cells naturally release virus-like particles (VLPs) into the culture medium. These VLPs must either be inactivated or eliminated from the final recombinant product during downstream processing (DSP). Thus, another significant limitation of CHO cells lies in their tendency to produce retroviral VLPs, which cannot be separated from AAV particles [4].
The most common cell lines used in the production of AAVs for preclinical and clinical studies are insect cells, mainly Spodoptera frugiperda (Sf9) cells, Henrietta Lacks (HeLa) cells, Baby Hamster Kidney (BHK) cells [5], and the transient transfection of HEK293 cells. Currently, HEK293 is known as the most extensively used human cell line for the transient transfection of rapid production of rAAVs. HEK293 cells are the preferred cell expression platform for rAAV production. Several metabolic network models have been reported in the literature for the HEK293 cell line. Abbate et al. recently presented a detailed model of HEK293 metabolism [6]. It should be noted that changes in the cell metabolism of HEK293 cells due to the transfection effect can change the rAAV viral vector production process.
Today, there is an urgent need to improve rAAV manufacturing to fulfill the high requirements of the viral vectors for preclinical/clinical studies. However, the transfection-based manufacturing of rAAV viral vectors remains challenging due to low yields of final production and a low fraction of full capsids in the harvesting step [7,8]. In other words, the main problem of rAAV production is the low yield of capsids containing a therapeutic element, which leads to high costs due to additional purification steps to remove empty particles. Consequently, increasing attention has been directed to optimizing the vector titer, purification of high-titer rAAVs, and increasing the productivity [4]. Thus, different strategies, such as chromatography modes, including size exclusion and ion exchange, were developed for AAV purification [9,10]. The increasing use of AAVs as a vector system is mostly due to the very efficient long-term expression of the therapeutic gene in terminally differentiated cells and the simplicity of the genome. Since an AAV requires a helper virus to replicate successfully in human cells, a significant change in the development of AAV design was the use of plasmids for rAAVs production, and the most common technique is the utilization of the triple transfection of HEK293 cells. Nguyen et al. 2021 presented a mechanistic model for synthesizing rAAV viral vectors by triple plasmid transfection in the biomanufacturing process [11].
Metabolic modeling is a powerful tool emerging as a promising alternative to the study, design, and quantitative evaluation of biological processes. Achieving such models requires the use of kinetic models to encapsulate their behavior. Indeed, mathematical kinetic modeling provides the optimal framework for characterizing the dynamic properties of mammalian cell culture [12,13,14].
Nowadays, developing in silico mathematical models to understand the mechanism of processes; predict the responses to various process inputs; and thus, minimize the time and cost of production optimization can be considered a promising tool. The mechanical models, developed based on chemical and biological principles, can help us understand the mechanisms and regulation of cell growth and production. However, due to the biological process’s complexity and our lack of knowledge, it is usually difficult to develop a completely accurate model.
To our knowledge, a detailed kinetic mechanistic model related to AAV production in the HEK293 cell line platform has not been reported yet. This study aimed to present a mechanical, mathematical model for the metabolic pathways of the rAAV viral vector production process within the HEK293 cell platform based on flux kinetic expressions. Indeed, a metabolic model framework based on flux kinetics was developed. The model was successfully validated by an experimental metabolic dataset of a bioreactor culture to optimize the model parameters. In what follows, the sensitivity analysis of the optimized parameters is performed to evaluate their impacts on the final quantity of production progress.
2. Theoretical Background
All data analysis tasks, including the model fitting and sensitivity analysis, were conducted using the MATLAB 2019b software environment.
2.1. Fitting Process
To obtain precise parameter constants, the kinetic process was fitted using the efficient, robust, and iterative non-linear regression algorithms known as Newton–Gauss–Levenberg/Marquardt (NGL/M) [15]. Herein, in the NGL/M algorithm, the non-linear parameters subjected to fitting were the K_m_ (metabolism constant), υ_max_ (maximum velocity), and C_0_ (initial concentration of an involved component) of the reaction mechanism defining the matrix of metabolite profiles. These parameters were refined to minimize the sum of the squares of the residual matrix. The non-linearity of the parameters arises from the inherent non-linear nature of the relationship between the parameters and the residuals.
In the iterative NGL/M algorithm, the process begins with an initial estimation of each parameter (p). The parameter vector is then refined by incorporating an appropriate parameter shift vector δp, leading to a more refined fit, although it may still not be perfect. This iterative process is repeated until the optimal solution is achieved [16].
The parameters of the model were fitted based on measured data by minimizing the sum of the mean squared error (SMSE) between the measured and estimated model output as follows:
where n is the number of data points, y_i_ is the experimental measured data, and ŷ_i_ is the corresponding predicted result.
The concentration profiles of all the involved species were modeled using a set of numerical ordinary differential equations (ODE solver) that describe the hard model of the corresponding biokinetic equations. Michaelis–Menten kinetics was employed to investigate the kinetic parameters and optimize the K_m_ and υ_max_ values.
2.2. Global Sensitivity Analysis
Sensitivity analysis (SA) is a critical step in identifying and prioritizing significant reactions and parameters, as well as examining how variations in input parameters impact the output of a system or model. This analysis facilitates a comprehensive understanding of the system’s sensitivity to changes in each input parameter. Its applicability extends across diverse fields, including engineering, environmental science, systems control, process optimization, chemical and reactor design, and cell biology.
These valuable mathematical tools hold significant importance in modeling and the assessment of risks associated with complex systems, categorically falling into three distinct types: screening methods, local sensitivity analysis methods, and global sensitivity analysis methods. Conventional local sensitivity methods typically rely on linear assumptions and encounter limitations when applied to nonlinear systems. In contrast, the more complicated global sensitivity methods may pose challenges due to time constraints.
Global sensitivity analysis (GSA) offers valuable insights into the robustness and reliability of a model or system, shedding light on the impact of design variables on its performance. Such information is valuable for informing optimization processes. The input parameters within a system encompass a range of factors, including physicochemical attributes, such as kinetic constants and thermodynamic equilibria, along with initial conditions and operating conditions. As physicochemical parameters are commonly derived from experimental measurements or theoretical calculations, inherent uncertainties often accompany these values. So, GSA played a crucial role in categorizing parameters according to their impact reduction. Furthermore, it facilitated the exclusion of parameters that had a minimal influence on the model sensitivity from the subsequent optimization cycle, thus maintaining them at their initial values [15].
Various types of global sensitivity analyses are available, including the weighted average of local sensitivity analysis, partial rank correlation coefficient, multiparametric sensitivity analysis, Fourier amplitude sensitivity analysis, and Sobol’s method. Among these methods, Sobol sensitivity analysis based on variance decomposition stands out as one of the most powerful techniques thus far [17].
Sobol introduced the variance-based method, along with its corresponding sensitivity concept, which relies on a high-dimensional model representation. This method breaks down the variance of the model output Y = f(X) = f (X1, X2, …, X_n_) into different terms (first order, second order, and higher orders), accounting for the input parameters and their interactions, as shown in the following multidimensional expression:
where f0, f_i_ (X_i_), and f_ij_ (X_i_, X_j_) represent the mean, first-order terms, and second-order terms of f(X), respectively, and X_i_ ϵ [0, 1]; i = 1, 2, …, n.
Several types of Sobol indices exist. However, calculating higher orders becomes unfeasible with a large number of input variables. The first-order sensitivity index (S_i_) quantifies the extent to which each uncertain parameter contributes to the variance in the model output:
Here, 𝔼 [Y⎸X_i_] represents the expected value of the output Y when parameter X_i_ is fixed and 𝕍 [Y] is the total variance of the response. A low sensitivity index for a parameter indicates that variations in that parameter result in relatively minor changes in the final model output. Conversely, a high sensitivity index for a parameter suggests that alterations to it cause significant shifts in the model output. Each S_i_ informs us about the anticipated reduction in the model’s variance when parameter X_i_ is held constant. It should be noted that the total of the first-order Sobol sensitivity indices cannot exceed one.
3. Methodology
3.1. The Mathematical Model
Mathematical models offer substantial potential for streamlining experimental processes, leading to cost savings and reduced time requirements for labor-intensive laboratory investigations. Additionally, they contribute to a deeper comprehension of the underlying mechanisms governing these processes. Metabolic flux analysis (MFA) has found extensive application in biotechnology for characterizing the state of cellular metabolism. This analysis relies on pseudo-steady-state mass balances around intracellular metabolites. The metabolic flux rate is determined by the substrate concentrations using Michaelis–Menten-type kinetics. The flux kinetic equation is formulated as follows:
Here, υ denotes the reaction rate or flux, υ_max_ represents the maximum reaction rate (attained when the enzyme is saturated with the substrate), [S] denotes the substrate concentration, and K_m_ is the Michaelis–Menten affinity constant. K_m_ signifies the substrate concentration at which the reaction rate is half of υ_max_.
3.2. Kinetic Model of the Bioprocesses
The primary aim of this research was to construct a model that accurately characterized the dynamics of AAV production within a bioreactor culture. In the current phase of model development, the HEK293 cell was treated as a single compartment, with no consideration given to intracellular sub-compartments, such as the mitochondria or the nucleus. The dynamic model comprised 32 reactions, incorporating a total of 89 kinetic parameters (K_m_ = 52, υ_max_ = 37). The network employed in this study is outlined in Table 1, which encompasses key metabolic pathways, namely, the glycolysis, tricarboxylic acid cycle (TCA), pyruvate fates, pentose phosphate pathway, anaplerotic reaction, amino acid metabolism, nucleotides synthesis, biomass synthesis, and the metabolic pathways of protein synthesis of the AAV (capsid and Rep proteins). The sequences of recombinant proteins were sourced from the National Institutes of Health (NIH). A total of fifty-three ordinary differential equations, which represented mass balances in the model, were considered.
4. Experimental Data Sets
In this study, we utilized a previously published dataset [18] to develop a metabolic model framework based on flux kinetics related to AAV production in the HEK293 cell line platform. This dataset includes metabolite profiles observed during the production of AAV6 in TubeSpin bioreactors under a low-cell-density culture (LCD: 1 × 10^6^ cells mL^−1^). At 24 h intervals, samples of the culture were collected and then subjected to centrifugation to separate the cellular components. The supernatant obtained after centrifugation was analyzed to quantify the levels of key nutrients and metabolites, including glutamine, glutamic acid, glucose, lactate, and ammonium. The data utilized in this study are presented in Figure 1. The initial concentration at time zero was known for these five species, while the fitting process required knowledge of the initial concentration for all the species. However, since such information was only available for five of the species, adjustments to the initial concentrations of the remaining species, as well as the model parameters, were made during the optimization iterations. Further details about this real-world example can be found in another source [18].
5. Results and Discussion
To optimize the AAV production, a suitable mathematical representation of the process was indispensable. The inherent complexity of even the simplest living cell means that any mathematical depiction serves as a rough approximation. Indeed, a mathematical model is inherently a simplification of system behavior. In the modeling realm, it is an accepted theory that a single set of data can be compatible with multiple models. In this study, adhering to Occam’s razor theory and acknowledging the limited available data, as well as the absence of initial information (such as the initial concentrations of all the involved components), we opted for a simpler model for the optimization of AAV production via HEK293 cells.
5.1. Model Optimization
To compute the parameters of the developed model, we employed the NGL/M parameter estimation procedure. The initial parameter estimates were derived from the literature. Given the large number of parameters in the model (142), we optimized them by fitting 2–10 parameters at a time while keeping the rest constant. This process was iteratively repeated, with the fitted parameters replaced by another group in each iteration. We continued this cycle until the fitted parameters no longer changed significantly, and the sum of the squared residuals reached its minimum value. The optimized kinetic parameters (K_m_, υ_max_), in addition to the initial composition and the concentrations (C_0_) in the bioreactor medium, are listed in Table 2 and Table 3 respectively.
In Figure 2, the calculated kinetic metabolite profiles are represented by lines, with experimentally measured data points indicated by star markers. The profiles obtained were well recovered, and the calculated and measured profiles generally exhibited good agreement, with the exception of the glutamic acid profile. The observed lack of a good fit was attributed to the absence of enough information regarding the profile of glutamic acid in the model. Specifically, this species has solely been considered in the construction of AAV proteins (Rep and Cap) within the model.
The total sum of the squares of residuals, denoting the differences between the real and modeled profiles, was 7.07 mM, with individual contributions as follows: ssq-Ammonia = 0.027 mM, ssq-Lactate = 0.268 mM, ssq-Glucose = 6.746 mM, ssq-Glutamic Acid = 0.005 mM, and ssq-Glutamine = 0.022 mM. The greatest ssq was associated with glucose, a result of its higher profile intensity compared with the other metabolites. Indeed, the higher intensity translated to a more significant impact on the sum of the squares of residuals (ssq), which contributed to a notable difference in the deviation.
5.2. Sensitivity Analysis
Given the complexity of the system, the model yielded a considerable number of parameters. Consequently, a Sobol-based global sensitivity analysis (SGSA) of the kinetic parameters was carried out to assess the model’s dependence on specific parameters over time. Considering that model inputs can encompass a wide range, including parameters K_m_ and υ_max_, global sensitivity analysis has emerged as an innovative approach for identifying which reactions and processes have the greatest significant impact on the behavior of the overall system.
For this, all parameters were simultaneously varied across the entire parameter space. Each parameter was defined to cover a specific finite range (specify the range including the lower and upper bounds for each), distributed uniformly. Then, a series of model outputs utilized the defined ODE model, which covered various ranges of parameter uncertainties, was generated. The model output was a random variable with a mean (f0) and total variance (𝕍). Finally, the Sobol method was employed to decompose 𝕍 into contributions from individual parameter effects (Equation (3)).
For the SGSA, we explored two alternative perspectives. First, the sensitivity results of 37 v_max_ and 52 K_m_ parameters of the system were computed and are presented in Figure 3a and Figure 4a, respectively. In Figure 3a, the results indicate that parameters v_max-PGI_, v_max-f-TPI_, v_max-PK_, v_max-CITS_, v_max-AKGDH_, v_max-r-LDH_, v_max-GluySA_, v_max-Rep_, and v_max-Cap_ were the primary contributors, where they explained approximately 26% of the variability in the model output. This was followed by the significant parameters v_max-r-TPI_, v_max-r-PGK_, v_max-PDH_, v_max-CS_, v_max-f-SD_, v_max-r-FH_, v_max-G6PDH_, v_max-PC_, v_max-NS_, and v_max-Biomass_, which collectively contributed an additional 22% of the variation. However, as seen in Figure 4a, the magnitudes of the sensitivity indices for all K_m_ parameters were slightly varied but remained approximately close to each other.
Next, we investigated the relative influence of the uncertainty in these parameters (v_max_, K_m_) on the output concentrations of glutamine, glucose, lactate, and ammonium. Indeed, the sensitivity index reflected the influence of each parameter on the output at the specified time. For each profile concentration output, the importance of the parameters was ranked (Figure 3b and Figure 4b). Due to the absence of enough information regarding the profile of glutamic acid in the model, this component was neglected. It was observed that the sensitivity indices, and consequently, the degree of importance of the parameters, varied for each profile.
Our study provides an initial investigation into metabolic pathways associated with rAAV vector production. Using a simplified model, we identified pathways that could inform future studies. Given the inherent complexity and variability of biological systems, fully comprehensive models remain challenging to develop. However, simplified models can still offer valuable insights by approximating system behaviour [19].
We recognize that the proposed model, constrained by the available dataset, does not fully capture the complexity of rAAV production. However, the extracted parameters provide useful insights and indicate a degree of predictive potential for rAAV yields. While not comprehensive, this model offers a foundation for refining future models and informing metabolic engineering strategies to address challenges in large-scale rAAV manufacturing.
6. Conclusions
In this paper, we propose a metabolic behavior model for AAV production in an HEK293 cell line culture. The model, describing metabolic network flux kinetics, was calibrated to estimate key parameters. We utilized a measured dataset that contained five metabolite profiles from the production of adeno-associated virus 6 via triple transient transfection in a low-cell-density culture. These profiles included concentrations of glutamine (mM), glutamic acid, glucose, lactate, and ammonium. The model was applied to the experimental dataset, which allowed for the extraction of key parameters. Additionally, a Sobol-based global sensitivity analysis was conducted to identify and assess the most sensitive parameters of the model. As expected in such a complex system, multiple critical parameters exhibited interdependencies and varied with external conditions.
While this approach provides a structured framework for studying metabolic behaviors in AAV production, the findings should be interpreted with caution due to the limited dataset used for the model calibration. Expanding the dataset with more diverse conditions and additional validation experiments would be necessary to further assess the model’s reliability and general applicability. Despite these limitations, the model offers preliminary insights into key metabolic processes in HEK293 cells, which could support future efforts to optimize AAV production.
7. Limitations and Future Work
While incorporating additional datasets would provide a more comprehensive understanding of metabolic pathways in rAAV vector production, the present study was limited by constraints in experimental facilities and sample collection. As a result, the findings should be interpreted within the context of the specific dataset used.
To improve the model’s applicability, further optimization of different datasets is necessary. Although the model describes metabolic behaviors within the given dataset, its parameters may not be directly transferable to other conditions without recalibration. Variations in culture conditions, measurement techniques, and experimental setups could impact model predictions, requiring additional validation.
Given these limitations, the model should be considered an initial step toward understanding metabolic dynamics in rAAV production rather than a definitive predictive tool. Future work will focus on expanding the dataset, refining the parameter estimation, and validating the model across different production environments to enhance its robustness and generalizability.
The reference list from the paper itself. Each links out to its DOI / PubMed record.
- 1Finer M. Glorioso J. A brief account of viral vectors and their promise for gene therapy Gene Ther.2017241210.1038/gt.2016.7128123184 · doi ↗ · pubmed ↗
- 2Grabenhorst E. Schlenke P. Pohl S. Nimtz M. Conradt H.S. Genetic engineering of recombinant glycoproteins and the glycosylation pathway in mammalian host cells Glycotechnology Springer Boston, MA, USA 199911710.1023/a:102646640804210612409 · doi ↗ · pubmed ↗
- 3Giorgetti S.I. Etcheverrigaray M. Terry F. Martin W. De Groot A.S. Ceaglio N. Oggero M. Mufarrege E.F. Development of highly stable and de-immunized versions of recombinant alpha interferon: Promising candidates for the treatment of chronic and emerging viral diseases Clin. Immunol.202123310888810.1016/j.clim.2021.10888834798238 PMC 8595249 · doi ↗ · pubmed ↗
- 4Clément N. Grieger J.C. Manufacturing of recombinant adeno-associated viral vectors for clinical trials Mol. Ther. Methods Clin. Dev.201631600210.1038/mtm.2016.227014711 PMC 4804725 · doi ↗ · pubmed ↗
- 5Sanchez-Martinez Z.V. Alpuche-Lazcano S.P. Stuible M. Durocher Y. CHO cells for virus-like particle and subunit vaccine manufacturing Vaccine 2024422530254210.1016/j.vaccine.2024.03.03438503664 · doi ↗ · pubmed ↗
- 6Abbate T. Dewasme L. Wouwer A.V. Bogaerts P. Adaptive flux variability analysis of HEK cell cultures Comput. Chem. Eng.202013310663310.1016/j.compchemeng.2019.106633 · doi ↗
- 7Adamson-Small L. Potter M. Falk D.J. Cleaver B. Byrne B.J. Clément N. A scalable method for the production of high-titer and high-quality adeno-associated type 9 vectors using the HSV platform Mol. Ther. Methods Clin. Dev.201631603110.1038/mtm.2016.3127222839 PMC 4863725 · doi ↗ · pubmed ↗
- 8Dash S. Sharon D.M. Mullick A. Kamen A.A. Only a small fraction of cells produce assembled capsids during transfection-based manufacturing of adeno-associated virus vectors Biotechnol. Bioeng.20221191685169010.1002/bit.2806835182435 PMC 9314941 · doi ↗ · pubmed ↗