Bottom Temperature Effect on Growth of Multiple Demersal Fish Species in Flemish Cap, Northwest Atlantic
Krerkkrai Songin, Fran Saborido-Rey, Graham J. Pierce

TL;DR
This study shows that warming ocean temperatures are causing some fish species to grow faster but reach smaller maximum sizes, which could impact fisheries and ecosystems.
Contribution
The study provides new insights into how warming affects growth rates and maximum sizes of seven demersal fish species using GAMMs and VBGFs.
Findings
Atlantic cod showed the largest increase in growth rate with rising temperatures.
Beaked redfish experienced the most significant decline in maximum size with warming.
Higher temperatures generally reduced asymptotic lengths while increasing growth rates across most species.
Abstract
This study examines temperature effects on the growth of seven demersal fish species in Flemish Cap. These species are Atlantic cod, American plaice, Greenland halibut, roughhead grenadier and three species of redfish. The length-at-age and bottom temperature data were analysed using generalised additive mixed models (GAMMs). The analysis was carried out separately for males and females. Both sexes of all species except American plaice showed significant temperature effects on growth. Best-fit GAMMs were used to predict the length at age under five temperature scenarios (3 °C, 3.5 °C, 4 °C, 4.5 °C and 5 °C). Von Bertalanffy growth functions were then fitted to the predictions to estimate asymptotic length and growth rate. As the temperature increased, most species showed an increase in growth rate but a decline in size at later life stages. Atlantic cod experienced the largest rise in…
Genes, proteins, chemicals, diseases, species, mutations and cell lines named across the full text — each resolved to its canonical identifier and authoritative record.
Click any figure to enlarge with its caption.
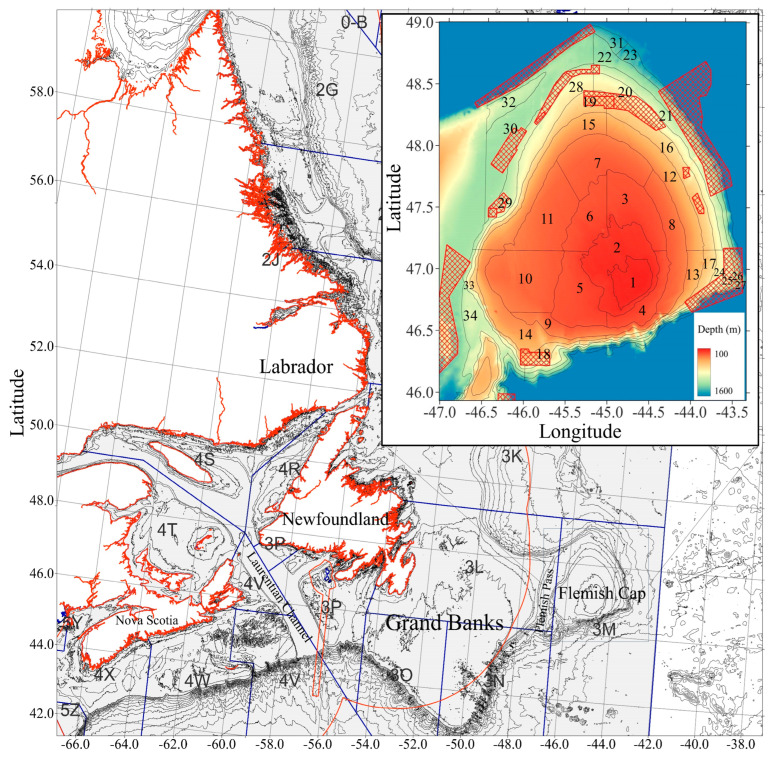 Figure 1
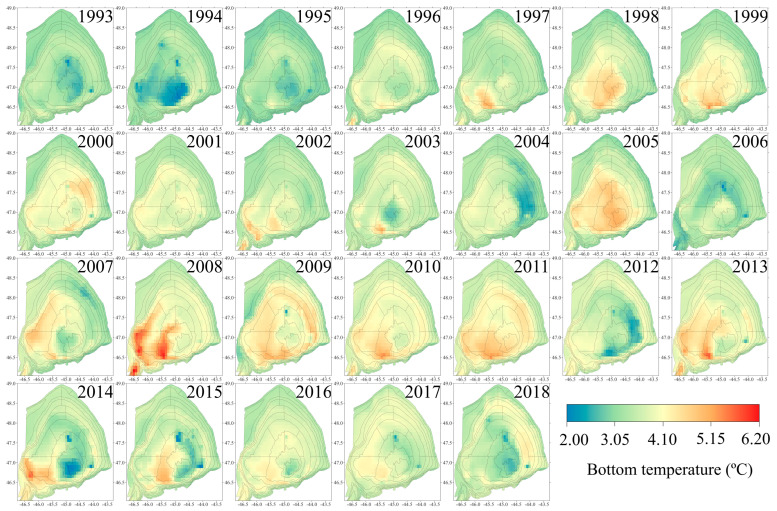 Figure 2
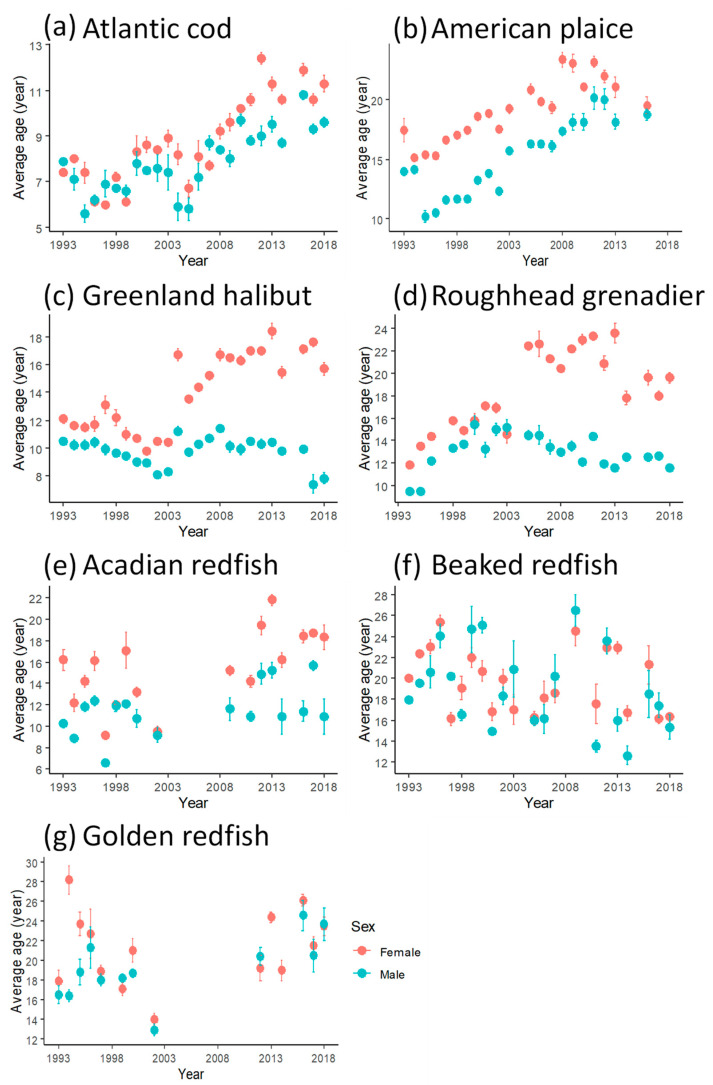 Figure 3
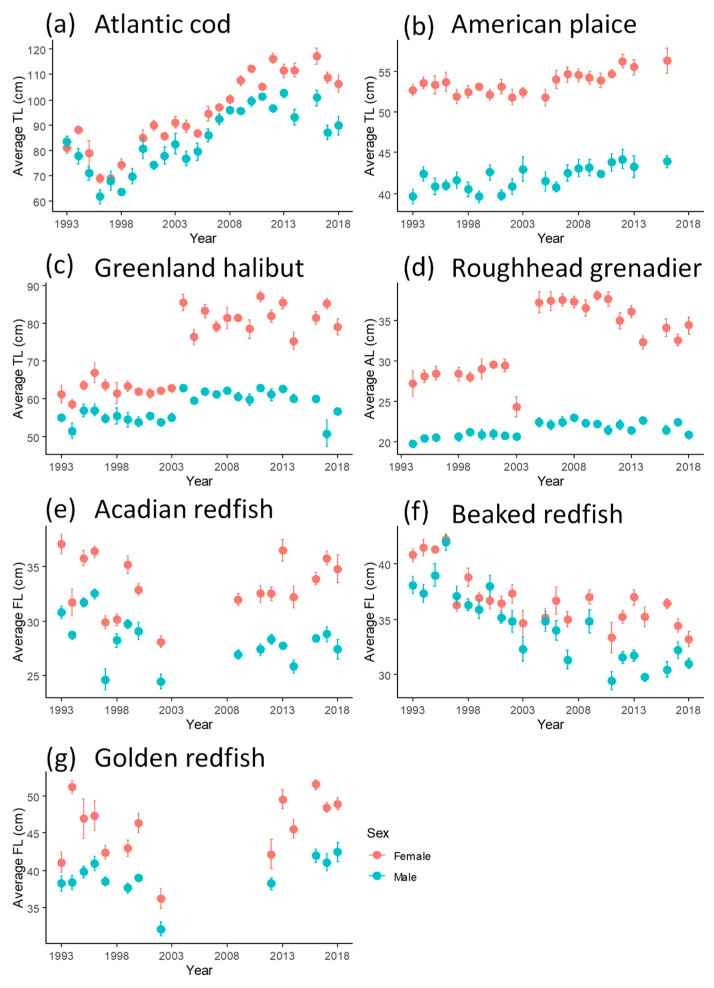 Figure 4
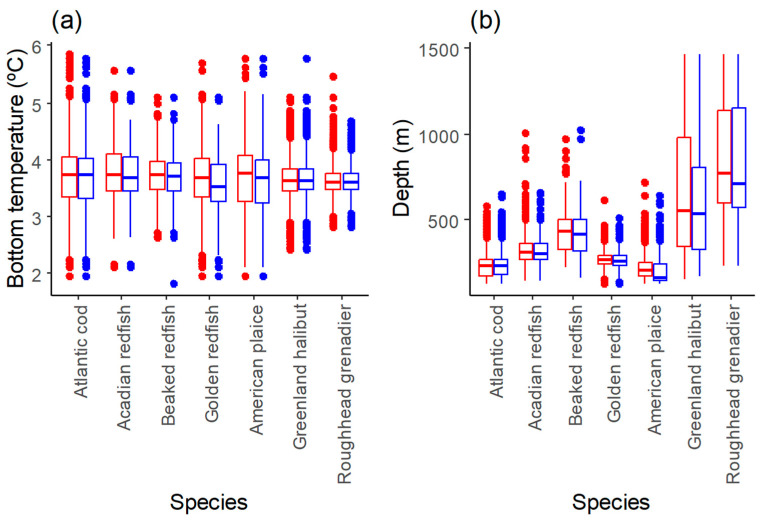 Figure 5
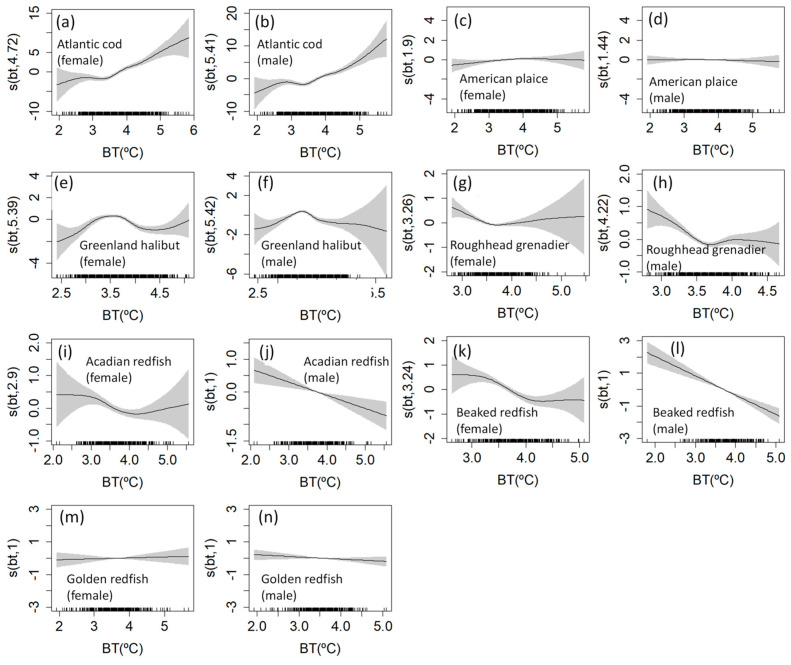 Figure 6
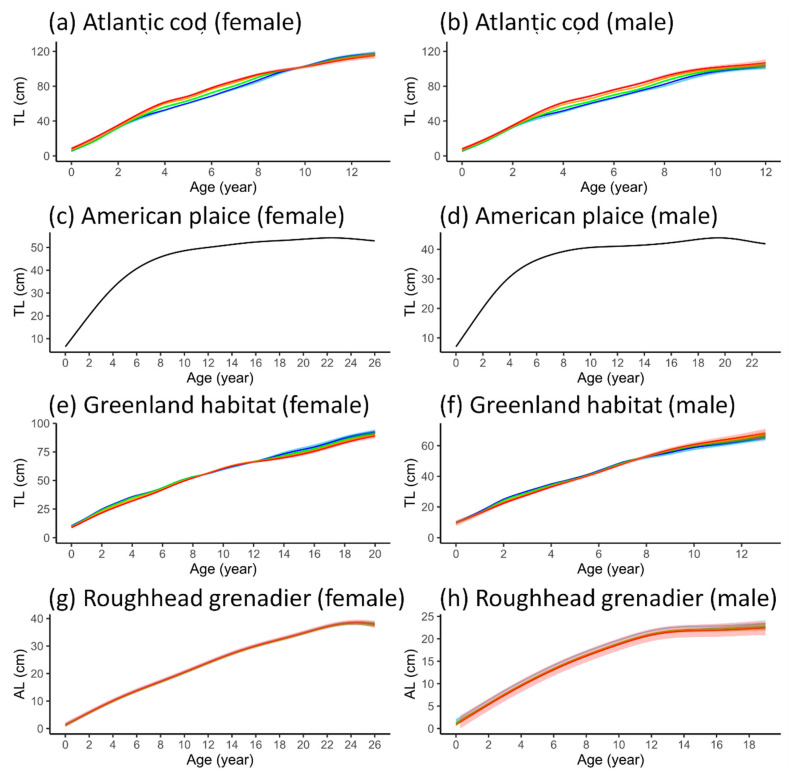 Figure 7
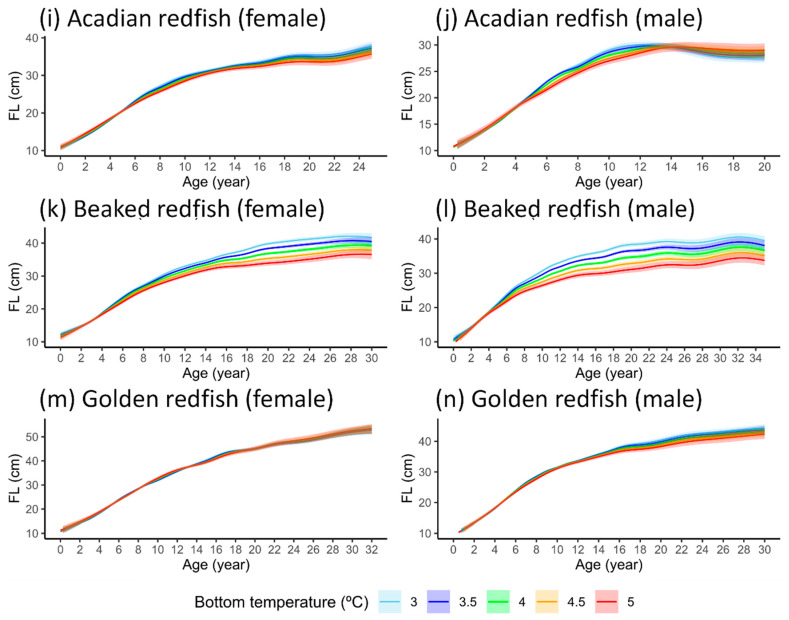 Figure 8
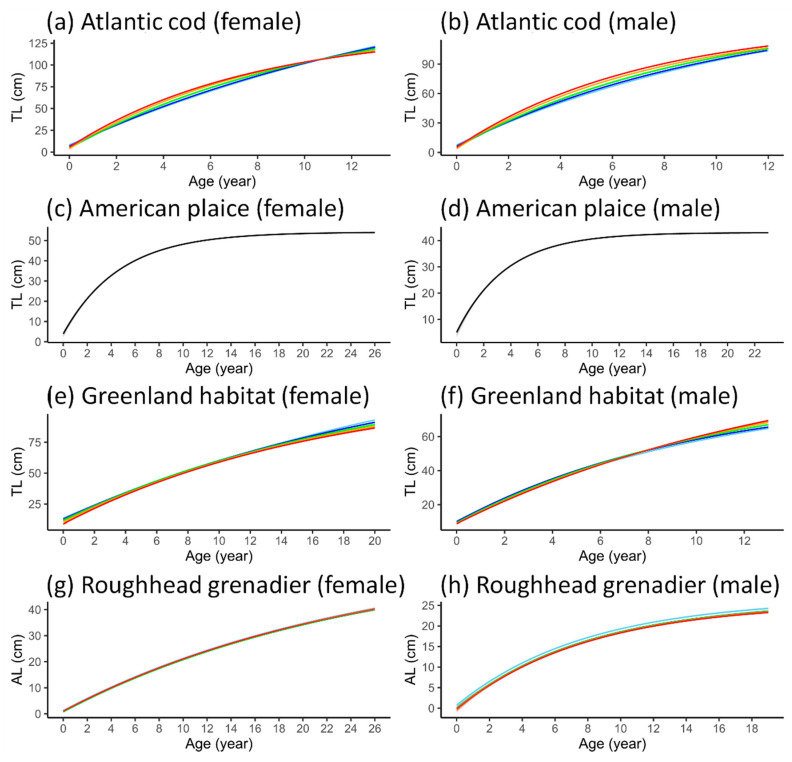 Figure 9
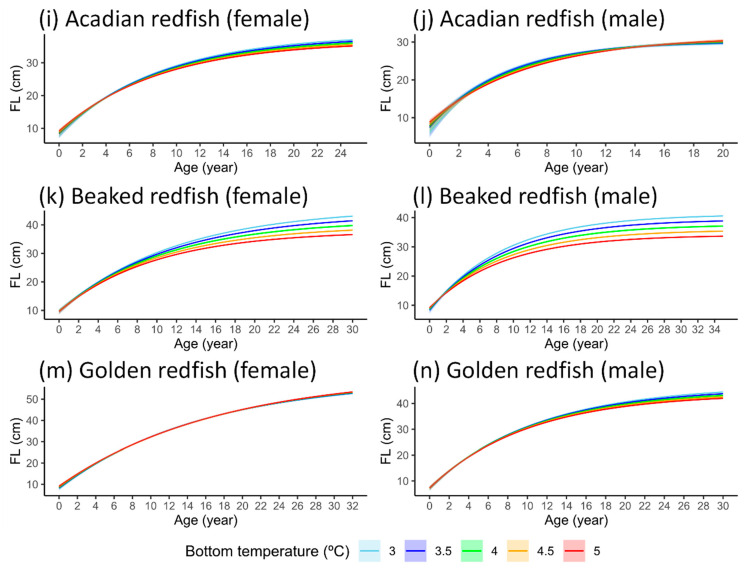 Figure 10
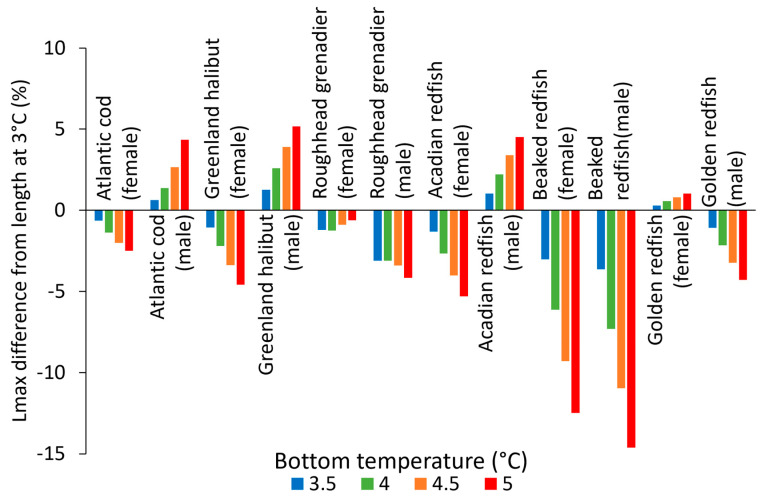 Figure 11
Peer Reviews
No public reviews on file for this paper yet. If you reviewed it on a platform where reviews are public (OpenReview, ICLR, NeurIPS, ICML), you can paste yours below so the community can read it here.
Videos
No videos yet. Explain this paper in a talk, walkthrough, or lecture? Add one.
Taxonomy
TopicsMarine and fisheries research · Fish Ecology and Management Studies · Marine Bivalve and Aquaculture Studies
1. Introduction
Global oceans have experienced rapid environmental changes, especially increased temperature of both near-surface and deep ocean waters [1]. The temperature in the Northwest Atlantic is projected to increase by nearly three times the global average [2,3]. These changes pose a threat to temperature-sensitive species, potentially impeding the recovery of already depleted populations, as observed in the demersal community of the southern Gulf of St. Lawrence and Flemish Cap Atlantic cod (Gadus morhua) [4,5].
Water temperature has a profound influence on fish life history, as it can directly alter fish metabolism and key parameters such as growth, maturity and mortality [6,7,8]. The impact of temperature changes on fish growth has been extensively documented globally, even in deep-sea environments (beyond 200 m depth), which are often regarded as stable [9]. A recent study has shown that temperature can impact the growth of a deep-sea scorpion fish species differently in different habitats [10]. This suggests that temperature impacts on growth should be investigated locally when possible, as the results for one species and location may not be applicable to similar species in other locations.
Alterations in life history parameters can have implications far beyond the individual level, influencing both population productivity and trophic structure [11]. While environmental changes can be detrimental to some species, they may pose less threat to (or even favour) others, depending on their resilience, which can lead to ecosystem-level changes [12]. Such environmental impacts may also affect fisheries by reducing (or increasing) stock biomass and maximum sustainable yield [13]. The magnitude of these impacts on an ecosystem is indicative of its resilience, where resilience at ecosystem-level can be defined as “the extent to which ecosystems can absorb recurrent natural and human perturbations and continue to regenerate without slowly degrading or unexpectedly flipping into alternate states” [14]. To comprehend the potential ramifications of global change for ecosystems and fisheries, it is crucial to examine the temperature effects on life history across a broad range of species and trophic levels [15].
One of the important life history aspects that could be affected by the temperature changes is growth. Knowledge of growth is necessary for estimating a fishing mortality benchmark that corresponds to the maximum sustainable yield [16]. A review of over a thousand publications found that the climate change effects on fish growth were generally negative, primarily resulting in a reduction in growth [15]. The changes seen in growth were also found to relate to other aspects of life history including reproduction and lifespan [17,18]. Therefore, understanding the effects of climate change on growth in fish stocks is an important step towards understanding the wider array of its impacts.
Flemish Cap presents a valuable opportunity to study the influence of temporal and spatial variation in environmental factors on fish populations, thanks to extensive fishery-independent survey data collected by the EU over three decades [19]. This area harbours multiple commercially important fish species, including Atlantic cod, redfish (Sebastes spp.), Greenland halibut (Reinhardtius hippoglossoides), American plaice (Hippoglossoides platessoides) and roughhead grenadier (Macrourus berglax) [20]. These species exhibit diverse behaviours, diets, habitat preferences and reproductive strategies, which may result in varied growth responses to environmental changes [21,22,23]. A recent study showed that Atlantic cod growth in the area has decreased over the years due to a combination of changes in temperature, fishing pressure and food availability, especially at early ages [5], with the significance of each factor varying depending on the fishing pressure (e.g., the moratorium period versus periods of fishing activity).
The temperature at Flemish Cap exhibits significant spatial and temporal variation, including directional change, with a discernible increasing trend since the early 1990s [24,25]. This makes the area ideal for studying the effects of long-term temperature fluctuations on high-priority populations. The findings could also be relevant for similar ecological regions where data collection has been less intensive and extensive.
This study aims to evaluate the influence of temperature variations on growth in multiple demersal species, employing generalised additive mixed modelling and the traditional von Bertalanffy growth function. The analysis was performed separately for males and females due to sex-related growth differences that have been observed in redfish, Greenland halibut, witch flounder and roughhead grenadier in Flemish Cap [26,27,28,29]. This study also aims to forecast growth trends separately for both sexes of each species under different climate scenarios. Thus, we hope to provide insights into the sensitivity of multiple fish species to warming seas.
2. Material and Methods
2.1. Fish Sampling and Aging
Bottom trawl survey data from Flemish Cap, collected by the EU between 1993 and 2018, were utilized in this study. The surveys were conducted annually during the summer months (late June to early August) by four collaborating institutes: the Institute of Marine Research (IIM-CSIC), the Spanish Institute of Oceanography (IEO), the AZTI-Tecnalia Foundation and the Portuguese Institute for Sea and Atmosphere (IPMA). The sampling methodology is described in detail in a publication by the Northwest Atlantic Fisheries Organization [30].
The fish samples were collected using the RV Cornide de Saavedra (1993–2002) and the RV Vizconde de Eza (2003 onwards). The study area was divided into 34 strata for stratified random sampling (Figure 1). The initial 19 strata were limited to a depth of ≤730 m and were consistently sampled in all years. The additional 15 strata (730–1460 m depth) were sampled from 2004 onward, except for strata 26 to 27, which were sampled only during 2004–2007; subsequently, sampling was discontinued due to the presence of dense sponge growth. These areas were considered to belong to vulnerable marine ecosystems, in which bottom fishing activities were then prohibited [31,32].
Fish samples were identified at the species level, except for juvenile redfish (fork length < 15 cm), for which identification at the species level was not practical on board. Seven species were selected for the study due to their common occurrence and commercial importance: Atlantic cod, American plaice, Greenland halibut, roughhead grenadier, Acadian redfish (S. fasciatus), beaked redfish (S. mentella) and golden redfish (S. norvegicus). Biological data, including length, weight, sex and maturity stage, and sagittal otoliths, were collected from these species. The length measurement method varied according to the species due to their different morphological characteristic. Total length (TL) was measured for Atlantic cod, American plaice and Greenland halibut, while fork length (FL) was recorded for redfish, and anal length (AL) for roughhead grenadier. The target for biological sampling was to collect sagittal otoliths from 20 individuals from each 1 cm length class for both males and females, every year [30]. Age determination was performed by otolith reading in laboratories by technicians at the IIM and IOCC.
2.2. Temperature Data
July monthly average bottom temperatures (BTs) for each year from 1993 to 2018 were obtained from the Copernicus Marine Service (CMEMS). The monthly average temperature was used instead of the in situ data to minimise the contribution of day-to-day BT variation within each survey. The BT data were based on reanalyses from the CMEMS global ocean reanalysis products, which incorporate real-time global forecasting [25]. The standard grids used had a spatial resolution of 1/12° (Figure 2). Temperature values were attributed to trawls based on the specific grids corresponding to the sampling locations.
2.3. Length-At-Age Models
Gaussian generalised additive mixed models (GAMM) were employed to analyse the non-linear relationship between length and the independent variables age and bottom temperature (BT) for both sexes of all selected species. Haul (identification) numbers were included as a random variable to account for the likely higher similarity of individual fish within hauls. The models were developed using RStudio version 4.1.1 with the mgcv package [34]. The possible models can be described as follows:
Model with interaction between age and BT:
Model without the interaction term:
Model with only age as a predictor:
where L represents the length, and s denotes the regression spline fitted to a predictor. The spline used for the modelling was the “thin-plate regression spline”, chosen for its flexibility and data-driven aspect, given the absence of prior knowledge of the forms of relationships among the variables. The restricted maximum likelihood (REML) method was used to estimate the smoothness parameters of the smooth functions in GAMMs. The adequacy of the basis dimension (k) was checked for all best-fit GAMMs using the gam.check function. The model likelihood values were compared using the Akaike information criterion (AIC) difference. The best-fit model was determined based on the lowest AIC, considering that between-model differences in AIC (ΔAIC) are considered significant only if the models differ by more than two AIC units and that if the models have a similar AIC value, according to the principle of parsimony, the simplest model is preferred. The best-fit model was used to predict length at age under five different bottom temperatures (3, 3.5, 4, 4.5 and 5 °C), which are within the spatiotemporal temperature range seen in Flemish Cap.
Von Bertalanffy growth functions (VBGFs) were fitted to the predictions from the best-fit GAMMs for each species. The VBGF is given by:
where L_t_ is the length at age t, L_∞_ is the asymptotic length, k is the growth coefficient, and t0 is the age at which the length is 0. The best-fit VBGF was determined for each combination of species and sex under all temperature scenarios based on the minimum standard deviation. The maximum age (t_max_) used to fit the VBGF was estimated as the average age of the ten oldest samples to avoid including outliers in the calculation of the growth parameters.
The potential maximum length (L_max_) that a fish can achieve within its natural lifespan was estimated by predicting the length at t_max_ for each species and sex. To quantify the magnitude of variation, the differences in L_max_ under the 3.5–5 °C temperature scenarios from L_max_ at 3 °C were calculated using the following formula:
where represents the length difference, and L_max,i °C_ denotes the maximum length in a given i temperature scenario.
3. Results
The number of otoliths collected for age reading varied over time and across species during the period from 1993 to 2018. Among the species, Atlantic cod required the highest level of effort for age determination. The age data represented 25 surveys (i.e., 25 years), and in total, more than 10,000 otoliths were read for each sex (Table 1). Other species, including Greenland halibut, American plaice, roughhead grenadier and beaked redfish, also had age data from over 20 surveys. Although fewer otoliths were read for Acadian and golden redfish, the age data still represented more than 10 surveys.
3.1. Maximum Ages
The overall lifespan t_max_ was calculated for all species (Table 2). Beaked redfish had the longest lifespan, followed by golden redfish, roughhead grenadier, American plaice, Acadian redfish, Greenland halibut and Atlantic cod. t_max_ was higher for females than for males in all species except beaked redfish. The species with the largest differences in t_max_ between the sexes were roughhead grenadier (7.9 years) and Greenland halibut (6.9 years). The species with the smallest differences in t_max_ between males and females were Atlantic cod (1.8 years) and golden redfish (1.8 years). For all species except beaked redfish, the t_max_ calculated from the data set with combined sexes was very close to, or exactly the same as, the female t_max_. This is because the ten oldest individuals were mostly or entirely female. On the other hand, for beaked redfish, the t_max_ for combined sexes was close to the male t_max_ because most of the ten oldest individuals were male.
The annual t_max_ for years with otolith reading data showed temporal variations (Figure 3). For Atlantic cod and American plaice, the annual t_max_ showed a clear increasing trend with time. A decrease in t_max_ over time was seen for beaked redfish. For Acadian and golden redfish, there were no age data between 2003 and 2011, and no discernible temporal trend for t_max_ could be detected.
For Greenland halibut and roughhead grenadier, there was a notable increase in female t_max_ in 2004, coinciding with the expansion of the trawl sampling area from the limit of 730 m depth to that of 1460 m. In males of these species, t_max_ was more stable over the years, although temporal trends could still be observed. The t_max_ of male Greenland halibut declined steadily from 1993 to 2003. A shift to a higher t_max_ in 2004 was seen in male Greenland halibut, but the change was much less marked than in females. The male t_max_ then remained relatively stable until 2017, when it dropped substantially. The t_max_ of both male and female roughhead grenadier clearly increased between 1993 and 2003. The male t_max_ declined steadily after 2004.
The average size of the ten oldest individuals in each year was also calculated (Figure 4). The trends for size at oldest age for both sexes of Atlantic cod showed a steady increase since 1996, similar to the trends for t_max_. For American plaice, trends of increasing size were present but much less distinct than the increase of t_max_ over the years. On the other hand, for beaked redfish, the decline in size was much more discernible than the trend for t_max_. The trends for size for the other two redfish species remained unclear, as was the case for their annual t_max_. For Greenland halibut and roughhead grenadier, a shift to a larger size in 2004, especially for females, could also be clearly observed in these data.
3.2. Temperature Coverage
Species typically sampled at shallower depths were found at a wider range of temperature compared to those found at greater depths (Figure 5). Among them, Atlantic cod, golden redfish and American plaice experienced the widest temperature range at sampling locations (Figure 5a), with interquartile ranges spanning from 3.2 to 4.1 °C. The minimum recorded temperature was approximately 1.9 °C, while the maximum approached 5.9 °C. These three species were found at relatively shallow depths compared to others (Figure 5b), with a median sampling depth of <270 m, and a third quartile depth of <300 m. Acadian and beaked redfish, which inhabited deeper areas with a median depth of <420 m, displayed a slightly narrower interquartile temperature range.
In contrast, the species with the narrowest temperature ranges were Greenland halibut and roughhead grenadier, with interquartile ranges between 3.5 and 3.8 °C (Figure 5a). These two species occupied the deepest parts of underwater mountain compared to all others in this study (Figure 5b). The median sampling depth for Greenland halibut was 540 m for males and 554 m for females. Roughhead grenadier was found even deeper, with median depths of 709 m for males and 766 m for females.
3.3. Length-at-Age GAMM
The length-at-age models for each species were developed using GAMMs. The deviance explained exceeded 80% in all models (Table 3). The BT term was found to be highly significant (p < 0.001) when incorporated into the models for all species except American plaice and golden redfish. Apart from American plaice, most of the best-fit models featured a significant interaction between the effects of age and BT (p < 0.01), including for golden redfish, which did not show a significant BT term without an interaction. Only the best-fit GAMMs for roughhead grenadier of both sexes had a BT term without an interaction.
The relationships between temperature and size (not accounting for the interaction with age) were explored, and differences in trajectories were found among the species. Clear differences were also apparent between the sexes for some species. The partial effects of temperature on size are shown in Figure 5. For Atlantic cod, the size increased with temperature for both sexes, especially at temperatures warmer than 3.5 °C, although the 95% confidence interval (CI) rapidly widened when the temperature rose above 4.5 °C (Figure 6a,b). Wide CIs were generally seen for model fits at temperatures below 3 °C and higher than 4.5 °C for all species and sexes. For American plaice, for which the temperature term was not significant in the best-fit GAMM, the size effectively remained unchanged regardless of the temperature (Figure 6c,d). For Greenland halibut, the size increased when the temperature increased from 2.5 °C to around 3.5 °C, then declined at higher temperatures up to 4.5 °C (Figure 6e,f). However, the trends for each sex diverged as the temperature continued to increase. The size of females increased again while the size of males continued its decline. For both sexes of roughhead grenadier, the size decreased when the temperature increased from 3 °C to around 3.5 °C and then remained relatively stable at warmer temperatures (Figure 6g,h). The size–temperature relationship for Acadian and beaked redfish was generally similar. For males of both species, the relationship was negative and linear (Figure 6j,l). However, the scale of the temperature effect was larger for beaked redfish. For females of both Acadian and beaked redfish, the size remained stable up to around 3 °C before it declined until the temperature reached 4 °C (Figure 6i,k). The size then slightly increased at warmer temperatures for Acadian redfish, while it remained fairly stable for beaked redfish. Although the interaction term between age and temperature was significant in the best-fit GAMM for golden redfish, the temperature term alone was not significant and did not affect the size (Figure 6m,n).
Although the best-fit GAMMs featured a significant BT effect or a significant effect of age × BT (i.e., the term capturing both main effects and their interaction) for most species, the magnitude of the temperature effects on growth differed from one species to another (Figure 7). The GAMM predictions at smaller increases in temperature for all species and sexes except American plaice can be found in Supplementary Materials (Figure S1). For both sexes of Atlantic cod, the models showed larger sizes at early life (<6 years) at higher temperatures (Figure 7a,b). However, female cod reached a larger final size in colder BT, while male cod grew larger in warmer BT. The GAMM predictions for length at age at 3 °C to 5 °C BT for both sexes showed the most pronounced size variation between the ages of 4 and 8 years. Within this range, the CIs for the length trajectories at 3 °C and 3.5 °C almost entirely overlapped. The sizes at 4 °C were consistently larger than at 3 °C and 3.5 °C but smaller than at 4.5 °C and 5 °C throughout the age range. The sizes at 4 °C were smaller than at 5 °C, but the 95% CIs indicated some overlap between them. After the age of 8 years, the differences in length at age at different temperatures began to decrease. Female cod became slightly larger in colder water after the age of 10 years, while male cod remained slightly larger in warmer temperatures. However, the widening CIs at ages >10 years led to overlaps in size at different temperatures.
In the early life stages (ages 2 to 4 years) of both male and female Greenland halibut, the size was slightly larger at lower temperatures (Figure 7e,f). After the age of 4 years, the length-at-age trajectories converged and continued to overlap through to later life stages, when the curves of the two sexes began to diverge. For female Greenland halibut, the temperature effects became more pronounced after the age of 12 years, with size increasing at colder temperatures (Figure 7e). the model predictions for the ages of 12 to 18 years at five different temperatures showed some overlap between the sizes at 3 °C and 3.5 °C and between the sizes at 4.5 °C and 5 °C. In contrast, for male Greenland halibut, the temperature effect indicated that the fish reached a larger size at warmer temperatures (Figure 7f). Size differentiation in males began around the age of 8 years, although large portions of the 95% CIs overlapped across different temperatures.
Although the best-fit GAMMs for both female and male roughhead grenadier contained a significant BT term, the temperature effect on the age–length relationship was virtually imperceptible in females (Figure 7g). For males, the size was larger at lower temperatures (Figure 7h). However, the model predictions showed overlapping length-at-age 95% CIs across all temperatures for both sexes.
For Acadian redfish, both males and females exhibited larger sizes at lower temperatures between the ages of 5 and 12 years (Figure 7i,j). the model predictions within this age range displayed a greater magnitude of temperature-driven differences in males than in females. The length trajectories then diverged at older ages. Female fish continued to be larger at lower temperatures throughout their lifespan (Figure 7i), while male fish became larger as they approached the final age (Figure 7j). However, the length 95% CIs after the age of 12 years were especially wide for male, and overlaps occurred across all temperatures.
Both sexes of beaked redfish exhibited similar temperature effects on the age–length relationship (Figure 7k,l). The model predictions showed that the growth trajectories at different BTs began to diverge after the age of 4 years, when the length at age at low temperatures became greater. The trend of a larger size at lower temperatures continued consistently throughout their lifespan. The 95% CIs widened and started to show some overlaps only when the fish reached their late 20s.
Golden redfish exhibited smaller temperature effects on growth compared to other redfish species (Figure 7m,n). The growth variation related to BT in females was almost entirely imperceptible, while males showed slightly smaller sizes in late life stages at higher temperatures. In females, the model predictions showed overlapping 95% CIs between the growth trajectories at all five temperatures for almost their entire lifespan, except between the ages of 14 and 18 years, when the sizes at low temperatures were slightly larger (Figure 7m). In males, the sizes at low temperatures became distinctly larger at the age of 16 years and older (Figure 7n), although the 95% CIs greatly widened after the age of 22 years, making the differences in growth difficult to determine.
3.4. VBGF Parameterization
Apart from American plaice, for which the best GAMMs did not include BT, the VBGF could be fitted to the predictions of length at age generated by the best-fit GAMMs under five BT scenarios (R^2^ > 0.95). The growth trajectories from VBGF also visually resembled those of the GAMMs (Figure 8). The parameters derived from the fitted VBGF exhibited variation at different temperatures for all species, albeit to differing extents (Table 4). Females of all species exhibited lower k values but larger L_∞_ values compared to males. The VBGF fitted to the predictions from the best-fit GAMMs for roughhead grenadier, which lacked an interaction term, showed no changes in k across the different temperature scenarios. The differences in L_∞_ were also minuscule, with an increase of <1 cm from 3 °C to 5 °C. Most species exhibited a decreasing trend for L_∞_ and increasing k as BT rose, regardless of sex. However, male Greenland halibut, male Acadian redfish and female golden redfish displayed opposing trends, although the largest difference in k for female golden redfish was less than 0.01.
Most species–sex combinations displayed differences in L_max_, mostly of less than 5%, when the temperature increased from 3 to 5 °C (Figure 9). The species–sex combinations that showed differences exceeding 5% were male Greenland halibut, female Acadian redfish and, most notably, beaked redfish of both sexes. The species–sex combinations with the least L_max_ variation were female roughhead grenadier and female Acadian redfish, with the greatest L_max_ variation being around 1% when the temperature changed from 3 to 5 °C. The case of male Atlantic cod is notable because L_∞_ decreased at higher temperature but L_max_ showed the opposite trend. This was due to the greatly increased k at higher temperatures and the relatively low t_max_. The higher k allowed male cod in warmer scenarios to grow much more rapidly in their early life, while the low t_max_ prevented it from reaching large sizes at lower temperatures.
4. Discussion
4.1. Modelling Growth
The relationship between age and length for fish species, including those found in the Flemish Cap, has been extensively described using the VBGF [26,35,36,37]. However, the limitations of the VBGF parameters in incorporating environmental factors have been recognized, and alternative non-linear models such as generalised additive models have emerged to provide more flexible approaches [38]. This study demonstrates that GAMMs can provide improved explanations for length at age for multiple species by incorporating environmental variables, namely, bottom temperature in this case. The inclusion of bottom temperature provides the possibility to predict length at age under different environmental conditions, predictions which can then be used to fit traditional VBGF models to obtain comprehensive growth parameters. Some caution is, however, needed, as GAMMs provide purely empirical fits to the data, making no assumptions or including no information about the mechanisms underlying growth.
To validate the VBGFs which were derived from the GAMMs in this study, we can compare the growth parameters to results from previous investigations. The ranges of L_∞_ and k for all species–sex combinations in this study were close to previous VBGF parameter estimates in the same area or the nearby NAFO divisions, with the differences being typically within 10% (see [26,27,28,29,39,40]). In the cases where multiple estimations were reported throughout the years such as for American plaice and roughhead grenadier, those estimations overlapped with the range found in this study [27,28]. This suggests that the approach used in this study provides biologically realistic estimations while giving additional insights into the temperature effects on growth. The largest difference we found was for female Greenland halibut, for which the recent literature has estimated L_∞_ to be 109 cm, and k to be 0.09 year^−1^ [29]. However, the samples were obtained from Northeast Newfoundland and Labrador Shelves (NAFO SA2 + 3K) in 1976 and 1977, as well as from individuals smaller than 21 cm collected in 2007, which could be the source of the discrepancy. Currently, there is no recent VBGF parameter estimation for Greenland halibut from Flemish Cap that could permit a more direct comparison.
Although the models yielded estimates within apparently realistic ranges, there are some limitations. The modelling approach in this study took into account only the local temperature at the captured age and not the variation that an individual could have experienced throughout its life. Therefore, the results did not capture the variability of growth due to temperature fluctuation in an individual lifetime. We explored the possibility of cooperating temperatures from a previous year at the same location in modelling, but the results showed no improvement to the GAMM fitness. Still, the result from a previous investigation using the individual Atlantic cod otolith increment as a growth index found a similar increase in growth with temperature, especially for juvenile and young mature fish in the pre-moratorium period [5]. However, there is no study of otolith increments in relation to temperature for other species from Flemish Cap. The models constructed in this study provide a simple representation of the temperature effects on growth, but there are other factors that could be influential, such as fishing mortality, the thickness of the cold intermediate water layer, food availability and competition, that were not included in the analysis. This could be remedied in the future with the inclusion of other factors in the models.
Another limitation that should be taken into account is the unevenness of sampling for fish of different ages. This is particularly apparent at early ages for redfish, due to the impossibility of identifying the vast majority of juveniles to the species level. The exclusion of juvenile redfish up to 15 cm FL could obscure the growth trajectory in early life and the temperature impacts on it for all three redfish species. The resulting lack of samples for small individuals may have contributed to the larger size at age 0 in the models than was seen for other species. Additionally, catchability in the trawl nets used for sampling is typically lower for small individuals of all species [41]. The catchability of cod by the surveys used in this study was found to be very low at the age of 1 year and rapidly increase to a stable level at the age of 4 years [42]. On the other side of the spectrum, the inherently low number of old individuals in the population structure due to fishery and natural mortality resulted in the low number of samples representing the late life stage [43]. The last few age classes for each species (for both sexes) in this study were represented by fewer than ten samples, which may add to the uncertainty in VBGF parameter estimation [44].
4.2. Maximum Age and Size Variation
Beside their potential effects on the relationship between age and length, some of the external factors that were not accounted for in the present study clearly do affect the maximum age and size of multiple species, certainly in the case of fishing pressure. Clear trends of increasing maximum age and size from the mid-1990s to the mid-2010s were found for Atlantic cod and American plaice. This was likely a result of the reduced fishing pressure following the drastic depletion of the cod stock between the late 1980s and the early 1990s. Cod fishing mortality peaked between 1992 and 1995, before dropping sharply, and the moratorium was eventually implemented in 1999 [42]. This lifting of the fishing pressure would have allowed more individuals to grow older and reach larger size without being eliminated by fisheries. The maximum age and size increased steadily until the early 2010s, when the stock was deemed to have recovered, and fishing mortality was introduced once again but at a much lower rate compared to that in the pre-moratorium era. Although American plaice was generally not reported as the main target species in NAFO Division 3M [45], the great reduction in cod trawling activities may have positively impacted their population. At Flemish Cap, American plaice generally inhabit the shallow parts of the underwater mountain, similar to cod [33]. The easing of the fishing pressure on cod would have resulted in a reduction in American plaice bycatches. This was evident in the decline in fishing mortality for American plaice in parallel with the decline in fishing mortality for cod [46]. These changes in the maximum age and size resulting from changes in the fishing pressure could also have played a role in the growth trajectory variation, and further investigation would be needed to distinguish any such effects from the temperature effects.
Another species that showed a clear temporal trend in maximum age and length is beaked redfish. Beaked redfish maximum age and length declined throughout the mid-1990s to the late 2000s, even though redfish fishing mortality dropped sharply in 1997 and was subsequently kept at a low level [47]. This opposing temporal trend (compared to that for cod) could be explained by their prey–predator relationship [48]. The positive effect of reducing the fishing pressure on beaked redfish in the late 1990s could be negated by the increase in the predation pressure from Atlantic cod, which started to recover their spawning stock biomass in the early 2000s [41]. The growing number of older and larger cod would have consumed more and larger beaked redfish.
For Acadian and golden redfish, which are also eaten by Atlantic cod [21], the lack of otolith readings in multiple years (9 years for Acadian redfish, and 12 years for golden redfish) made it difficult to determine if there was a temporal trend for maximum age and length as well as to detect the effects of temperature on growth. Nevertheless, the data still covered the temperature range commonly seen in the area, and the GAMMs were still able to detect the effects of temperature on growth.
The geographical coverage of the first eleven years of the study period (1993–2003) would have resulted in deeper living populations being less well sampled, particularly those of roughhead grenadier and adult Greenland halibut, which are known to have a distribution range extending much deeper than 730 m [22,45]. The underrepresentation of older and larger Greenland halibut and roughhead grenadier in the earlier years became apparent when the age of the samples from 2004 onwards was determined. Only when the depth range of trawl sampling expanded deeper, reaching 1460 m, were the true maximum ages and sizes revealed. Moreover, the temperature at depths > 730 m is typically lower than in shallower waters, as shown by temperature maps [25], which is thus another source of bias in the data.
4.3. Temperature Effects on Fish
While the deep sea (>200 m depth) is generally considered more stable than shallow environments, it is not immune to oceanographical changes [49,50]. Most species show a decrease in L_∞_ as the temperature rises, indicating a smaller size at later life stages. This response can be attributed to the dependence of ectothermic organisms on external heat sources for thermoregulation, which affects their metabolic rate [8]. Laboratory studies have demonstrated that increasing the temperature can accelerate fish metabolism [51,52]. Such changes in metabolic rate can subsequently influence other biological processes, including accelerating the early growth and reducing the maximum length, as observed in laboratory settings and natural habitats for the species examined in this study [53,54,55,56,57,58].
The results for some species challenge the assumption that warmer waters will lead to faster growth and smaller size. Male Greenland halibut, male Acadian redfish and female golden redfish displayed opposite trends. In the case of golden redfish, the changes were extremely small and might not be biologically significant, despite being statistically significant. The changes were more visible in male Greenland halibut and male Acadian redfish, but it should also be noted that large parts of their GAMM prediction 95% CIs overlapped at different temperatures, after 8 years of age for Greenland halibut and after age 12 years for Acadian redfish. It is important to consider the limited range of bottom temperatures experienced by deep-sea fish, with Greenland halibut distributed considerably deeper than other species [22]. The warmest temperature at great depths may not exceed their optimal threshold, unlike at the upper levels [59]. Studies in the nearby Gulf of St. Lawrence have shown that the optimum temperature for the metabolism and growth of Greenland halibut is exceeded at 7.5 °C, which is higher than the warmest recorded bottom temperature in the entire Flemish Cap [57]. Although the distribution of Acadian redfish is limited at a much shallower area, the increased temperature might still be within their optimal temperature range. This remains to be further investigated.
The impact of temperature on growth among demersal species can vary greatly, as evidenced by the trajectories of the fitted VBGFs. Some species, such as beaked redfish, exhibited clear changes in growth at different temperatures, while for others, such as American plaice, there was no significant variation. These diverse growth responses may be attributed to resilience to direct temperature impacts on biological processes and/or indirect effects such as changes in food accessibility [60,61]. For example, both fishery mortality and prey abundance (including redfish and northern shrimp abundance) are known to affect Atlantic cod growth in Flemish Cap, especially in their early life, and both can fluctuate over time, which could impact cod resilience to temperature changes [5]. Differences in habitat preference could also play a role. The closely taxonomically related Sebastes spp. show great variation in the growth responses to temperature, regardless of the shared similarity in feeding habits [21]. Beaked redfish is known to reside deeper than the other two redfish species [22], and the temperature changes they experience may thus affect their food sources (or competition for them) differently. The indirect temperature impacts through trophic interactions should be further evaluated for a more complete picture.
4.4. Ecological and Fishery Implications
The results generally show a potentially concerning trend of decreasing L_∞_ and increasing k for multiple species as the bottom temperature rises above the average of 3.6 °C in Flemish Cap. A higher k is associated with a faster growth rate but often at the cost of a shorter lifespan, as observed for multiple species in nature and controlled environments [6,17,62]. Such trends suggest that fish populations may become shorter lived and have a higher natural mortality, which is especially concerning for species that must withstand a high fishing mortality [63]. Among the species examined in this investigation, Atlantic cod exhibited the most drastic shift towards a higher k. It is also important to note that the same maximum ages were shared for maximum predicted length in all scenarios, and the temperature effect on maximum age was not assessed in our study. In the case of Atlantic cod, this implied a higher maximum length (at the maximum age of 12 years) at higher temperatures for males due to the drastically increase in k (75% increase from 3 to 5 °C) even though L_∞_ declined (17% decrease from 3 to 5 °C). For female cod, the maximum sizes (at the maximum age of 13 years) were only slightly lower at higher temperatures. However, this may not hold true if their longevity declines. If higher k were to reduce their longevity, their maximum size could also be further reduced [41,64].
Changes in the biological characteristics of species due to rising temperature can pose a threat to their populations and overall ecosystem dynamics [65]. Increased natural mortality has already been detected for Acadian and beaked redfish in Flemish Cap, despite the low fishing mortality; the increase in the individual growth rate of Atlantic cod was suspected to be a cause [66]. Warmer temperatures also lead to modifications in competition, with cold-preference species struggling to compete [67]. While the competitiveness of Atlantic cod may increase in the short term as a result of the faster early growth rate, the population could suffer a reduction in individual size and productivity. A meta-analysis of multiple fish species has shown that large females are disproportionately more fecund than smaller females, which potentially means a reduction in productivity if the individuals in the population become smaller [68]. In such a scenario, more resilient competitors that suffer less change such as Greenland halibut, which rely on similar food resources [21], may fare better in the long term. Changes in the life history of their major prey species, Sebastes spp., may also impact food availability for cod and further complicate the ecological dynamics [69]. Due to the complicated and unequal impacts of temperature on different species, a close monitoring of the ecosystem, particularly cod growth and its predation pressure on other species, is recommended in preparation for timely management responses.
The alteration of fish growth and natural mortality can have multiple implications on fisheries [70]. A decrease in length at age can result in the capture of smaller fish, which tend to be less valuable in the market, as demonstrated for Atlantic cod [71]. A smaller fish size, even with the same numerical abundance, would also reduce the amount of exploitable biomass that can be sustainably harvested [56]. Furthermore, the potential reduction in fecundity due to the decline in female size could result in lower productivity to sustain fisheries [68]. Additionally, the potential decrease in lifespan and increase in natural mortality will further limit the sustainable level of fishing mortality that can be imposed on the population [72]. Given that some commercially valuable species included in this study exhibit these trends, the severity of the decline in resource availability for fisheries needs to be investigated.
It is crucial to incorporate environmental effects into stock assessments, as indicated by this study and numerous others that highlight the influence of environmental conditions, particularly temperature, on fish life history [73]. Recent years have shown advancements in incorporating environmental factors into stock assessments and ecosystem modelling through models such as end-to-end OSMOSE and Atlantis [74,75]. However, many of these models primarily utilize environmental factors to forecast primary productivity, recruitment or distribution through coupled oceanographic models [76,77]. Exploring climate change impacts through studies of changes in individual life history is still rare [78]. The results of this study suggest that it could be valuable to further develop ecological models for Flemish Cap, such as the already existing multispecies Gadget model (GadCap), which relies on von Bertalanffy growth parameters to simulate the ecosystem in various temperature scenarios [36,79,80]. The predicted growth parameters, alongside other factors that could be altered by temperature, could be used as inputs in ecological models to simulate the ecosystem in various temperature scenarios.
5. Conclusions
The changes in the growth parameters of the species found through the modelling approach applied in the present study reinforce the evidence and concerns that the rising ocean temperature can result in undesirable alterations to fish growth, with likely knock-on effects at the ecosystem level, for example, mediated by changing trophic relationships linked to changes in body size. The magnitude of the temperature impact may vary among species. The mechanisms could involve their inherent biological characteristics or indirect impacts via their food sources and competition, which needs to be further investigated. Other factors that could affect growth and maximum body size, including fishing mortality, should be further explored. It is advisable to include the temperature effects on growth in assessments and ecosystem modelling for more comprehensive predictions that reflect the natural reality. The ocean temperature will not stop warming in the foreseeable future, and the race against time to figure out its impacts on the ecosystem and resources is needed to be taken seriously for us to prepare for the changes to come.
The reference list from the paper itself. Each links out to its DOI / PubMed record.
- 1Abraham J.P. Baringer M. Bindoff N.L. Boyer T. Cheng L.J. Church J.A. Conroy J.L. Domingues C.M. Fasullo J.T. Gilson J. A Review of Global Ocean Temperature Observations: Implications for Ocean Heat Content Estimates and Climate Change Rev. Geophys.20135145048310.1002/rog.20022 · doi ↗
- 2Saba V.S. Griffies S.M. Anderson W.G. Winton M. Alexander M.A. Delworth T.L. Hare J.A. Harrison M.J. Rosati A. Vecchi G.A. Enhanced Warming of the Northwest Atlantic Ocean under Climate Change J. Geophys. Res. Ocean.201612111813210.1002/2015 JC 011346 · doi ↗
- 3Alexander M.A. Shin S.I. Scott J.D. Curchitser E. Stock C. The Response of the Northwest Atlantic Ocean to Climate Change J. Clim.20203340542810.1175/JCLI-D-19-0117.1 · doi ↗
- 4Swain D.P. Benoît H.P. Extreme Increases in Natural Mortality Prevent Recovery of Collapsed Fish Populations in a Northwest Atlantic Ecosystem Mar. Ecol. Prog. Ser.201551916518210.3354/meps 11012 · doi ↗
- 5Ruiz-Díaz R. Dominguez-Petit R. Saborido-Rey F. Atlantic Cod Growth History in Flemish Cap Between 1981 and 2016: The Impact of Fishing and Climate on Growth Performance Front. Mar. Sci.2022987648810.3389/fmars.2022.876488 · doi ↗
- 6Gislason H. Daan N. Rice J.C. Pope J.G. Size, Growth, Temperature and the Natural Mortality of Marine Fish Fish Fish.20101114915810.1111/j.1467-2979.2009.00350.x · doi ↗
- 7Killen S.S. Growth Trajectory Influences Temperature Preference in Fish through an Effect on Metabolic Rate J. Anim. Ecol.2014831513152210.1111/1365-2656.1224424806155 PMC 4277333 · doi ↗ · pubmed ↗
- 8Schulte P.M. The Effects of Temperature on Aerobic Metabolism: Towards a Mechanistic Understanding of the Responses of Ectotherms to a Changing Environment J. Exp. Biol.20152181856186610.1242/jeb.11885126085663 · doi ↗ · pubmed ↗