Identification and validation of a risk assessment scoring tool for extended-spectrum beta-lactamase-producing Enterobacterales bacteremia at a tertiary teaching hospital
Victoria Gavaghan, Jessica L. Miller, Maureen Shields, Jennifer Dela-Pena

TL;DR
This study developed a scoring tool to identify hospitalized patients likely to have ESBL-producing bloodstream infections based on risk factors like diabetes and antibiotic history.
Contribution
The novel contribution is a validated risk assessment tool for ESBL bacteremia tailored to a specific hospital setting.
Findings
Diabetes, recent invasive procedures, antibiotic use, and prior ESBL history were independent predictors of ESBL.
The risk assessment tool showed strong predictive power with an ROC AUC of 0.88 in the validation cohort.
The model demonstrated good calibration and discrimination in identifying ESBL cases.
Abstract
To identify institution-specific risk factors for extended-spectrum beta-lactamase (ESBL) bloodstream infections (BSI) to develop and validate a risk assessment scoring tool that can be utilized for hospitalized patients. Single-center, retrospective, case-control study. Tertiary teaching hospital. Hospitalized adult and pediatric patients with E. coli or Klebsiella spp. BSI were stratified based on ESBL production between August 2019 to July 2021. Exclusion criteria included patients < 28 days old, a positive blood culture resulting prior to admission/after discharge or a polymicrobial and/or carbapenem-resistant BSI. Multivariable logistic regression assessed predictors of ESBL in a derivation cohort. Predictors were applied to a novel validation BSI cohort using area under the receiver-operator characteristics curve (ROC AUC) to assess the reliability of identifying patients…
Genes, proteins, chemicals, diseases, species, mutations and cell lines named across the full text — each resolved to its canonical identifier and authoritative record.
Click any figure to enlarge with its caption.
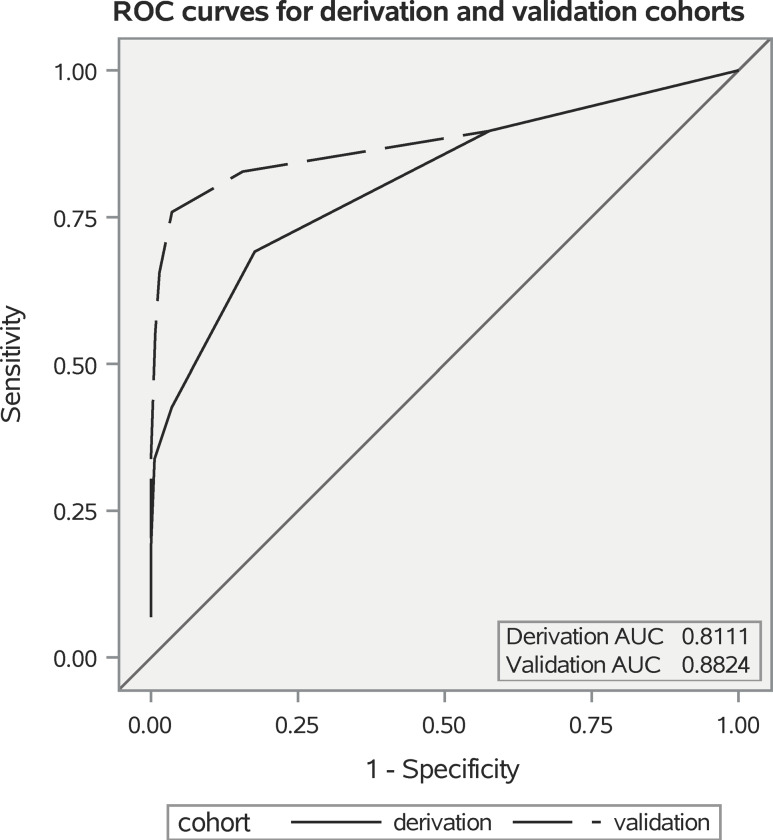 Figure 1
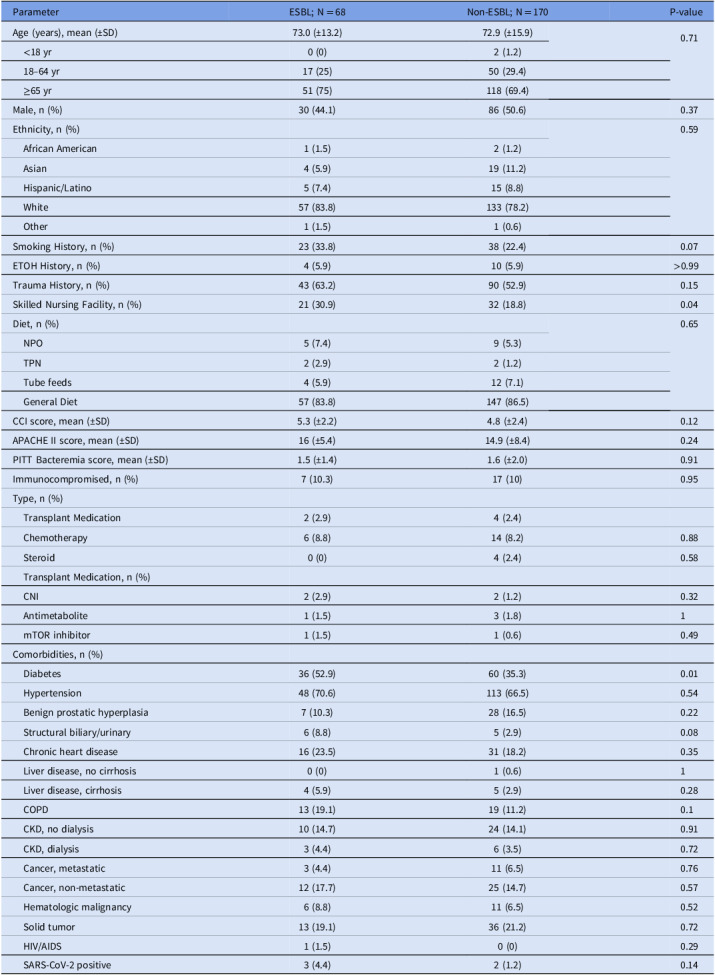 Figure 2
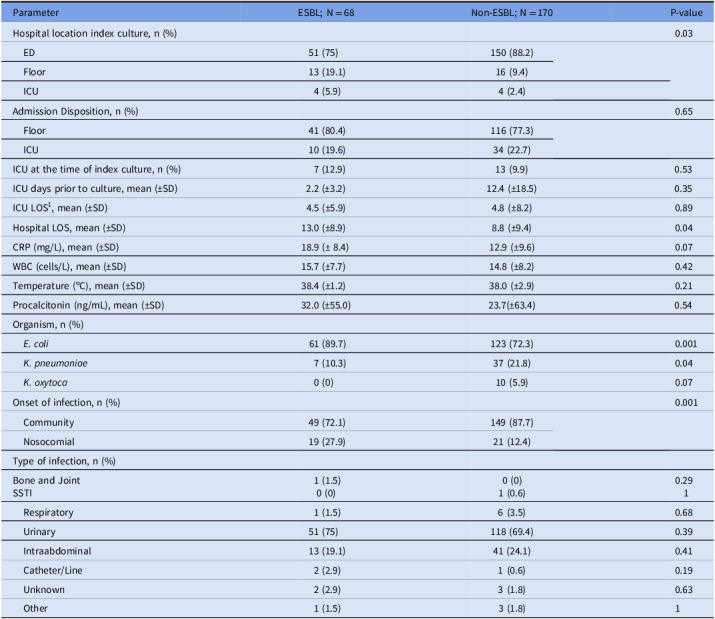 Figure 3
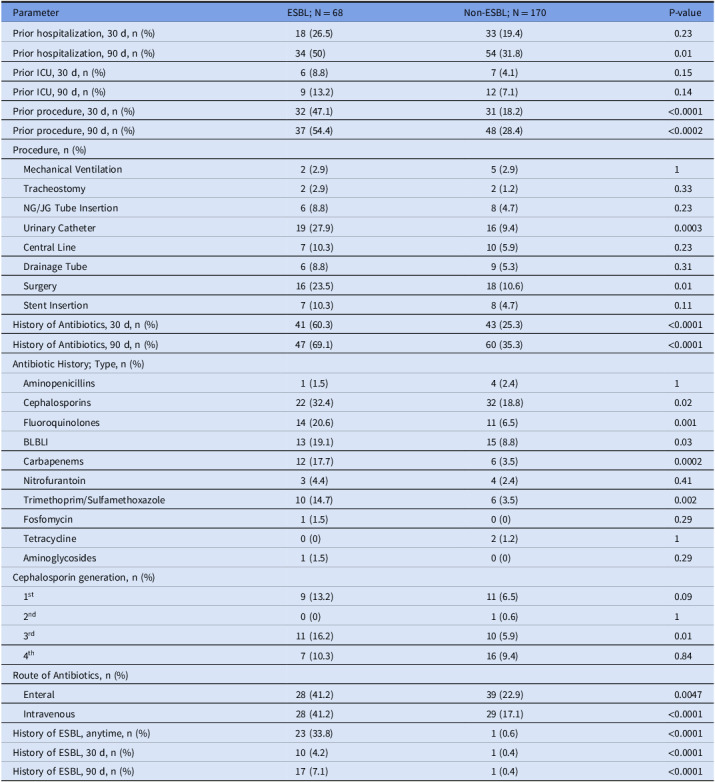 Figure 4
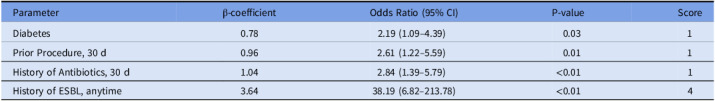 Figure 5
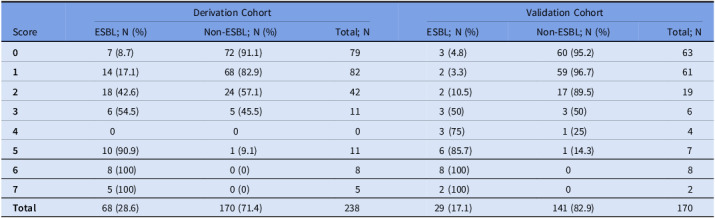 Figure 6
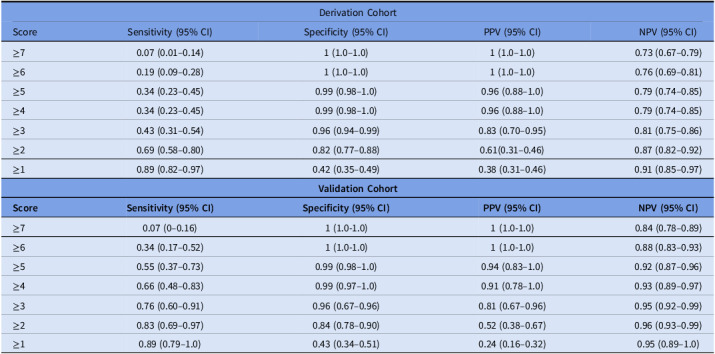 Figure 7
Peer Reviews
No public reviews on file for this paper yet. If you reviewed it on a platform where reviews are public (OpenReview, ICLR, NeurIPS, ICML), you can paste yours below so the community can read it here.
Videos
No videos yet. Explain this paper in a talk, walkthrough, or lecture? Add one.
Taxonomy
TopicsAntibiotic Resistance in Bacteria · Antibiotic Use and Resistance · Bacterial Identification and Susceptibility Testing
Introduction
Extended-spectrum beta-lactamase (ESBL) bloodstream infections (BSI) contribute to increased morbidity, mortality, and healthcare costs.^ 1–4 ^ In 2017, an estimated 197,400 cases of ESBL-producing Enterobacterales infections among hospitalized patients were reported, resulting in 9,100 deaths in the United States with rates steadily increasing since 2012.^ 2 ^ Carbapenems remain the treatment of choice for ESBL BSI. However, increased empiric carbapenem use has spurred the development of carbapenem resistance, prompting the need for ESBL risk factor assessment tools.^ 2,5–10 ^ Early recognition of patients at risk for ESBL BSI can help optimize empiric antimicrobial therapy while avoiding unnecessary use of carbapenems for low-risk patients.
Risk factors for ESBL include prolonged stay in hospital wards, nursing homes, or intensive care units, prior ß-lactam or fluoroquinolone use, and invasive procedures such as placement of indwelling catheters or mechanical ventilation.^ 6,8,10–13 ^ However, risk factors may be institution-specific based on the local patient population.
Devising and implementing a validated, predictive risk score model for ESBL BSI may help with clinical decision-making. Previous studies assessing the use of an ESBL clinical prediction tool have shown reliability in stratifying low and high-risk patients and may prove useful in tailoring empiric therapy.^ 14–21 ^ The aim of our study was to identify institution-specific risk factors for ESBL BSI in order to develop a validated scoring tool that predicts the clinical risk of ESBL for hospitalized patients presenting with either E. coli or Klebsiella spp. BSI.
Methods
Study design and population
This was a single-center, retrospective, case-control study conducted at Advocate Lutheran General Hospital, a 670-bed tertiary teaching hospital located in Park Ridge, Illinois, USA. Adult and pediatric patients were enrolled in a derivation cohort if they were hospitalized and received antimicrobial therapy for a documented E. coli or Klebsiella spp. BSI between August 1, 2019 and June 30, 2020. Patients meeting inclusion criteria were further stratified based on ESBL production. Patients were excluded if they were < 28 days old, their positive blood culture resulted prior to admission or after discharge or had polymicrobial and/or carbapenem-resistant BSI. Patients with documented E. coli and Klebsiella spp. BSI were enrolled in a validation cohort between July 1, 2020 and August 30, 2021. Manual chart review was performed to collect demographic information, comorbidities, microbiologic and antimicrobial history, hospitalization information, and clinical outcomes. Study data were collected and managed using REDCap, a password-protected electronic data capture tool hosted by Advocate Health.^ 22,23 ^ This study was exempt from institutional review board oversight.
Outcomes
The primary outcome was determination of institution-specific risk factors associated with ESBL BSI to develop and validate an ESBL BSI scoring tool.
Definitions
Community-onset BSI was defined as positive blood culture result occurring <48 hours after hospital admission. Utilization of immunosuppressive agents was defined as receipt of calcineurin inhibitors, antimetabolites, or chemotherapy within the past 90 days, and/or corticosteroid usage at doses >20 mg of prednisone or equivalent for ≥2 weeks.^ 24 ^ All available laboratory parameters were assessed for the largest derangement from normal limits within 24 hours of positive blood culture result. Surgery or invasive procedures included any of the following: any type of surgery, insertion of central venous catheters, nasogastric/gastrostomy-jejunostomy tubes, foley catheters, drainage tubes, urinary stent, or tracheostomy/mechanical ventilation. When assessing history of ESBL, no differentiation was made between infection versus colonization.
Microbiology methods
Identification of organisms and susceptibility testing were performed at the institutional microbiology lab (ACL Laboratories). Organism identification was performed by MALDI-TOF mass spectrometry (Vitek MS, bioMérieux, https://www.biomerieux.com). Susceptibilities were interpreted using the Clinical and Laboratory Standards Institute breakpoints.^ 25 ^ Phenotypic testing for ESBL was performed on E. coli, K. pneumoniae, and K. oxytoca using the AST-GN69 VITEK 2 Gram Negative Susceptibility Card (bioMérieux, Durham, NC) on a VITEK 2 automated bacterial identification and susceptibility testing instrument (bioMérieux). By means of double-disk diffusion, the AST-GN69 test card and the VITEK 2 instrument simultaneously assess the inhibitory effects of cefepime, cefotaxime, and ceftazidime alone and in combination with clavulanic acid on the index isolate to determine if ESBL was likely to be present. Confirmatory testing using alternative methods for ESBL detection, such as combination disc methods or E-test ESBL strips, was not performed.
Statistical methods
Univariate and bivariate analyses were performed to evaluate the distribution of the derivation cohort and to compare ESBL and non-ESBL groups. Continuous variables were compared using the Student’s t-test for normally distributed variables and Mann-Whitney U test for non-normally distributed variables. Categorical variables were compared using the Chi-Square Test or Fisher’s Exact Test for cell counts <5. Measures of association include corresponding odds ratios and 95% confidence intervals. A multivariable logistic regression was conducted to identify risk factors associated with ESBL production while controlling for confounders and adjusting for outliers. Variables were included in the model based on a combination of statistical significance (P < 0.05) in the bivariate analysis and clinical importance. A manual model-building process was used to evaluate estimates and verify the importance of each predictor to include in the final model. A Firth regression was run on the final model to address a wide confidence interval due to the likely presence of separation. Statistical significance was established by a two-tailed alpha of 0.05.
Upon identification of risk factors associated with ESBL production, a scored assessment tool was developed to predict risk of ESBL BSI using the beta/integer scheme.^ 26 ^ The scored tool was applied to both a derivation and validation cohort. To validate the prediction score, the area under the receiver-operator characteristics curve (ROC AUC) was assessed for both cohorts. Sensitivity, specificity, positive predictive value (PPV), and negative predictive value (NPV), along with their 95% confidence intervals, were calculated for each cutoff value. The Hosmer-Lemeshow test for goodness-of-fit was used to assess calibration among both cohorts.^ 27 ^ All analyses were performed using SAS statistical software (Version 9.4; SAS Institute, Cary, NC).
Results
Baseline characteristics
(i) Derivation cohort: A total of 238 patients met inclusion criteria, 68 with ESBL BSI and 170 with non-ESBL BSI. Most patients in the overall cohort were of white ethnicity (57, 83.8% versus 133, 78.2%), ≥65 years of age (51, 75% versus 118, 69.4%), and immunocompetent (61, 89.7% versus 153, 90%). Patients with ESBL BSI were more likely to present from a skilled nursing facility (21, 30.9% versus 32, 18.8% P = 0.04) and have a history of diabetes (36, 52.9% versus 60, 35.3% P = 0.01). Otherwise, no significant differences were observed in baseline characteristics (Table 1). Among the total cohort, the most common organisms isolated were E. coli (184, 77.3%) and K. pneumoniae (44, 18.5%). Urinary tract (169, 71%) and intra-abdominal (54, 22.7%) were the most common infection sources. No differences were observed between groups for organism isolation and infection source. Infections were more likely to be community-onset (198, 83.2%) with index culture draw occurring in the emergency department (51, 75% versus 150, 88.2% P = 0.03). Most patients were admitted to a general nursing floor (41, 80.4% versus 116, 77.3%), and patients with ESBL BSI had a significantly longer hospital length of stay (13 d versus 8.8 d P = 0.04). No other differences in laboratory parameters at time of blood culture draw or patient disposition were observed (Table 2).
Table 1.Baseline characteristics and laboratory parameters – derivation cohortParameterESBL; N = 68Non-ESBL; N = 170P-valueAge (years), mean (±SD)73.0 (±13.2)72.9 (±15.9)0.71 <18 yr0 (0)2 (1.2) 18–64 yr17 (25)50 (29.4) ≥65 yr51 (75)118 (69.4)Male, n (%)30 (44.1)86 (50.6)0.37Ethnicity, n (%)0.59 African American1 (1.5)2 (1.2) Asian4 (5.9)19 (11.2) Hispanic/Latino5 (7.4)15 (8.8) White57 (83.8)133 (78.2) Other1 (1.5)1 (0.6)Smoking History, n (%)23 (33.8)38 (22.4)0.07ETOH History, n (%)4 (5.9)10 (5.9)>0.99Trauma History, n (%)43 (63.2)90 (52.9)0.15Skilled Nursing Facility, n (%)21 (30.9)32 (18.8)0.04Diet, n (%)0.65 NPO5 (7.4)9 (5.3) TPN2 (2.9)2 (1.2) Tube feeds4 (5.9)12 (7.1) General Diet57 (83.8)147 (86.5)CCI score, mean (±SD)5.3 (±2.2)4.8 (±2.4)0.12APACHE II score, mean (±SD)16 (±5.4)14.9 (±8.4)0.24PITT Bacteremia score, mean (±SD)1.5 (±1.4)1.6 (±2.0)0.91Immunocompromised, n (%)7 (10.3)17 (10)0.95Type, n (%) Transplant Medication2 (2.9)4 (2.4) Chemotherapy6 (8.8)14 (8.2)0.88 Steroid0 (0)4 (2.4)0.58 Transplant Medication, n (%) CNI2 (2.9)2 (1.2)0.32 Antimetabolite1 (1.5)3 (1.8)1 mTOR inhibitor1 (1.5)1 (0.6)0.49Comorbidities, n (%) Diabetes36 (52.9)60 (35.3)0.01 Hypertension48 (70.6)113 (66.5)0.54 Benign prostatic hyperplasia7 (10.3)28 (16.5)0.22 Structural biliary/urinary6 (8.8)5 (2.9)0.08 Chronic heart disease16 (23.5)31 (18.2)0.35 Liver disease, no cirrhosis0 (0)1 (0.6)1 Liver disease, cirrhosis4 (5.9)5 (2.9)0.28 COPD13 (19.1)19 (11.2)0.1 CKD, no dialysis10 (14.7)24 (14.1)0.91 CKD, dialysis3 (4.4)6 (3.5)0.72 Cancer, metastatic3 (4.4)11 (6.5)0.76 Cancer, non-metastatic12 (17.7)25 (14.7)0.57 Hematologic malignancy6 (8.8)11 (6.5)0.52 Solid tumor13 (19.1)36 (21.2)0.72 HIV/AIDS1 (1.5)0 (0)0.29 SARS-CoV-2 positive3 (4.4)2 (1.2)0.14*AIDS: acquired immunodeficiency syndrome; CCI: Charlson comorbidity index; COPD: chronic obstructive pulmonary disease; CKD: chronic kidney disease; ETOH: alcohol abuse; HIV: human immunodeficiency virus; NPO: nothing by mouth; TPN: total parenteral nutrition^¥^For patients who qualified for multiple factors, patients were counted for each category they met.
Table 2.Hospital admission data – derivation cohortParameterESBL; N = 68Non-ESBL; N = 170P-valueHospital location index culture, n (%)0.03 ED51 (75)150 (88.2) Floor13 (19.1)16 (9.4) ICU4 (5.9)4 (2.4)Admission Disposition, n (%)0.65 Floor41 (80.4)116 (77.3) ICU10 (19.6)34 (22.7)ICU at the time of index culture, n (%)7 (12.9)13 (9.9)0.53ICU days prior to culture, mean (±SD)2.2 (±3.2)12.4 (±18.5)0.35ICU LOS^⁑^, mean (±SD)4.5 (±5.9)4.8 (±8.2)0.89Hospital LOS, mean (±SD)13.0 (±8.9)8.8 (±9.4)0.04CRP (mg/L), mean (±SD)18.9 (± 8.4)12.9 (±9.6)0.07WBC (cells/L), mean (±SD)15.7 (±7.7)14.8 (±8.2)0.42Temperature (^o^C), mean (±SD)38.4 (±1.2)38.0 (±2.9)0.21Procalcitonin (ng/mL), mean (±SD)32.0 (±55.0)23.7(±63.4)0.54Organism, n (%) E. coli 61 (89.7)123 (72.3)0.001 K. pneumoniae 7 (10.3)37 (21.8)0.04 K. oxytoca 0 (0)10 (5.9)0.07Onset of infection, n (%)0.001 Community49 (72.1)149 (87.7) Nosocomial19 (27.9)21 (12.4)Type of infection, n (%)Bone and JointSSTI1 (1.5)0 (0)0 (0)1 (0.6)0.291 Respiratory1 (1.5)6 (3.5)0.68 Urinary51 (75)118 (69.4)0.39 Intraabdominal13 (19.1)41 (24.1)0.41 Catheter/Line2 (2.9)1 (0.6)0.19 Unknown2 (2.9)3 (1.8)0.63 Other1 (1.5)3 (1.8)1*CRP: c-reactive protein; ED: emergency department; ICU: intensive care unit; LOS: length of stay; SSTI: Skin and soft tissue infection; WBC: white blood cell count^⁑^Donated only for patients admitted into the intensive care unit.^¥^For patients who qualified for multiple factors, patients were counted for each category they met.
Patients presenting with ESBL BSI were more likely to have a prior hospitalization in the previous 90 days (34, 50% versus 54, 31.8% P = 0.01), prior procedure in the past 30 days (32, 47.1% versus 31, 18.2% P < 0.0001) and 90 days (37, 54.4% versus 48, 28.4% P < 0.0002), and history of antibiotic use in the past 30 (41, 60.3% versus 43, 25.3% P < 0.0001) and 90 days (47, 69.1% versus 60, 35.3% P < 0.0001). A detailed breakdown of previous antibiotic exposure is in Table 3. Among patients with a history of prior procedure, those presenting with ESBL BSI were more likely to have a history of urinary catheter insertion (19, 27.9% versus 16, 9.4% P = 0.0003) or surgical procedure (16, 23.5% versus 18, 10.6% P = 0.01) with no differences observed for other invasive procedures. There was a statistically significant difference between groups for all-time history of ESBL-producing organism (23, 33.8% versus 1, 0.6% P < 0.0001). A multivariate analysis demonstrated that diabetes (OR 2.19; 95% CI 1.09–4.39), prior procedure in the previous 30 days (OR 2.61; 95% CI 1.22–5.59), history of antibiotic usage in the previous 30 days (OR 2.84; 95% CI 1.39–5.79), and history of ESBL infection regardless of timeframe (OR 38.19; 95% CI 6.82–213.78) were independent risk factors for the emergence of ESBL BSI (Table 4).
Table 3.Univariate analysis of clinical characteristics – derivation cohortParameterESBL; N = 68Non-ESBL; N = 170P-valuePrior hospitalization, 30 d, n (%)18 (26.5)33 (19.4)0.23Prior hospitalization, 90 d, n (%)34 (50)54 (31.8)0.01Prior ICU, 30 d, n (%)6 (8.8)7 (4.1)0.15Prior ICU, 90 d, n (%)9 (13.2)12 (7.1)0.14Prior procedure, 30 d, n (%)32 (47.1)31 (18.2)<0.0001Prior procedure, 90 d, n (%)37 (54.4)48 (28.4)<0.0002Procedure, n (%) Mechanical Ventilation2 (2.9)5 (2.9)1 Tracheostomy2 (2.9)2 (1.2)0.33 NG/JG Tube Insertion6 (8.8)8 (4.7)0.23 Urinary Catheter19 (27.9)16 (9.4)0.0003 Central Line7 (10.3)10 (5.9)0.23 Drainage Tube6 (8.8)9 (5.3)0.31 Surgery16 (23.5)18 (10.6)0.01 Stent Insertion7 (10.3)8 (4.7)0.11History of Antibiotics, 30 d, n (%)41 (60.3)43 (25.3)<0.0001History of Antibiotics, 90 d, n (%)47 (69.1)60 (35.3)<0.0001Antibiotic History; Type, n (%) Aminopenicillins1 (1.5)4 (2.4)1 Cephalosporins22 (32.4)32 (18.8)0.02 Fluoroquinolones14 (20.6)11 (6.5)0.001 BLBLI13 (19.1)15 (8.8)0.03 Carbapenems12 (17.7)6 (3.5)0.0002 Nitrofurantoin3 (4.4)4 (2.4)0.41 Trimethoprim/Sulfamethoxazole10 (14.7)6 (3.5)0.002 Fosfomycin1 (1.5)0 (0)0.29 Tetracycline0 (0)2 (1.2)1 Aminoglycosides1 (1.5)0 (0)0.29Cephalosporin generation, n (%) 1^st^ 9 (13.2)11 (6.5)0.09 2^nd^ 0 (0)1 (0.6)1 3^rd^ 11 (16.2)10 (5.9)0.01 4^th^ 7 (10.3)16 (9.4)0.84Route of Antibiotics, n (%) Enteral28 (41.2)39 (22.9)0.0047 Intravenous28 (41.2)29 (17.1)<0.0001History of ESBL, anytime, n (%)23 (33.8)1 (0.6)<0.0001History of ESBL, 30 d, n (%)10 (4.2)1 (0.4)<0.0001History of ESBL, 90 d, n (%)17 (7.1)1 (0.4)<0.0001*BLBLI: beta lactam beta lactamase inhibitor; ESBL: extended-spectrum beta lactamase; ICU: intensive care unit; JG: gastrostomy-jejunostomy; NG: nasogastric^¥^For patients who qualified for multiple factors, patients were counted for each category they met.
Table 4.Multivariate logistic regression analysis assessing predictors of ESBL infection with corresponding point values – derivation cohortParameterβ-coefficientOdds Ratio (95% CI)P-valueScoreDiabetes0.782.19 (1.09–4.39)0.031Prior Procedure, 30 d0.962.61 (1.22–5.59)0.011History of Antibiotics, 30 d1.042.84 (1.39–5.79)<0.011History of ESBL, anytime3.6438.19 (6.82–213.78)<0.014ESBL, extended-spectrum beta lactamase
(ii) Validation Cohort: From July 2020 through August 2021 a total of 170 patients were included in the validation cohort, 29 (17.1%) were ESBL. Complete baseline characteristics were not collected for this cohort. Instead, risk factors from the derivation cohort found to be independent predictors of ESBL were applied. Compared with the derivation cohort, those with ESBL BSI in the validation cohort had a lower incidence of diabetes (10, 34.5%) and prior procedure in the past 30 days (12, 41.4%) but a higher incidence of antibiotic usage in the previous 30 days (21, 72.4%) and all-time history of ESBL infection (19, 65.5%).
Construction and validation of a predictive scoring tool
(i) Derivation cohort: A weighted score was assigned to each risk factor based on results from the multivariate analysis for a maximum score of 7 (Table 4). The distribution of overall scores between ESBL BSI and non-ESBL BSI is summarized in Table 5. Scores of 0 and 1 were found primarily in non-ESBL BSI while scores of 6 and 7 were found exclusively in ESBL BSI. The ROC AUC was 0.81 (95% CI 0.7477–0.8745), which indicates good discrimination performance of the model suggesting that it performs well in discriminating risk at both validations sets (Figure 1). The results of the Hosmer-Lemshow chi-squared testing (χ^2^ = 1.19, P = 0.754) suggest good calibration of the proposed scoring tool.
Table 5.Distribution of overall scores in the risk assessment tool - derivation and validation cohortsScoreDerivation CohortValidation CohortESBL; N (%)Non-ESBL; N (%)Total; NESBL; N (%)Non-ESBL; N (%)Total; N 0 7 (8.7)72 (91.1)793 (4.8)60 (95.2)63 1 14 (17.1)68 (82.9)822 (3.3)59 (96.7)61 2 18 (42.6)24 (57.1)422 (10.5)17 (89.5)19 3 6 (54.5)5 (45.5)113 (50)3 (50)6 4 0003 (75)1 (25)4 5 10 (90.9)1 (9.1)116 (85.7)1 (14.3)7 6 8 (100)0 (0)88 (100)08 7 5 (100)0 (0)52 (100)02 Total 68 (28.6)170 (71.4)23829 (17.1)141 (82.9)170ESBL, extended-spectrum beta lactamase
Figure 1.Receiver-operator characteristics curves - derivation and validation cohorts .
As demonstrated by the risk score performance (Table 6), a low cutoff displayed high sensitivity but lost specificity whereas a high cutoff significantly increased specificity but inversely impacted sensitivity. Defining high-risk ESBL BSI as a score of ≥3, the sensitivity was low (42.7%), while retaining excellent specificity (96.5%). The positive predictive value (PPV) and negative predictive value (NPV) had an inverse relationship with a decrease in PPV and an increase in NPV with a higher calculated risk score. The cutoff level of ≥3 was associated with a PPV and NPV of 82.9% and 80.8%, respectively.
Table 6.Risk score performance – derivation and validation cohortsDerivation CohortScoreSensitivity (95% CI)Specificity (95% CI)PPV (95% CI)NPV (95% CI)≥70.07 (0.01–0.14)1 (1.0–1.0)1 (1.0–1.0)0.73 (0.67–0.79)≥60.19 (0.09–0.28)1 (1.0–1.0)1 (1.0–1.0)0.76 (0.69–0.81)≥50.34 (0.23–0.45)0.99 (0.98–1.0)0.96 (0.88–1.0)0.79 (0.74–0.85)≥40.34 (0.23–0.45)0.99 (0.98–1.0)0.96 (0.88–1.0)0.79 (0.74–0.85)≥30.43 (0.31–0.54)0.96 (0.94–0.99)0.83 (0.70–0.95)0.81 (0.75–0.86)≥20.69 (0.58–0.80)0.82 (0.77–0.88)0.61(0.31–0.46)0.87 (0.82–0.92)≥10.89 (0.82–0.97)0.42 (0.35–0.49)0.38 (0.31–0.46)0.91 (0.85–0.97) Validation Cohort
Score
Sensitivity (95% CI)
Specificity (95% CI)
PPV (95% CI)
NPV (95% CI) ≥70.07 (0–0.16)1 (1.0-1.0)1 (1.0-1.0)0.84 (0.78–0.89)≥60.34 (0.17–0.52)1 (1.0-1.0)1 (1.0-1.0)0.88 (0.83–0.93)≥50.55 (0.37–0.73)0.99 (0.98–1.0)0.94 (0.83–1.0)0.92 (0.87–0.96)≥40.66 (0.48–0.83)0.99 (0.97–1.0)0.91 (0.78–1.0)0.93 (0.89–0.97)≥30.76 (0.60–0.91)0.96 (0.67–0.96)0.81 (0.67–0.96)0.95 (0.92–0.99)≥20.83 (0.69–0.97)0.84 (0.78–0.90)0.52 (0.38–0.67)0.96 (0.93–0.99)≥10.89 (0.79–1.0)0.43 (0.34–0.51)0.24 (0.16–0.32)0.95 (0.89–1.0)
(ii) Validation cohort: The distribution of overall scores of ESBL BSI compared to non-ESBL BSI is summarized in Table 5. Similarly, as in the derivation cohort, scores of 0, 1, and 2 were primarily associated with non-ESBL BSI while scores of 6 and 7 were found exclusively in ESBL BSI. As demonstrated in Figure 1, when the ESBL prediction tool was applied, it exhibited a strong predictive power (ROC AUC = 0.88, 95% CI = 0.7909 – 0.9741) and a good calibration (Hosmer-Lemeshow χ^2^ = 4.66, P = 0.19). The predictive effects of the validation cohort were comparable to those observed in the derivation cohort (Table 6).
Discussion
The widespread use of broad-spectrum antibiotics has led to an increase in ESBL infections associated with a negative impact on patient outcomes.^ 1–10 ^ Early identification of patients at increased risk of ESBL is an important measure to ensure both time to optimal antibiotic therapy and consideration for isolation in hospitalized patients. Our results demonstrate that a simple clinical prediction tool based on institution-specific risk factors can be created to identify admitted patients most at risk of harboring ESBL BSI.
Our study showed an overall higher proportion of ESBL-producing isolates within our institution compared to previously reported data.^ 6–13 ^ Similar to other studies, we found that the predominant source of ESBL BSI was urinary followed by intra-abdominal.^ 6,7,9,11 ^ Specific antimicrobial classes have been independently associated with ESBL-producing organisms including fluoroquinolone and β-lactam agents, specifically oxyimino- β-lactams and third/fourth-generation cephalosporins.^ 6,12,13,28 ^ Our study found an association between ESBL production and use of third-generation cephalosporins, fluoroquinolones, β-lactam β-lactamase inhibitors, carbapenems, and uniquely trimethoprim-sulfamethoxazole. However, multivariate analysis did not find any single antimicrobial class to be an individual independent risk factor for ESBL production but rather found a general 30-day history of antimicrobial utilization as a risk factor.
Many studies have shown that patients with a history of urinary catheterization increased the risk of ESBL infection.^ 8,13,28 ^ Although ESBL patients in our cohort were more likely to have a history of urinary catheter insertion or invasive surgery, these were not identified as independent risk factors. However, a 30-day history of any invasive procedure was found to be a risk factor in multivariate analysis. Additionally, a review by Trecarichi et al. found that admission from long-term care facilities has been found to be strongly associated with non-nosocomial ESBL BSI.^ 8 ^ This similarity was demonstrated in our study as most of the infections were community-onset, and nearly one-third of patients with ESBL BSI were admitted from a skilled nursing facility.
Unique to our study was a history of diabetes being identified as an independent risk factor for ESBL BSI. In a study conducted by Rodriguez-Baño et al. describing clinical features of infections caused by ESBL in nonhospitalized patients, researchers found five independent risk factors associated with ESBL, among them diabetes mellitus.^ 29 ^ To our knowledge this is the only known study demonstrating diabetes mellitus as an independent risk factor. However, in contrast to our study, Rodriguez-Baño et al. found the emergent cause of ESBL to be urinary tract infection whereas only 6 patients were bacteremic.^ 29 ^ Our study suggests that diabetes mellitus may be considered a risk factor for community-onset ESBL BSI.
Demonstrated by our results and review of available literature, risk factors for ESBL seem to be institution-specific, which is valuable in identifying targets to influence clinical decision-making. As discussed by Trecarichi et al., there is a large heterogeneity among studies markedly regarding species of Enterobacterales studied, acquisition of BSI, and study design which may explain the differences seen in epidemiology.^ 8 ^ Given that there is no standard recommendation for identification of ESBL, risk factors are likely influenced by institution-specific factors and increased intestinal colonization with multidrug-resistant organisms following recent use of antibiotic therapy.^ 20 ^ Additional considerations for patients presenting from the community with limited healthcare-associated contact may be necessary.
Given recent concerns about emerging carbapenem-resistant isolates, there is a pressing need for an accessible risk stratification tool that can be used at admission.^ 2 ^ Our study was conducted as a carbapenem-sparing antibiotic stewardship initiative for infections warranting empiric broad-spectrum therapy. Our scoring tool is unique to our inpatient population, which consists of primarily elderly patients residing at a skilled nursing facility and was constructed from variables that are readily available from the medical record at the time of admission, enhancing its practicality. Our study provided a good discrimination of risks in both independent derivation and validation cohorts with comparable ROC AUCs. These results are comparable to those reported by both Tumbarello et al. and Jones et al., which conclude that the high specificity of a risk assessment tool could improve targeting patients at high risk for ESBL BSI.^ 20,21 ^ In another study conducted by Lee et al., a 4-measure scoring algorithm was proposed to identify community-onset ESBL among patients in the emergency department.^ 19 ^ This algorithm included recent antimicrobial use or invasive procedure, nursing home resident, and frequent emergency department visits where designated scores of ≥2 retained a high sensitivity, high specificity, and good discrimination to identify patients at risk for ESBL.^ 19 ^ A threshold of ≥3 for result interpretation was chosen for our scoring tool to allow for other risk factors in the predication model to be considered aside from a history of ESBL. While implementation of newer technology decreases time to organism identification and resistance marker detection, the focus of our study remains for institutions with limited rapid diagnostics. The results of our study could aid in initiation of rational, empiric antimicrobial therapy by frontline providers while susceptibility results are pending, even in the absence of history of ESBL.
Our study has several limitations. First, the data set was a retrospective review which included a relatively low sample size and narrow time range. This may have underestimated the role of certain risk factors and limited the amount of independent risk factors analyzed in multivariate analysis. Additionally, applicability of these results to the pediatric population is limited. Since our data were exclusively analyzed from one tertiary hospital within a large integrated system, the generalizability of these results may be limited since risk factors are specific to the region or institution. Our study only interpreted ESBL production based off phenotypic testing without a genotypic confirmation, which could skew the results of confirmed ESBL isolates. Finally, interpretation of results in patients with a score ≤2 is limited. While sensitivity and NPV remain high for both cohorts, utilizing a score ≤2 may overcall ESBL risk and lead to overutilization of broad-spectrum antimicrobial therapy active against ESBL. Therefore, a more appropriate strategy for patients who score ≤2 using this assessment tool is to consider agents likely active against ESBL for patients at high risk for mortality, including those that are critically ill, with a plan to de-escalate once supporting microbiological data becomes available.
In conclusion, we have identified and analyzed independent risk factors associated with ESBL BSI. Using these data, a novel 7-point clinical predication tool was developed based on four easy-to-define variables readily available upon chart review. This prediction model may be used to reliably identify hospitalized patients that likely harbor ESBL upon organism identification. Proper use of this tool can minimize the time required to identify patients at risk for these organisms, allowing for decreased time to optimal therapy, and rapid infection prevention measures. Future efforts should focus on analyzing applicable ESBL BSI risk factors at other institutions given variability across regions and patient populations to devise a generalizable risk assessment tool that can be modified to fit institution-specific factors. This tool should be utilized as a carbapenem-sparing initiative, emphasizing the clinical application of such tools for empirical treatment decision-making as the utility in this setting requires further validation.
The reference list from the paper itself. Each links out to its DOI / PubMed record.
- 1Chen Q , Guifeng M , Huijyn C et al. Risk factors and diagnostic markers for Escherichia coli bloodstream infection in older patients. Arch Gerontol Geriatr 2021;93:104315.33310397 10.1016/j.archger.2020.104315 · doi ↗ · pubmed ↗
- 2Centers for Disease Control and Prevention. Antibiotic Resistance Threats in the United States, 2019. Atlanta, GA: U.S. Department of Health and Human Services, CDC; 2019. Access Sept 6, 2021.
- 3Giske CG , Monnet DL , Cars O , Carmeli Y . Re Act-action on antibiotic resistance. clinical and economic impact of common multidrug-resistant Gram-negative bacilli. Antimicrob Agents Chemother 2008;52:813–821.18070961 10.1128/AAC.01169-07PMC 2258516 · doi ↗ · pubmed ↗
- 4Tumbarello M , Spanu T , Di Bidino R et al. Costs of bloodstream infections caused by Escherichia coli and influence of extended-spectrum-beta-lactamase production and inadequate initial antibiotic therapy. Antimicrob Agents Chemother 2010;54:4085–4091.20660675 10.1128/AAC.00143-10PMC 2944559 · doi ↗ · pubmed ↗
- 5Denis B , Lafaurie M , Donay JL et al. Prevalence, risk factors, and impact on clinical outcome of extended-spectrum beta-lactamase-producing Escherichia coli bacteremia: a five-year study. Int J Infect Dis 2015;39:1–6.26189774 10.1016/j.ijid.2015.07.010 · doi ↗ · pubmed ↗
- 6Nakai H , Hagihara M , Kato H et al. Prevalence and risk factors of infections caused by extended-spectrum B-lactamase (ESBL)-producing Enterobacteriaceae. J Infect Chemother 2016;22:319–326.26968486 10.1016/j.jiac.2016.02.004 · doi ↗ · pubmed ↗
- 7Rodriguez-Baño J , Picon E , Gijon P et al. Community-onset bacteremia due to extended-spectrum B-Lactamase-producing Escherichia coli: risk factors and prognosis. Clin Infect Dis 2010;50:40–48.19995215 10.1086/649537 · doi ↗ · pubmed ↗
- 8Trecarichi EM , Cauda R , Tumbarello M . Detecting risk and predicting patient mortality in patients with extended-spectrum B-lactamase-producing Enterobacteriaceae bloodstream infections. Future Microbiol 2012;7:1173–1189.23030423 10.2217/fmb.12.100 · doi ↗ · pubmed ↗