Energy estimation methods for positron emission tomography detectors composed of multiple scintillators
Hyeong Seok Shim, Min Jeong Cho, Jae Sung Lee

TL;DR
This paper compares two methods for improving energy estimation in PET detectors using multiple scintillators, finding that artificial neural networks outperform traditional matrix-based approaches.
Contribution
The study introduces and evaluates two novel energy estimation methods for PET detectors with multiple scintillators, highlighting the superior performance of artificial neural networks.
Findings
Artificial neural networks (ANNs) consistently outperformed pseudo-inverse matrix methods in energy estimation accuracy across various scintillator combinations.
Integral-based energy labels improved ANN performance more than amplitude-based labels.
The pseudo-inverse matrix method showed negligible differences between integral-based and amplitude-based energy labels.
Abstract
The performance and image quality of positron emission tomography (PET) systems can be enhanced by strategically employing multiple different scintillators, particularly those with different decay times. Two cutting-edge PET detector technologies employing different scintillators with different decay times are the phoswich detector and the emerging metascintillator. In PET imaging, accurate and precise energy measurement is important for effectively rejecting scattered gamma-rays and estimating scatter distribution. However, traditional measures of light output, such as amplitude or integration values of photosensor output pulses, cannot accurately indicate the deposit energy of gamma-rays across multiple scintillators. To address these issues, this study explores two methods for energy estimation in PET detectors that employ multiple scintillators. The first method uses pseudo-inverse…
Genes, proteins, chemicals, diseases, species, mutations and cell lines named across the full text — each resolved to its canonical identifier and authoritative record.
Click any figure to enlarge with its caption.
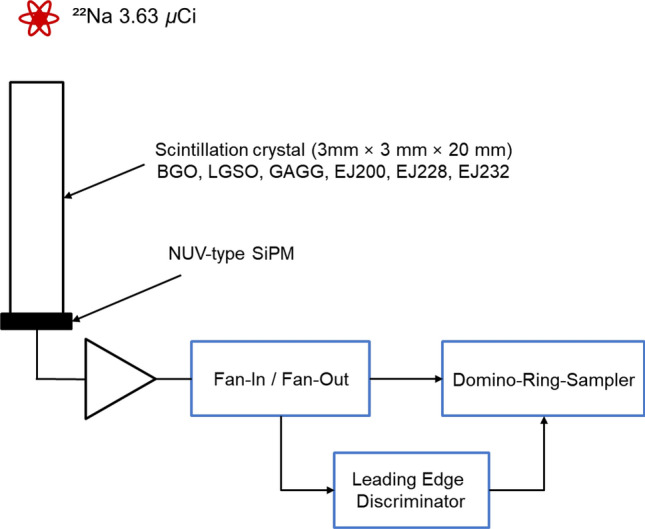 Figure 1
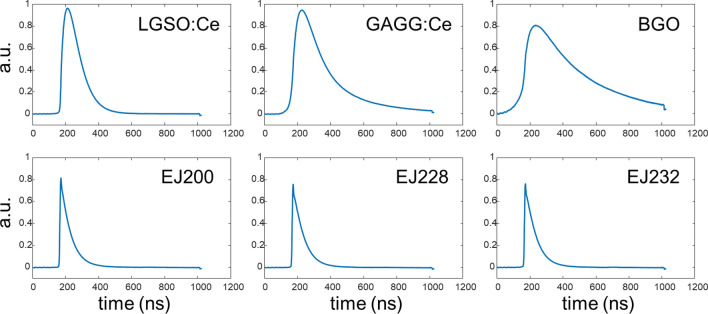 Figure 2
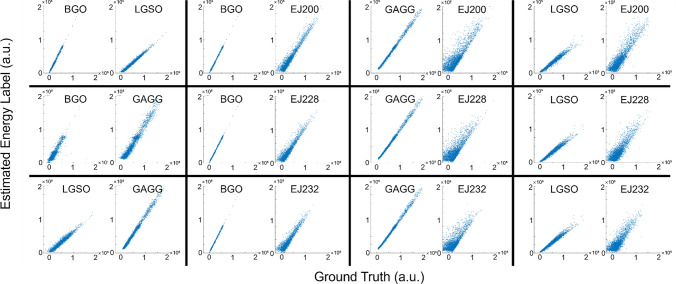 Figure 3
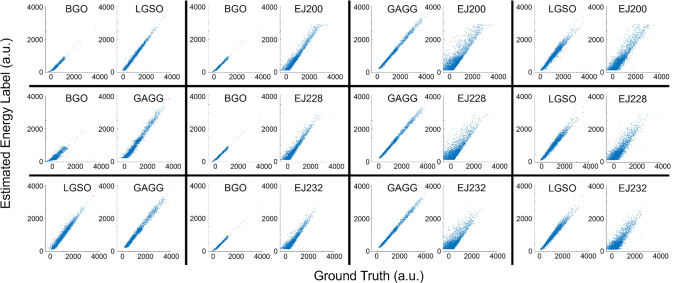 Figure 4
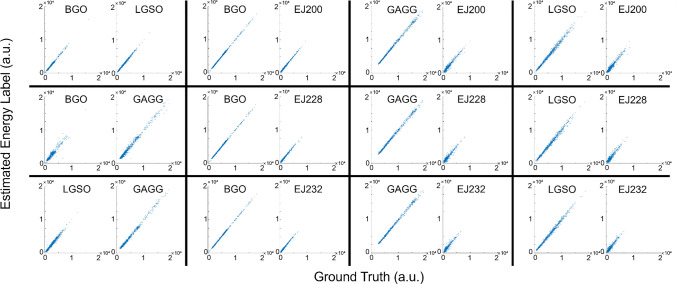 Figure 5
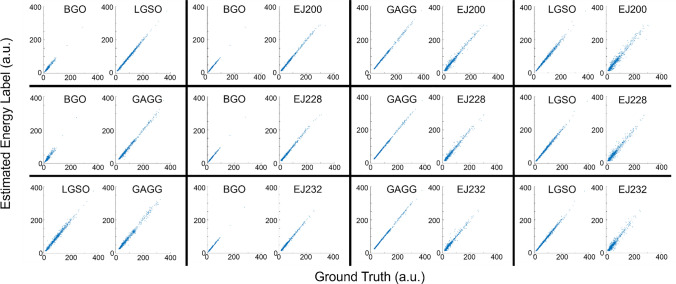 Figure 6
- —Seoul National University
Peer Reviews
No public reviews on file for this paper yet. If you reviewed it on a platform where reviews are public (OpenReview, ICLR, NeurIPS, ICML), you can paste yours below so the community can read it here.
Videos
No videos yet. Explain this paper in a talk, walkthrough, or lecture? Add one.
Taxonomy
TopicsMedical Imaging Techniques and Applications · Radiation Detection and Scintillator Technologies · Advanced X-ray and CT Imaging
Introduction
Positron emission tomography (PET) stands as a pivotal biomedical imaging tool, enabling the evaluation of the spatiotemporal distribution of positron-emitting radiotracers by detecting two 511 keV gamma-rays emitted from the body following radiotracer injection [5, 26]. PET systems employ indirect radiation detectors consisting of scintillators and photosensors to capture and analyze the gamma-rays, utilizing their energy, position, and timing information to produce high-quality tomographic images [17, 25]. State-of-the-art clinical PET scanners currently utilize a single type of lutetium oxide scintillator characterized by high density, effective atomic number, light yield, and fast decay time. However, the performance and image quality of PET systems can be further enhanced by employing multiple different scintillators, particularly those exhibiting different decay times.
One of the advanced PET detector technologies employing different scintillators with different decay times is the phoswich detector, which is used to determine the depth-of-interaction (DOI) of gamma-rays [3, 6, 8, 11, 12, 27, 32, 37, 41]. DOI measurements improve the uniformity of radial spatial resolution by reducing parallax error occurring at the peripheral field-of-view of ring-type PET systems [9, 17]. DOI information is also useful for enhancing the timing resolution of PET detectors by mitigating the photon transit time variation [7, 33, 36]. In phoswich PET detectors, different scintillators are stacked on photosensors, and DOI is determined through surrogates of decay time, such as the ratio of the integrated charges in the head and tail parts of the scintillation pulse.
Another PET detector technology that utilizes different scintillators with different decay times is the emerging metascintillator [14, 15, 23, 39]. In the metascintillator, thin layers of heavy, dense but slow scintillators are alternated with those of light but fast scintillators at several 100 μm intervals, taking advantages of both materials (high stopping power and fast photon generation) simultaneously.
In PET imaging, accurate and precise energy measurement is important because scattered gamma-rays are rejected and scatter distribution is estimated using energy information. A significant number of events measured in 3D PET are subject to Compton scattering, and substantial inter-crystal scattering events occur in high-resolution PET detectors [19, 22, 34, 38]. The accuracy of scatter correction algorithms based on Monte Carlo or analytic simulation [1, 10, 40] and the first interaction position estimation algorithm of inter-crystal scattering [4, 18, 20, 28] is highly dependent on the energy resolution of the PET detectors. When using a single scintillator type in PET detectors, the number of scintillation photons and the amplitude or integration value of photosensor output pulses are linearly proportional to the gamma-ray energy deposited in the scintillator. However, the slope of this linear relationship between light output and deposit energy varies depending on the scintillator type. Therefore, simple measures of light output, such as the amplitude or integration value of photosensor output pulses, cannot accurately indicate the deposit energy of gamma-rays across multiple scintillators.
In phoswich detectors, single or multiple scattering across different scintillators results in mixed signal waveforms, making energy and DOI estimation difficult through conventional approaches. In metascintillators, recoil electrons generated mainly from heavy and dense scintillators transverse different scintillators because their ionization trajectories are longer than the thickness of alternating scintillator slabs, emitting light photons with different timing properties [15, 39]. To the best of our knowledge, no proper energy estimation method for experimental data has yet been proposed for meta-scintillators generating mixed waveforms. Several methods using GATE simulation or time-correlated single photon counting (TCSPC) set up which offers ground truth of energy have been proposed [13, 24]. However, in actual experiments, it is challenging to obtain ground truth for the energy deposited in each crystal, making it difficult to train the network.
To address these issues, this study explores two methods for energy estimation in PET detectors utilizing multiple scintillators. The first method uses pseudo-inverse matrix composed of the unique pulse profile of each crystal, while the second employs an artificial neural network (ANN) to estimate the energy deposited in each crystal. The effectiveness of the proposed methods was evaluated experimentally using three heavy and dense inorganic scintillation crystals (BGO, LGSO, and GAGG) and three fast plastic scintillators (EJ200, EJ224, and EJ232). In the following sections, we will formulate the problem and present how to solve it using pseudo-inverse and ANN.
Materials and methods
Problem formulation
The scintillation pulse from a single type scintillator can be formulated as following equation:
\documentclass[12pt]{minimal} \usepackage{amsmath} \usepackage{wasysym} \usepackage{amsfonts} \usepackage{amssymb} \usepackage{amsbsy} \usepackage{mathrsfs} \usepackage{upgreek} \setlength{\oddsidemargin}{-69pt} \begin{document}$$ f_{scintillation} \left( t \right) = \frac{E \times LY}{{\tau_{{{\text{decay}}}} - \tau_{{{\text{rise}}}} }}\left( {{\text{e}}^{{ - \frac{{\text{t}}}{{{\uptau }_{{{\text{decay}}}} }}}} - {\text{e}}^{{ - \frac{{\text{t}}}{{{\uptau }_{{{\text{rise}}}} }}}} } \right), $$\end{document}where E is deposited energy of gamma-ray, LY light yield, t time, τdecay decay time constant, and τrise rising time constant.
Because all parameters except for E and t are constant in this formula, the peak amplitude and time integral of the scintillation pulse are linearly proportional to the energy E deposited in scintillator, thus allowing them to be used as energy surrogates.
Meanwhile, the mixed scintillation pulse from two scintillators can be formulated as following equation:
\documentclass[12pt]{minimal} \usepackage{amsmath} \usepackage{wasysym} \usepackage{amsfonts} \usepackage{amssymb} \usepackage{amsbsy} \usepackage{mathrsfs} \usepackage{upgreek} \setlength{\oddsidemargin}{-69pt} \begin{document}$$\begin{aligned} f_{mixed - scintillation} \left( t \right) &= \frac{{E_{1} \times LY_{1} }}{{\tau_{{{\text{decay}}1}} - \tau_{{{\text{rise}}1}} }}\left( {{\text{e}}^{{ - \frac{{\text{t}}}{{{\uptau }_{{{\text{decay}}1}} }}}} - e^{{ - \frac{{\text{t}}}{{{\uptau }_{{{\text{rise}}1}} }}}} } \right) \\ &\quad+ \frac{{\left( {E_{{{\text{total}}}} - E_{1} } \right) \times LY_{2} }}{{\tau_{{{\text{decay}}2}} - \tau_{{{\text{rise}}2}} }}\left( {{\text{e}}^{{ - \frac{{\text{t}}}{{{\uptau }_{{{\text{decay}}2}} }}}} - {\text{e}}^{{ - \frac{{\text{t}}}{{{\uptau }_{{{\text{rise}}2}} }}}} } \right), \end{aligned}$$\end{document}where Etotal is deposited energy of gamma-ray, E1 is deposited energy on crystal 1, E2 is deposited energy on crystal 2, LY1 is the light yield of crystal 1, LY2 is the light yield of crystal 2, t time, τdecay1 decay time constant of crystal 1,, τdecay2 decay time constant of crystal 2, and τrise1 rising time constant of crystal 1,* τ*rise2 rising time constant of crystal 2.
Because each scintillator has its own unique light yield and timing properties, the peak amplitude and time integral of the mixed pulses do not correspond to a single value of total deposit energy across the scintillators. Therefore, these conventional energy surrogates are inappropriate for estimating the energy of gamma-rays from the mixed pulses. For more accurate energy assessment, it is necessary to separate the mixed pulse into two bi-exponential components and estimate the energy of each component based on unique property of each scintillator. The energy of two components can then be summed to obtain the total energy of gamma-ray interaction with scintillators.
As mentioned previously, two different methods using either pseudo-inverse matrix or ANN can be used to estimate the energy of each component. We generated mixed pulses by combining the scintillation pulses generated from each scintillator and estimated the energy from the mixed pulses using the two methods.
Pseudo inverse matrix method
The mixed signal can be expressed in matrix form as follows:
\documentclass[12pt]{minimal} \usepackage{amsmath} \usepackage{wasysym} \usepackage{amsfonts} \usepackage{amssymb} \usepackage{amsbsy} \usepackage{mathrsfs} \usepackage{upgreek} \setlength{\oddsidemargin}{-69pt} \begin{document}$$ y = {\varvec{A}} \times X + N $$\end{document}y ∈ ℝ^1024×1^: The signal obtained by summing the signal pulses from two crystals; A ∈ ℝ^1024×2^: Each column vector of A is the normalized signal pulse profile of each crystal; X ∈ ℝ^2×1^: Each row of X is the energy of each crystal; N ∈ ℝ^1024×1^: zero-mean additive white Gaussian noise (AWGN).
Because AWGN was assumed, the maximum-likelihood solution of Eq. (3) can be directly calculated using the pseudo-inverse matrix as follows:
\documentclass[12pt]{minimal} \usepackage{amsmath} \usepackage{wasysym} \usepackage{amsfonts} \usepackage{amssymb} \usepackage{amsbsy} \usepackage{mathrsfs} \usepackage{upgreek} \setlength{\oddsidemargin}{-69pt} \begin{document}$$ \hat{x} = \left( {{\varvec{A}}^{{\mathbf{T}}} {\varvec{A}}} \right)^{{ - {\mathbf{1}}}} {\varvec{A}}^{{\mathbf{T}}} {\varvec{y}} $$\end{document}The normalized pulse profile for each crystal was obtained by taking the average of 5000 pulses from each crystal which were normalized by their peak amplitudes. The integral and amplitude value were utilized as the energy value. The accuracy of energy estimation was assessed by the average R^2^ value (coefficient of determination) between the ground true and estimated energy labels.
Artificial neural network
We utilized a dataset composed of 5000 to 10,000 events per scintillator combination and divided it into training and validation data in a 4:1 ratio. To ensure effective training, we divided input signal by 1000 and the labels by 10. The ANN model used for energy estimation was a multi-layer perceptron with two hidden layers. The number of nodes in each layer was 256, and ReLU activation function was used. The input was a 1024 × 1 vector representing the sum of two pulses, and the output was a 2 × 1 vector representing the energy labels of the two pulses. The accuracy of energy estimation was also assessed by the average R^2^ value between the true and estimated energy labels.
Experimental setup
The size of scintillators (BGO, LGSO, GAGG, EJ200, EJ228, and EJ232) used in this study was commonly 3 mm × 3 mm × 20 mm. All sides of the scintillators were polished and wrapped with ESR reflectors. The main characteristics of the scintillators are summarized in Table 1.Table 1. Main characteristics of the scintillators used in the experimentsDense scintillation crystalsFast plastic scintillatorsBGOLGSOGAGGEJ200EJ228EJ232Density (g/cm^3^)7.137.156.631.021.021.02Peak emission wavelength (nm)480430530425391370Light yield (photons/MeV)850028,00042,00010,00010,2008400Decay time (ns)31740902.11.41.6
A total of 12 combinations were used in the experiment. Among these combinations, three were composed of dense crystals: BGO-GAGG, BGO-LGSO, and LGSO-GAGG. The remaining nine combinations consisted of one dense crystal and one fast crystal. The scintillators were coupled with NUV-type silicon photomultipliers (AFBR-S4N44C013; Broadcom, USA) with a pitch size of 3.72 mm × 3.72 mm. The overvoltage was kept constant at 3 V, and the experiments were conducted at 25 °C. The set-up was shielded by placing inside the temperature controlled chamber, and was set to 20 ℃. The distance between the point source and the detector was 10 cm. All data were 1 μs long and obtained using a Domino-Ring-Sampler (DT5742B, Caen, Italy) with 1 GHz sampling rate. SiPM signals were split using a Fan-In/Fan-Out module (N625, Caen, Italy) and trigger was generated using a leading-edge discriminator (N840, Caen, Italy) The circuit diagram is shown in Fig. 1.Fig. 1. Experimental setup
Results
Pseudo inverse matrix method
Figure 2 shows the signal profile of each crystal, and Figs. 3 and 4 show the scatter plots between the ground truth and the estimated energy labels (Fig. 3: integral, Fig. 4: amplitude) obtained by computing the pseudo-inverse matrix for the combined signal profiles. The R^2^ values between the ground truth and estimated energy labels for the combinations of dense crystals are summarized in Table 2. In Tables 3 and 4, the R^2^ values between the ground truth and estimated energy labels for the combinations of one dense and one fast scintillator are summarized (Table 3: integral, Table 4: amplitude).Fig. 2. Signal profile of each crystalFig. 3Scatter plot between the ground truth and the estimated time integral of scintillation pulse obtained by computing pseudo-inverse matrixFig. 4Scatter plot between the ground truth and the estimated amplitude of scintillation pulse obtained by computing pseudo-inverse matrixTable 2R^2^ value between the ground truth and the estimated energy labels using pseudo inverse matrix for the combinations of dense crystalsEnergy labelBGO/LGSOBGO/GAGGLGSO/GAGGIntegral0.99/0.980.78/0.920.91/0.96Amplitude0.95/0.990.72/0.950.91/0.99Table 3R^2^ value between the ground truth and the estimated time integral of scintillation pulse obtained by computing pseudo-inverse matrix (dense/fast scintillation combinations)BGOGAGGLGSOEJ2000.99/0.930.99/0.680.96/0.81EJ2280.99/0.880.99/0.530.97/0.72EJ2320.99/0.860.99/0.480.97/0.68Table 4R^2^ value between the ground truth and the estimated amplitude of scintillation pulse obtained by computing pseudo-inverse matrix (dense/fast scintillation combinations)BGOGAGGLGSOEJ2000.97/0.930.99/0.680.96/0.81EJ2280.97/0.880.99/0.540.97/0.72EJ2320.97/0.860.99/0.480.97/0.69
Among the combinations of dense crystals, the BGO—LGSO combination achieved the best results in both cases when using amplitude and integral as energy label. Among the combination of one dense crystal and one fast crystal, the BGO—EJ200 combination achieved the best results.
Artificial neural network method
Figures 5 and 6 show the scatter plots between the ground truth and the estimated energy labels (Fig. 5: time integral, Fig. 6: amplitude) obtained using ANN applied to the combined signal profiles. The R^2^ values between the ground truth and estimated energy labels for the combinations of dense crystals are summarized in Table 5. In Tables 6 and 7, the R^2^ values between the ground truth and estimated energy labels for the combinations of one dense and one fast scintillator are summarized (Table 6: time integral, Table 7: amplitude).Fig. 5. Scatter plot between the ground truth and the estimated time integral of scintillation pulse obtained using ANNFig. 6Scatter plot between the ground truth and the estimated amplitude of scintillation pulse obtained using ANNTable 5R^2^ value between the ground truth and the estimated energy labels using ANN for the combinations of dense crystalsEnergy labelBGO/LGSOBGO/GAGGLGSO/GAGGIntegral0.99/0.990.93/0.990.97/0.99Amplitude0.96/0.990.92/0.990.98/0.99Table 6R^2^ value between the ground truth and the estimated time integral of scintillation pulse obtained using ANN (dense/fast scintillation combinations)BGOGAGGLGSOEJ2000.99/0.990.99/0.980.99/0.96EJ2280.99/0.990.99/0.980.99/0.95EJ2320.99/0.990.99/0.970.99/0.94Table 7R^2^ value between the ground truth and the estimated amplitude of scintillation pulse obtained using ANN (dense/fast scintillation combinations)BGOGAGGLGSOEJ2000.99/0.990.99/0.960.99/0.94EJ2280.99/0.990.99/0.930.99/0.91EJ2320.99/0.980.99/0.920.99/0.91
Among the combinations of dense crystals, the BGO—LGSO combination performed the best when using integral as energy label while the LGSO—GAGG combination yielded the best results when using amplitude as energy label. Among the combination of one dense crystal and one fast crystal, the BGO—EJ200 combination achieved the best results in both cases when using amplitude and integral as energy label.
Discussion and conclusion
Introducing multiple scintillators can improve system performance and image quality in PET scanners. The use of phoswich detectors and emerging metascintilators, each employing scintillators with different decay times, makes accurate energy measurements difficult in PET scans. Traditional energy measures, such as peak amplitude and time integration of scintillation pulses, are inadequate when dealing with mixed pulses of different scintillators, so advanced methods for energy estimation are needed. Therefore, in this study, we explored two methods for energy estimation of PET detectors utilizing multiple scintillators: pseudo-inverse matrix and ANN approaches. The goal of this paper is to evaluate two energy estimation methods for scenarios where a single gamma ray interacts with two scintillation crystals. The pseudo-inverse matrix method utilizes the known pulse profiles of individual crystals to provide a simple and interpretable solution. On the other hand, ANN approaches offer flexibility and adaptability, potentially accommodating more complex relationships between input signals and energy labels.
The energy estimation method employing ANNs consistently demonstrated superior accuracy across all crystal combinations when compared to the approach utilizing the pseudo-inverse matrix. This notable performance gap would arise from the inherent limitation of the pseudo-inverse matrix method in effectively compensating for time-walk. More specifically, the pseudo-inverse matrix method has limitation in rectifying instances of time-walk, as evidenced by the signal profiles shown in Fig. 2, where peak amplitudes deviate from the ideal value of 1. Time-walk, in this context, is attributed to the process of generating the trigger signals. As illustrated in Fig. 1, the trigger signals were generated through leading-edge discrimination. To mitigate the time-walk effects, it would be necessary to minimize the threshold level while maintaining it above the electrical noise level.
In the pseudo-inverse matrix approach, there is a negligible difference in accuracy when applying integral-based energy labels as opposed to amplitude-based energy labels (refer to Tables 3 and 4). On the other hand, in ANN approach, employing integral-based energy labels consistently outperforms the use of amplitude-based energy labels. While energy labels theoretically should yield identical values for integral and amplitude in an ideal, noise-free scenario, the robustness of the integral against noise is beyond doubt. Therefore, using integrals as energy labels appears to be a better strategy to achieve improved accuracy compared to using amplitudes as energy labels, especially in the presence of noise.
In conclusion, this study contributes to the development of PET detector technology by proposing and evaluating two methods for estimating the energy of the detector using multiple scintillators. The ANN approach appears to be a promising method to improve the accuracy of energy estimation, addressing challenges posed by mixed scintillation pulses. The experimental setup, involving combinations of heavy and dense inorganic and fast plastic scintillators, provided a diverse dataset for rigorous evaluation. The consistency of results across different combinations suggests the robustness of the proposed methods. Further research may explore the scalability and adaptability of these methods to different scintillator combinations and PET system configurations. We hope that this research, along with various recent artificial intelligence and machine learning studies to improve not only various biomedical image processing and analysis techniques [16, 29–31] but also the performance of PET detectors [2, 21, 35], will ultimately contribute to improving PET system performance.