Ultra-low dose immunoPET using 64Cu-rituximab tracer for a human CD20 mouse model
Frezghi Habte, Arutselvan Natarajan

TL;DR
This study shows that ultra-low doses of a 64Cu-rituximab tracer can produce high-quality immunoPET images in a mouse model for non-Hodgkin’s lymphoma.
Contribution
The paper introduces a novel ultra-low dose immunoPET method using 64Cu-rituximab for imaging human CD20 in a transgenic mouse model.
Findings
An ultra-minimal dose of 25 μCi of 64Cu-rituximab produced high-quality images with good signal-to-noise ratio.
Tracer uptake increased linearly with injected dose in mouse models, showing consistent quantitative accuracy.
The spleen showed high specific uptake of the tracer due to hCD20 expression in B-cells.
Abstract
Antibodies (Abs) and their fragments can be labeled with PET radioisotope (immunoPET) for in vivo diagnostic imaging. Compared to the conventional FDG-PET, immunoPET can be designed to target in vivo cancer-specific antigen expression levels for various tumors and metastasis, which makes immunoPET (iPET) a powerful technique for molecular imaging and therapy monitoring. However, achieving the optimal dose to minimize radioisotope toxicity without compromising the visualization of the smallest tumor is challenging. To find an ultra-minimal tracer dose, we have developed a novel iPET with an intact rituximab Ab labeled with 64Cu to image human CD20 (hCD20) in a transgenic mouse model for non-Hodgkin’s lymphoma (NHL) imaging. Using phantom and in vivo mouse models, we optimized the minimal dose that can be administered in a mouse using a high-specific iPET tracer prepared from…
Genes, proteins, chemicals, diseases, species, mutations and cell lines named across the full text — each resolved to its canonical identifier and authoritative record.
Click any figure to enlarge with its caption.
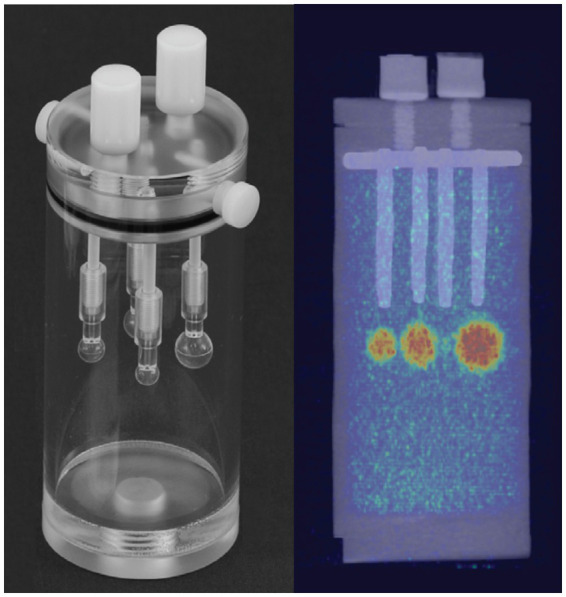 Figure 1
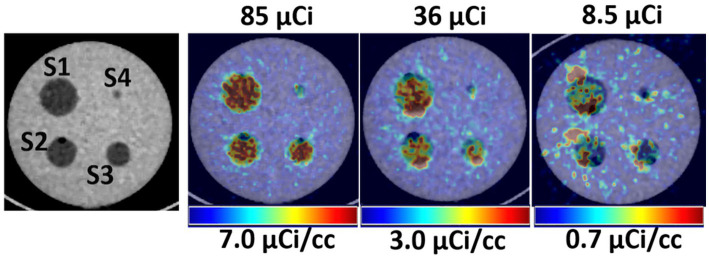 Figure 2
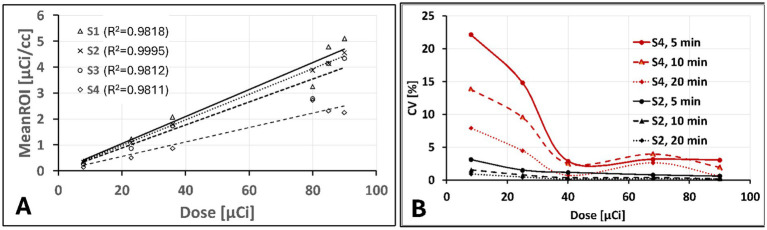 Figure 3
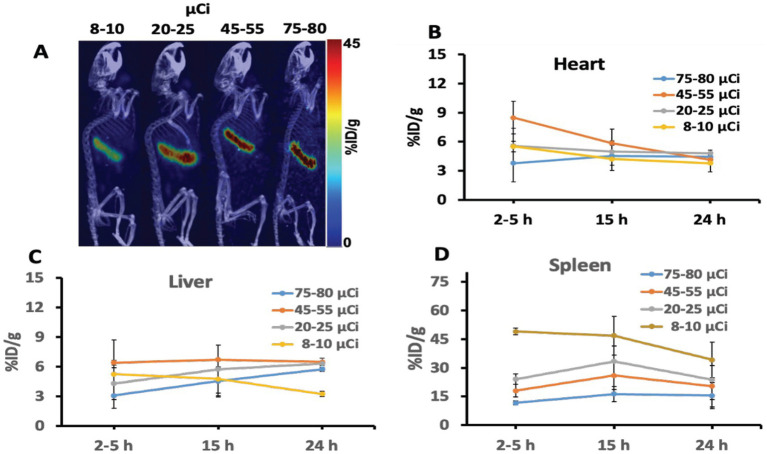 Figure 4
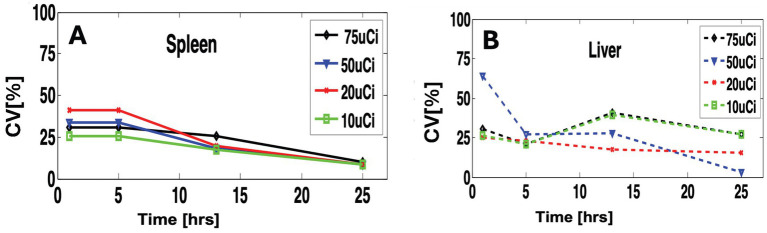 Figure 5
- —Canary Center for Early Cancer Detection, the National Cancer Institute
- —Stanford Cancer Institute Support
Peer Reviews
No public reviews on file for this paper yet. If you reviewed it on a platform where reviews are public (OpenReview, ICLR, NeurIPS, ICML), you can paste yours below so the community can read it here.
Videos
No videos yet. Explain this paper in a talk, walkthrough, or lecture? Add one.
Taxonomy
TopicsCAR-T cell therapy research · Nanofabrication and Lithography Techniques · Nanowire Synthesis and Applications
Introduction
1
Immuno-positron emission tomography (immunoPET) a.k.a. antibody-based PET molecular imaging strategy is performed taking advantage of the high specificity of monoclonal antibody (mAb) and the inherent high sensitivity of PET (1–10). Several radionuclides and mAbs have been exploited to develop immunoPET (iPET) probes, some of which have already been successfully translated for clinical use (4, 7, 8, 11–13). iPET is becoming the method of choice for imaging specific tumor markers, immune cells, immune checkpoints, inflammatory processes, and guide mAb-based therapy (12, 14–18). Superior to conventional FDG-PET, immunoPET can characterize and quantify antigen expression specific to a tumor type, making iPET a powerful molecular strategy for tracking, visualizing, and measuring the tumor gene expression (18–24). FDG-PET, taken up into the body through glucose transporters, has very poor specificity and can be seen in areas with high levels of metabolism and glycolysis, such as sites with inflammation or tissue repair (23–28). iPET has the potential to image specific diseases and quantify them for clinical diagnostic applications. Several iPETs are already in clinical investigations for cancer staging and therapy monitoring using FDA-approved mAbs (4, 29). We have recently developed a novel iPET tracer using mAb (rituximab) labeled with ^64^Cu and ^89^Zr to image human CD20 as a marker for NHL. Evaluation of these new tracers in a transgenic mouse model and humans showed specific imaging of hCD20-expressing B-cells (30–33). Such new iPET tracers in development have immense potential in the clinical setting as the antibody can bring radiation directly to the lymphoma cells (34–38).
When compared to FDG-PET, the iPET is linked with long-half-life radioisotopes to match the slow uptake and clearance of antibodies selected for iPET imaging. As a result, the radiation burden on the patient when using antibody-based tracers is relatively high compared to conventional rapidly clearing PET tracers such as [^18^F]FDG (35, 36). This limitation could hinder the development and practical application of antibody-based tracers, and therefore, it is paramount to reduce the radiation exposure whenever feasible. Advances in iPET imaging uses modified antibody fragments with small size and shorter elimination half-life allowing the use of short half-life radioligands to perform iPET imaging on the same day while reducing radiation exposure (38–43).
Engineered smaller size affibody proteins and antibody fragments retaining the essential specificities and affinities of a full antibodies, have become desirable pharmacokinetics for PET imaging using various options of PET isotopes (3, 38, 40). While these new iPET imaging strategies will play a big role in reducing radiation exposure, we also believe that administration of an optimized minimum dose could also substantially decrease the overall radiation burden on the patient (43–45). However, since PET inherently produces noisy images, it is challenging to optimize the minimum dose (46–49). Reducing the injected dose amount may further compromise the image quality (44, 45). Since PET measures the biodistribution of a particular tracer administrated to the body, the number of detected tracers counts on a selected region of interest defines the image quality and quantitative accuracy. Hence, dose administration could be specific to each tracer behavior or condition of the study. This means, there is a limit and variation to the minimum dose required that provides adequate counts for obtaining a non-biased signal-to-noise ratio and quantitative diagnostic value specific to each study (45). To evaluate this more quantitatively, in this study we evaluated the ultra-low injected dosage capability of iPET using phantom and live animal models. The combined effect of the high sensitivity of PET/CT and the high specificity of iPET tracers (32, 43) may allow the administration of ultra-low doses without compromising the image quality and quantitative accuracy.
Materials and methods
2
iPET tracer and animal model
2.1
GMP grade ^64^Cu labeled iPET tracer preparation was already reported (33, 50). To test the tracer capability for low-dose diagnostic imaging, we have used a transgenic mouse model that expresses hCD20. In this mouse model, hCD20 is expressed in B cells homing in the spleen, providing the highest tracer uptake. For this tracer development, the anti-hCD20 antibody (IgG; rituximab) was conjugated to DOTA for radiolabeling of ^64^Cu. In another study, we have reported the evaluation of the dosimetry of ^64^Cu-mAb tracer in the hNSG mouse model using the standard average injected dose of 100 μCi (32).
Phantom study
2.2
To evaluate the ultra-low dose counting accuracy of the scanner, we used a cylindrical phantom (Data Spectrum Corp) with a 40 mm inner diameter, 82 mm height, and four micro-hollow fillable spheres (Figure 1). The cylindrical phantom was filled with water and ~95 μCi of ^64^Cu to provide ~1 μCi/cc radiotracer concentration as a background signal for the phantom study. To represent the foreground signal and emulate high tracer uptake in an animal model, we prepared a 20 ml methanol and ~150 μCi of ^64^Cu solution. Due to its lower density relative to water, methanol was used as a contrast agent to provide slight CT image contrast in the PET/CT imaging. The mix provided ~7.5 μCi/cc ^64^Cu tracer concentration to fill each hollow four spheres (~1, 0.5, 0.25, and 0.031 ml). For the first scan, the total initial activity of the background and foreground was ~92 μCi. The Phantom was scanned using Inveon MicroPET/CT (Preclinical Solutions; Siemens Healthcare Molecular Imaging, Knoxville, TN) for 30 min at different time points while decaying over 48 h. Three image frames of 5, 10, and 20 min from the acquired images were reconstructed using the Ordered-subset expectation maximization (OSEM 2D) algorithm (51). Inveon Research Workspace (IRW) analysis software (Siemens Healthcare) was used for analysis and quantitation. Regions of Interest (ROI) were drawn over the four spheres and the background to obtain the mean radiotracer distribution (μCi/cc). Doses at each scan time were calculated from the decayed ^64^Cu tracer.
Left, Cylindrical tube with four insertable fillable hollow spheres of different sizes (~1, 0.5, 0.25, and 0.031 ml) used as a phantom. Right, PET/CT image of phantom after filling the cylinder tube with low radiotracer concentration (~1 μCi/cc) as background and hollow spheres with ~7.5 μCi/cc as foreground uptake.
Animal study
2.3
Animal studies were performed in compliance with approval from the Administrative Panel on Laboratory Animal Care (APLAC) at Stanford University. The hCD20 transgenic mice models (Genentech, South San Francisco, CA) were used for the experiment. Prior to the animal study, transgenic mice were screened by RT-PCR to confirm the expression of hCD20 positivity. We injected 8–10, 20–25, 45–55, and 75–80 μCi via the tail vein in a group of four mice for each dose. After radiotracer administration, the animals were imaged at ~1–5, 15, and 24 h using Inveon MicroPET/CT within 20–30 min intervals.
PET imaging and analysis
2.4
PET imaging was performed on the Inveon MicroPET/CT system following standard routine acquisition protocol in our facility. The CT scan was acquired using an 80 kVp and 500 μA, two-bed position, half scan 220° of rotation, and 120 projections per bed position for both anatomic reference and PET attenuation correction. PET scans were performed using the default settings of a coincidence timing window of 3.4 ns and an energy window of 350 to 650 keV. Static 5 min was used to acquire first-time point acquisitions (1–5 h post-injection), followed by static 10 min acquisition for later time points (15 and 24 h). The images were reconstructed using the OSEM 2D algorithm. Using IRW, manual three-dimensional regions of interest (ROIs) were drawn over the heart, liver, and leg muscles. A semi-automatic ROI histogram-based segmentation technique was used to segment the spleen to reduce reader variability. The average radioactivity concentration in the ROI was obtained from the mean pixel values within the ROI volume, which is converted to a percentage injected dose per gram of tissue (%ID/g).
Statistical analysis
2.5
The quantitative data were expressed as mean ± SD. Means were compared using the student t test. A 95% confidence level was chosen to determine the significance between groups, with p values of less than 0.05 indicating significant differences.
Results
3
Phantom study
3.1
Figure 2 shows a qualitative comparison of phantom images between conventional and ultra-low doses at scan time. After a suitable image intensity adjustment, the effect of low ultra-low dose <10 μCi shows nonhomogeneous uptake in all spheres. However, all hollow spheres, including the smallest (0.031 ml, S4), which shows the lowest uptake due to the partial volume effect, showed higher uptake than the background. Figure 3 quantitatively assesses the mean values extracted from ROIs drawn over each hollow sphere based on the CT images. The computed mean ROI vs. dose at scan time showed comparable linearity with the expected partial volume effect (Figure 3A). For comparison, we also computed the coefficient of variance of images reconstructed at different times of acquisition (5, 10, and 20 min) for each dose (Figure 3B, showing only the S2 (second largest) and S4 (smallest) sphere sizes). The result indicates that the computed variability increases slightly for doses less than 40 μCi for larger spheres independent of scan duration with expected improvement for images acquired with longer acquisition time (10 and 20 min).
Left, CT images showing the hollow fillable spheres of the phantom. Right, Qualitative comparison of PET/CT images of the phantom for selected three low doses.
Phantom images quantitative assessments: (A) extracted mean ROI value vs. administered dose showing an expected linear increase with lower slop for smaller size spheres due to partial volume effect and (B) Computed percentage coefficient of variation showing only for S2 (second to largest) and S4 (smallest) sphere sizes for 5, 10, 20 min acquisition time as function of administrated dose.
Animal study
3.2
In vivo, animal imaging using the target-specific ^64^Cu iPET radiotracer, as expected, showed high uptake in the spleen for all dose amounts (Figure 4A). Relatively low uptake was also seen in the heart and liver. The spleen consistently showed increased uptake in %ID/g of 3 to 10 folds relative to the liver with a decreased injected dose (Figure 4D), showing improved tracer specificity and image contrast. In contrast, the spleen-to-liver uptake ratio steadily increased (3–5 folds) with a decrease of dose up to 20 μCi. The spleen-to-liver uptake increased non-linearly over nine-fold for ultra-low injected dose <10 μCi (p < 0.03). At 15 h post-injection (p.i.), high tracer uptake in the spleen was obtained (Figure 4D).
(A) Representative iPET/CT images showing tracer uptake 24 hr post injection in the spleen of the humanized transgenic mice. Each mice group received doses (ranging from 8 to 80 μCi). (B–D) Depicted the iPET signal corresponding to the tracer uptake from the heart, liver, and spleen of the mouse at different time points.
Figure 5 shows a quantitative assessment of inter-subject variability. For the spleen, we observed similar inter-subject variability with slight variation between doses (Figure 5A) and slightly higher variability (CV = ~30%) at the early time points (1 to 5 h). At the later time point (24 h.), the variability drops on average to one-third (CV = ~10%) due to tracer clearance (Figure 5B).
Quantitative comparison of variability within different doses and scan time. (A) for the spleen and (B) for the liver.
Discussion
4
As the most popular molecular imaging tool, PET/CT imaging has always been attractive for both preclinical and clinical applications due to its superior sensitivity. However, the inability to accurately determine the optimum dose that may be administrated to the subject may make to operate non optimally especially regarding minimization of radiation exposure to the subject and associated cost of the target tracer (43, 45). Specifically, the challenge is to find a standard minimum dosage (SMD) that is sufficient to acquire clinically relevant diagnostic information, which inherently involves multiple factors. Assuming a fixed scanner sensitivity limited by its specific geometric configuration and detector characteristics, the optimum minimum dosage may vary on several image acquisition parameters such as reconstruction type, subject size and positioning, and scanner acquisition protocols (43). Within the selected optimum acquisition and reconstruction parameters, dosage may also vary with the specific choice of radiopharmaceutical and its associated factors, including the tracer uptake specificity, clearance pattern, molecular size of the tracer, tracer half-life, and others.
Imaging of iPET using mAb labeled with Cu-64 or Zr-89 isotope provides relatively high specificity compared to the non-specific tracer such as FDG. This is because mAbs are specifically designed to bind to targeted organs or tumors selectively. Hence, a small tracer dose (26, 32) could specifically bind to the intended in vivo target organ or receptors. Using phantom and animal studies, our results indicated that as low as 20 μCi of tracer dose can be sufficient to image using the most commonly available MicroPET/CT scanners without significantly affecting or compromising image quality and quantitative value. Furthermore, iPET animal imaging has shown better image contrast with reduced background noise at lower doses compared to conventionally administered doses (~100 μCi per mouse). The overall results (Figure 4) indicate that an optimal suitable lower dose may improve image quality and quantitative accuracy while reducing radiation exposure. It is also expected to improve the image quality at lower doses by extending the scanning time (Figure 3B).
In the animal study, the spleen express hCD20 marker for NHL, showing the highest uptake of iPET tracer which is consistent as reported elsewhere (33, 50). This gives a promising application for tracing and tracking the metabolic activity in tumors expressing antigen CD20. This tracer has been specifically developed to target B-lymphocytes expressing hCD20 seen in the spleen with increased numbers in non-Hodgkin’s Lymphoma (32). It was anticipated to accumulate in the spleen with some lower uptakes in the heart and liver due to their roles in removing toxins from the body. If the tracer uptake in the spleen saturates, the extra tracer clears through the liver. Hence, the increased amount of tracer doses tends to bind on other organs non-specifically, such as the uptake seen in the liver (Figure 4C). On the other hand, lower administrated doses show to decrease non-specific organs uptake while increasing target-specificity. Spleen-to-liver ratios demonstrated distinctively that even at the lowest doses (<8 μCi) and after 24 h of decay, the spleen shows strong uptake with relatively good image quality. An estimated dose of 20 to 25 μCi, as reported in this study, could be assumed as the lower dose limit that may provide comparable image quality and accuracy relative to the commonly used higher doses for in vivo mouse iPET imaging. This study provides initial validation for the important and challenging tradeoffs in PET imaging between image quality and radiation exposure. The study demonstrates that with increased specificity of specific tracer a significantly lower dose up to one fourth as estimated in Figure 4 relative to conventional dose (~100 μCi) may be used without changes of the imaging protocols and compromising the image quality. Minimizing radiation exposure reduces the risks associated with ionizing radiation and the overall imaging costs, but it is also very important to have good image quality practically for all clinical and research applications (47, 48). We also expect this study to provide a bases for further validation of the optimum minimum dose for clinical practice, which is relatively more important due to the ever-increasing concerns related to radiation exposure in patients requiring multiple examinations or those at a higher lifetime risk for developing cancer (e.g., pediatric patients) (49).
Conclusion
5
Our study provides the basis for the initial validation of the potential usage of ultra-low-dose clinical practices using target-specific iPET imaging studies without impacting the overall image quality and quantitative accuracy. Low doses may also improve specificity and reduce radiation in non-targeted areas and non-specific uptake by other clearing organs such as the liver and kidney. With the evolving research on early cancer detection and immunotherapies, imaging with more targeted tracers will help reduce misdiagnoses and unnecessary radiation exposure. This study reveals that optimal low-dose estimation is vital to all diagnostic imaging tracers prior to clinical translation studies, saving tracer costs and reducing systemic radiation exposure.
The reference list from the paper itself. Each links out to its DOI / PubMed record.
- 1Wei W Rosenkrans ZT Liu J Huang G Luo QY Cai W. Immuno PET: concept, design, and applications. Chem Rev. (2020) 120:3787–851. doi: 10.1021/acs.chemrev.9b 00738, PMID: 32202104 PMC 7265988 · doi ↗ · pubmed ↗
- 2Rolle AM Hasenberg M Thornton CR Solouk-Saran DMänn L Weski J. Immuno PET/MR imaging allows specific detection of Aspergillus fumigatus lung infection in vivo. Proc Natl Acad Sci. (2016) 113:E 1026–33. doi: 10.1073/pnas.1518836113, PMID: 26787852 PMC 4776455 · doi ↗ · pubmed ↗
- 3Manafi-Farid R Ataeinia B Ranjbar S Jamshidi Araghi Z Moradi MM Pirich C. Immuno PET: antibody-based PET imaging in solid tumors. Front Med. (2022) 9:916693. doi: 10.3389/fmed.2022.916693, PMID: 35836956 PMC 9273828 · doi ↗ · pubmed ↗
- 4Mohr Pvan Sluis J Lub-de Hooge MN Lammertsma AA Brouwers AH Tsoumpas C. Advances and challenges in immuno PET methodology. Front Nucl Med. (2024) 4:1360710. doi: 10.3389/fnume.2024.1360710, PMID: 39355220 PMC 11440922 · doi ↗ · pubmed ↗
- 5Beckford-Vera DR Flavell RR Seo Y Martinez-Ortiz E Aslam M Thanh C. First-in-human immuno PET imaging of HIV-1 infection using 89Zr-labeled VRC 01 broadly neutralizing antibody. Nat Commun. (2022) 13:1219. doi: 10.1038/s 41467-022-28727-5, PMID: 35264559 PMC 8907355 · doi ↗ · pubmed ↗
- 6Wu AM Pandit-Taskar N. Immuno PET: harnessing antibodies for imaging immune cells. Mol Imaging Biol. (2022) 24:181–97. doi: 10.1007/s 11307-021-01652-7, PMID: 34550529 · doi ↗ · pubmed ↗
- 7Bhargava KK Acharya SA. Labeling of monoclonal antibodies with radionuclides. Semin Nucl Med. (1989) 19:187–201. doi: 10.1016/S 0001-2998(89)80013-3, PMID: 2503873 · doi ↗ · pubmed ↗
- 8Chomet Mvan Dongen GAMS Vugts DJ. State of the art in radiolabeling of antibodies with common and uncommon Radiometals for preclinical and clinical Immuno-PET. Bioconjug Chem. (2021) 32:1315–30. doi: 10.1021/acs.bioconjchem.1c 00136, PMID: 33974403 PMC 8299458 · doi ↗ · pubmed ↗