Ammonia Binding to the Oxygen-Evolving Complex Probed by High-Energy Resolution Fluorescence Detected X-Ray Absorption Spectroscopy
Maria Chrysina, Maria Drosou, Dimitrios A. Pantazis, Serena DeBeer

TL;DR
This study uses advanced X-ray techniques to investigate how ammonia binds to a key part of the photosystem involved in water oxidation.
Contribution
The study provides new insights into ammonia binding modes using HERFD XAS and quantum chemical calculations.
Findings
Ammonia likely substitutes the terminal water ligand W2 on Mn4 in the OEC.
Mn4 is identified as the strongest or most accessible binding site for ammonia.
Ammonia coordination on Mn1 as a sixth ligand is also a plausible binding mode.
Abstract
The insertion pathways and binding sites of substrate water molecules at the catalytic Mn4CaO5 cluster of the oxygen-evolving complex (OEC) in photosystem II (PSII) remain a fundamentally unresolved question toward understanding biological water oxidation. To address this question, small molecules have been employed as “water analogues” to probe substrate binding to the OEC. In this context, the binding of ammonia has been extensively investigated and discussed using spectroscopic, structural, and quantum chemical methods, but a definitive answer regarding the ammonia binding site has not yet been achieved. Herein, we present high-energy resolution fluorescence detected (HERFD) Mn K-edge X-ray absorption spectroscopy (XAS) in ammonia-treated S2 state samples of the OEC. Pre-edge features were correlated with possible structural models with the aid of quantum chemical calculations. The…
Genes, proteins, chemicals, diseases, species, mutations and cell lines named across the full text — each resolved to its canonical identifier and authoritative record.
Click any figure to enlarge with its caption.
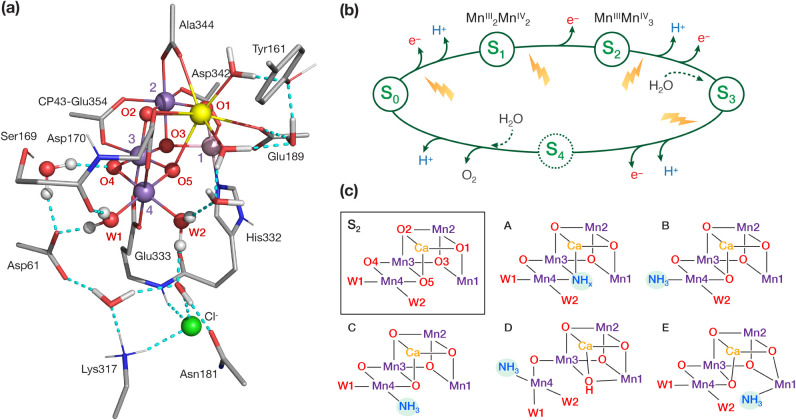 Figure 1
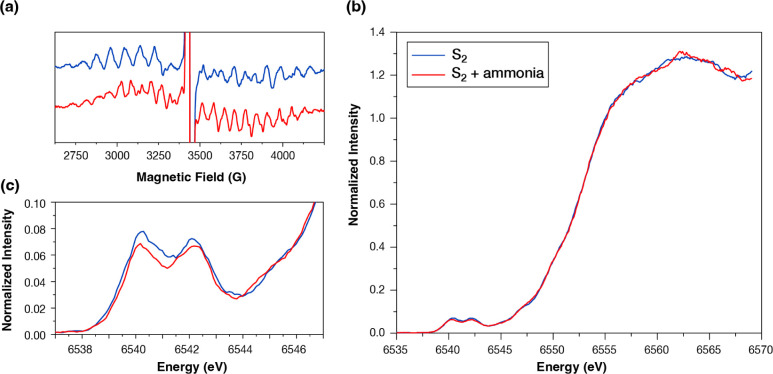 Figure 2
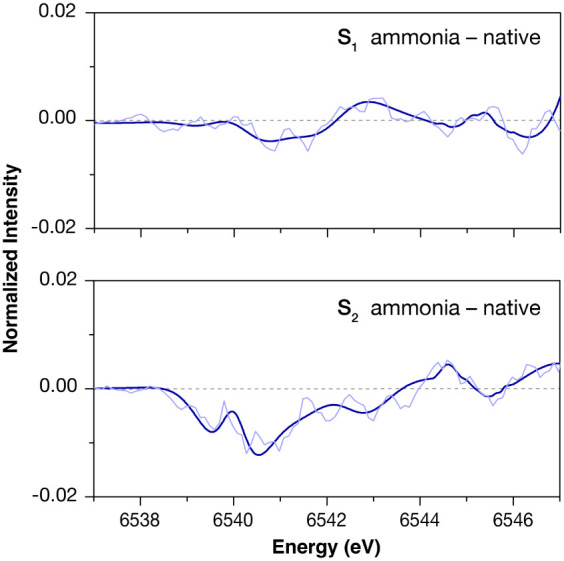 Figure 3
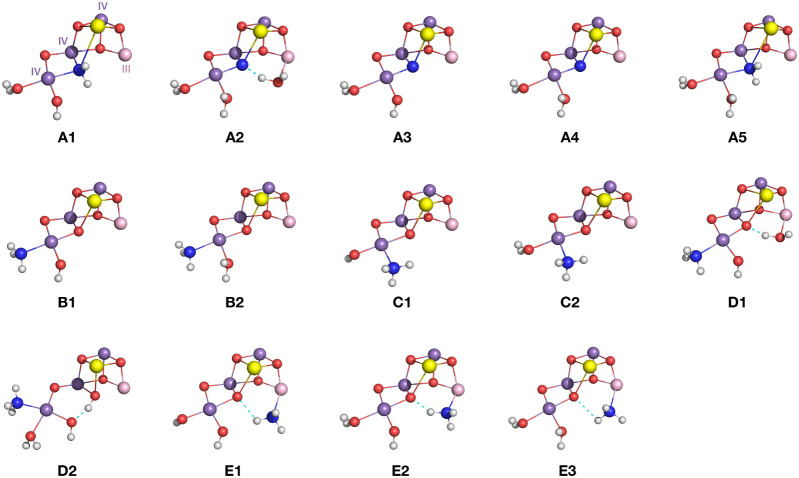 Figure 4
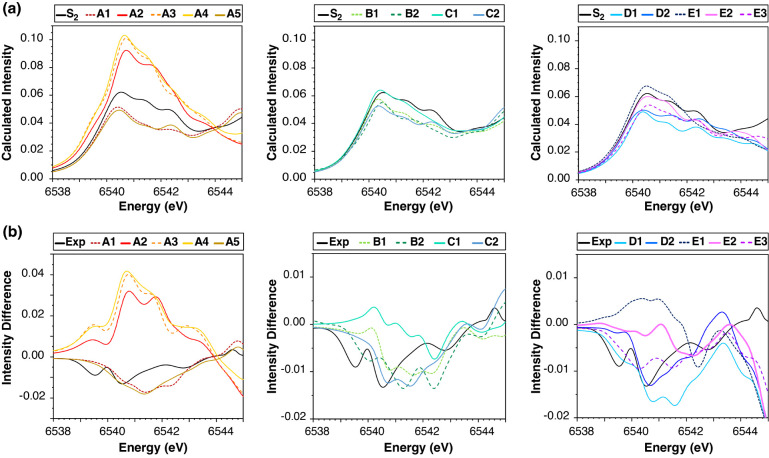 Figure 5
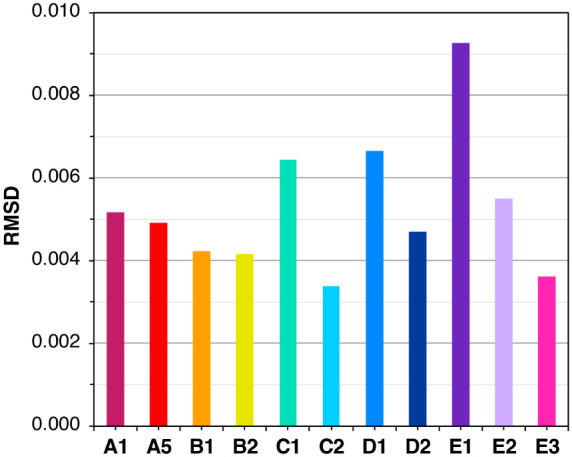 Figure 6
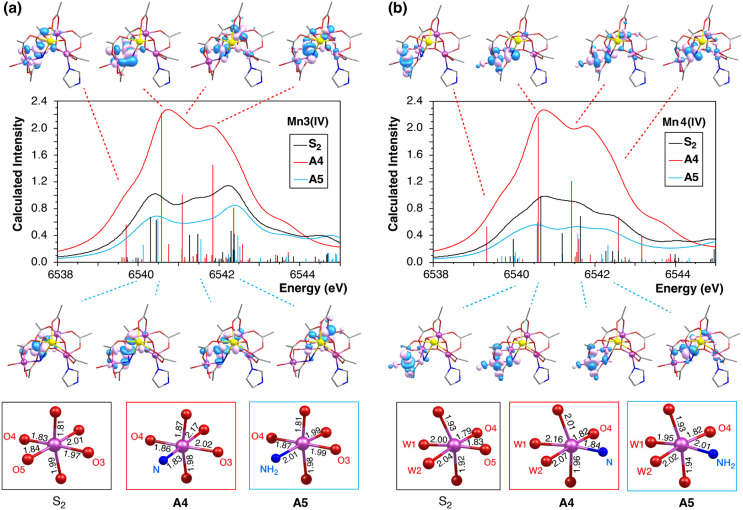 Figure 7
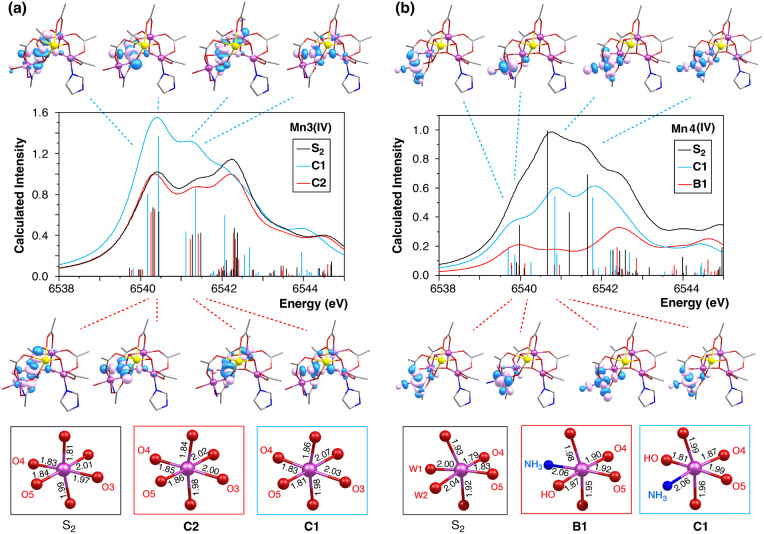 Figure 8
- —Max-Planck-Gesellschaft10.13039/501100004189
Peer Reviews
No public reviews on file for this paper yet. If you reviewed it on a platform where reviews are public (OpenReview, ICLR, NeurIPS, ICML), you can paste yours below so the community can read it here.
Videos
No videos yet. Explain this paper in a talk, walkthrough, or lecture? Add one.
Taxonomy
TopicsX-ray Spectroscopy and Fluorescence Analysis · Mass Spectrometry Techniques and Applications · Ion-surface interactions and analysis
Introduction
1
Biological dioxygen generation from water is carried out by the oxygen-evolving complex (OEC) in photosystem II (PSII) in plants, algae, and cyanobacteria.^1−5^ The OEC consists of a protein-embedded Mn_4_CaO_5_ inorganic core, which forms a near-cuboidal Mn_3_CaO_4_ unit connected to the fourth Mn ion (Mn4) by two bridging oxo groups (O4 and O5, Figure 1a).^6,7^ The complex cycles through five intermediate states Si (i = 0–4) to store the four oxidizing equivalents required for the four-electron oxidation of water to dioxygen (Figure 1b).^8,9^ The two substrate water molecules bind at different states of the catalytic cycle, one during or after the S_2_ → S_3_ transition,^10−21^ and another during the S_4_ → S_0_ dioxygen formation and release step.^22−29^ Three water channels that begin from the OEC near O1, O4, and the proximal Cl (Figure 1a), respectively, and extend toward the aqueous environment of PSII, mediate the transfer of substrate water molecules and the removal of protons.^30−39^ Given the difficulty in identifying the atomic details of water delivery and binding,^3,37,40−43^ small molecules like ammonia have long been used as water analogues to probe substrate binding to the OEC.^44−55^
(a) The oxygen-evolving complex of PSII and part of its protein environment; (b) the Kok–Joliot cycle of water oxidation; (c) possible ammonia binding modes (A–E) discussed in the literature.
Two modes of ammonia binding on the OEC have been determined.^56,57^ One is chloride-dependent and inhibits O_2_ evolution,^56−59^ whereas the other binding mode is independent of the presence of chloride, and it slows down but does not inhibit O_2_ evolution.^56,57,60−63^ In the second binding mode, ammonia is believed to bind covalently to the cluster. This is based on experimental observations from electron paramagnetic resonance (EPR) spectroscopy,^61,64^ electron–nuclear double resonance (ENDOR) spectroscopy (^55^Mn hyperfine coupling constants),^49,55^ electron spin echo envelope modulation (ESEEM),^49,50,61^ and electron–electron double-resonance–detected NMR (EDNMR),^47,49^ Fourier transform infrared (FTIR) difference spectroscopy,^65,66^ and kinetics studies.^67^ Nevertheless, none of these studies can pinpoint the precise mode of ammonia noninhibitory binding, which therefore remains contested. Identification of this binding site serves to elucidate the pathway for water delivery to the cluster and possibly correlates with the site of substrate binding.
Five proposed ammonia binding modes are shown in Figure 1c. Binding mode A, originally suggested based on ^14^N hyperfine anisotropy measured from ESEEM,^61^ and later supported by interpretations of ammonia inhibition kinetic studies^67^ and FTIR experiments,^66^ involves O5 oxo-bridge substitution by an imido (NH^2–^), amido (NH_2_^–^), or nitrido (N^3–^) bridge.^68^ In binding modes B and C, ammonia binds to Mn4 as a terminal ligand, replacing W1 and W2, respectively. Terminal ligand substitution has been supported by magnetic spectroscopy^47,49^ and quantum chemical studies.^69−71^ If ammonia remains coordinated to the cluster during the S_3_ → S_0_ transition, noninhibitory binding replacing one of the terminal W1 or W2 ligands would preclude the specific ligand from being a substrate in the subsequent O–O bond formation step. In binding modes D^72^ and E,^73^ ammonia binds to Mn4 and Mn1, respectively, in closed and open-cubane conformations of the cluster, as an additional sixth terminal ligand. Crystallographic studies^74^ and extended X-ray absorption fine structure (EXAFS)^75^ cannot be used as a basis to distinguish between models that represent the different binding modes, probably because the structural changes induced by ammonia binding to the OEC cluster are too small.
However, important information might be contained in the pre-edge region of the Mn K-edge X-ray absorption spectrum, even for species having the same Mn oxidation states,^76,77^ if this is sufficiently resolved. The Mn K-edge XAS arise from excitations of the core (1s) electrons of Mn into unoccupied molecular orbitals. Dipole allowed 1s → 4p excitations give rise to the intense region known as the edge. The energy of the edge correlates with the oxidation states of the Mn ions and has been used to probe the total oxidation state of the Mn ions of the Mn_4_CaO_5_ cluster.^78−80^ The lower energy pre-edge region is dominated by 1s → 3d excitations. Even though these transitions are formally dipole-forbidden, they gain intensity through the introduction of dipole character via the mixing of metal p character into the d manifold.^81^ Hence, the pre-edge region contains information on the local electronic structure of the metal ion, as well as its geometry, coordination number, and ligand covalency.
A highly resolved description of the Mn K pre-edge region for all S-states of the OEC, obtained using high-energy resolution fluorescence detected (HERFD) X-ray absorption spectroscopy (XAS),^82−84^ was recently used in combination with quantum chemical calculations to resolve the nature of oxidation events in all spectroscopically observable catalytic intermediates of the OEC.^77^ Herein, we employ Mn HERFD XAS combined with quantum chemical calculations to discriminate between the various suggested modes of ammonia binding on the S_2_ state of the OEC by comparing the calculated Mn spectra of selected structural models that represent all proposed ammonia binding modes with experimental data. Our results indicate that models in which ammonia replaces one of the two terminal water ligands on Mn4 show the highest alignment with experimental data, followed by Mn1 addition, while they disfavor substitution of a bridging μ-oxo ligand or the addition of ammonia as a sixth ligand on Mn4 in the closed cubane conformation of the cluster.
Methods
2
Experimental Details
2.1
Photosystem II Sample Preparation
2.1.1
Photosystem II was purified from the thermophilic cyanobacterium Thermosynechococcus vestitus according to Kuhl et al.^85^ The final buffer contains 500 mM mannitol, 40 mM MES (pH = 6.5), 10 mM CaCl_2_, 10 mM MgCl_2_, 0.03% v/v n-dodecyl β-d-maltoside. Ammonia treatment: photosystem II preparations were washed with buffer-free solution (500 mM mannitol, 10 mM CaCl_2_, 10 mM MgCl_2_) until the MES concentration was <1 mM. Solution of 1 M NH_4_Cl in 1 M HEPES (pH = 7.6) was added at a ratio of 1:10 v/v to the sample, i.e., giving a final concentration of 100 mM, which equates to 2 mM NH_3_ in solution. Phenyl-para-benzoquinone (PPBQ) dissolved in dimethyl sulfoxide (DMSO) was added as an electron acceptor at a final concentration of 0.5 mM. Photosystem II (1.5 mM Mn, 25 μL) was loaded in POM frames sealed with Mylar tape. S_2_ samples were 1-flash illuminated using a Nd:YAG laser (532 nm, 10 ns pulse of 500 mJ) at room temperature and frozen in liquid N_2_. EPR measurements were performed on all samples to ensure the high quality and incorporation of ammonia in the ammonia-treated samples. A Bruker E500 spectrometer equipped with a Bruker ER 4116DM resonator and an Oxford Instruments ESR 900 cryostat was used for the EPR measurements.
HERFD Measurements
2.1.2
Mn K_α_ HERFD measurements were performed at beamline ID26 of the European Synchrotron Radiation Facility (ESRF). The current of the Extremely Brilliant Source (EBS) storage ring was 90 mA (16 bunch mode). The incident beam was monochromatized using a pair of cryogenically cooled Si(311) crystals, giving an incident energy resolution of ∼0.2 eV. The flux is estimated to be ∼10^12^ photons/s in a 200 × 100 μm beam spot. The energy of the incident beam was calibrated by setting the first inflection point of the XAS spectrum of a Fe foil to 7111.2 eV. K_α_-HERFD were collected using a Johann-type XES spectrometer with five Ge(111) crystals and an energy-dispersive Si drift detector. The spectrometer resolution at the elastic peak was ∼0.7 eV. The sample temperature during measurements was poised at 20 K using a liquid He-cooled flow cryostat. To establish the highest X-ray dose that does not damage the sample, time scans were performed at 6550 eV, which was proved to be a sensitive probe for damage. Aluminum filters were used to attenuate the beam at about 11%. Once the dwell time was estimated by the time scans at the edge position (6550 eV), X-ray absorption near edge spectroscopy (XANES) was performed using the respective dose and a lower dose to ensure that the two spectra overlap. Finally, the dose used for the S_1_ state (0 flashes) was 3.9 × 10^7^ photons/μm^2^ and 1.9 × 10^7^ photons/μm^2^ for the S_2_ state (1 flash). The K_α_ HERFD XANES scans were collected in an energy range of 6535–6570 eV and the pre-edge region was measured at 6537–6547 eV, while long 6530–6800 eV scans were measured to facilitate proper normalization. The energy step was, in all cases, 0.1 eV. The XANES spectra were normalized by area according to the long scans; subsequently, the pre-edge region was normalized by area to the XANES spectra pre-edge region. The estimated errors introduced after normalization are 1–2%, which is negligible for the pre-edge intensities. For further analysis, high-resolution pre-edge region scans were used. The signal-to-noise ratio of the HERFD spectra is ∼20.
Computational Details
2.2
Cluster models of the OEC in the native S_2_ state and of possible ammonia-bound S_2_ state forms were constructed and optimized as described in previous work.^70^ Starting coordinates were obtained from the 5B66 crystallographic structure reported by Tanaka et al.^86^ The models include the inorganic Mn_4_CaO_5_ core, all first coordination sphere amino acids and water ligands (W1–W4), the second sphere amino acids Asp61, Tyr161, Gln165, Ser169, Asn181, Val185, Phe186, His190, Asn298, Lys317, His337, Leu343, and CP43-Arg357, 13 more crystallographic water molecules, and the proximal chloride Cl^–^ ion. In a previous study,^70^ 29 different ammonia-bound S_2_ state models were screened based on their magnetic and spectroscopic properties. Among this set, only 14 models have a predicted S = 1/2 ground state, consistent with the EPR of the ammonia-treated samples. Therefore, XAS calculations were performed in the present work only on these 14 models that satisfy the S = 1/2 ground state.
All computations were conducted using Orca 5.^87^ The XAS spectra were calculated as previously reported,^77,88−91^ via the TD-DFT method, employing the Tamm–Dancoff approximation.^92^ The TPSSh functional^93^ was selected for its proven accuracy in previous studies. Relativistic effects were considered throughout using the zeroth-order regular approximation (ZORA),^94−97^ along with the scalar-relativistically recontracted^98^ ZORA-def2-TZVP(-f) basis sets^99^ for all atoms except C and H for which the ZORA-def2-SVP basis sets were used. The conductor-like polarizable continuum model (CPCM) solvation model^100^ with dielectric constant ε = 6.0 was used to simulate the effect of the protein surrounding. To optimize computational efficiency, the resolution of identity (RI) and chain of spheres (RIJCOSX) approximations^101,102^ were employed along with the decontracted def2/J auxiliary basis sets.^103^ The XAS spectra for each Mn ion were computed separately considering 150 roots. The final spectra for each model were derived by summing the individual spectra of all four Mn ions. An energy shift of 35.3 eV and intensity scaling of 0.018 were applied to all models on the basis of optimal alignment with experimental data of the untreated S_2_ state. This serves to eliminate systematic errors intrinsic to the computational approach, a usual practice in TD-DFT studies of XAS pre-edge spectra,^77,88−91^ and to ensure common treatment of all models for comparing their corresponding spectroscopic features directly on the same basis.
Evaluation of the ammonia-bound OEC models was based on the difference spectra between the ammonia-treated and untreated samples. The degree of deviation of the calculated difference spectra of each ammonia-bound model from the experimental difference spectra was quantified using the root-mean-square deviation (RMSD) of the calculated difference spectra from the experimental difference spectra:
where yi,calc. and yi,exp. are the intensities of the calculated and experimental difference spectra, respectively, at 240 energy values in the energy region 6538–6544.5 eV.
Results and Discussion
3
Mn Kα Edge
High Energy Resolution Fluorescence Detected X-Ray Absorption Spectroscopy
3.1
Dark-adapted and 1-flashed samples of untreated and ammonia-treated PSII isolated from T. vestitus were prepared and their Mn K_α_ HERFD spectra were measured. All samples were studied by EPR prior to the X-ray measurement. In the dark-adapted samples, there was no sign of Mn(II) that would indicate Mn release from Photosystem II due to poor sample quality. After 1 laser flash, the multiline (g ≈ 2) EPR signal of the S_2_ state^104^ was observed and its intensity was used as a probe of the S_2_ population in the samples. A small population (∼10%) of the 0-flashed HERFD spectrum was subtracted from the 1-flashed spectrum to acquire the pure S_2_ state spectra for the untreated and ammonia-treated photosystem II. The multiline EPR signals of the untreated and the ammonia-treated S_2_ samples are presented in Figure 2a. The quantitative incorporation of ammonia in the Mn_4_Ca cluster was verified based on the modification of the S_2_ multiline EPR signal.^60^
Comparison of EPR and Mn K-edge HERFD XAS spectra of the native (blue) and ammonia-treated (red) S2 state. (a) EPR multiline signal; EPR parameters: modulation frequency: 100 kHz, modulation amplitude: 7 G peak to peak, microwave frequency: 9.64 GHz, microwave power: 8 mW, sweep time: 100 s, sweep field: 5000 G, average of 4 scans, temperature: 10 K. (b) XANES region, and (c) Mn Kα HERFD pre-edge region. The energy grid of both XANES and pre-edge spectra is 0.1 eV. The pre-edge region is binned by a 5-point window, while the XANES region is binned by an 11-point window.
The Mn K_α_ HERFD absorption spectra of the untreated (native) and ammonia-treated PSII samples were measured at ID26 at the ESRF. The raw data of the XANES regions are shown in Figure S1 and a comparison of the raw and binned spectra is shown in Figure S2. Ammonia treatment does not induce perceptible changes in the S_1_ state spectra, consistent with past suggestions that in the S_1_ state ammonia does not interact with Mn.^61^ In contrast, the covalent binding of ammonia to a Mn ion of the OEC cluster is considered to be taking place during the S_1_ → S_2_ transition.^61,66^
The XANES region of the native S_2_ state compared to the ammonia-treated sample is shown in Figure 2b. It can be observed that there is no difference between the native and the ammonia-treated samples in the edge region, suggesting that there is no difference in the oxidation state of the Mn cluster or any major change in the local environment of the Mn ions upon ammonia binding. The effect of ammonia binding is observed in the pre-edge region, presented in Figure 2c. Upon ammonia binding to the S_2_ state, the absorption intensity of the pre-edge region decreases most prominently in the region between 6540–6542 eV and the decrease is less pronounced in the region between 6542–6543 eV. A polynomial spline was fitted to the rising edge and subtracted. Subsequently, three Voigt curves were fitted to the experimental spectra (Figure S3), with the parameters presented in Table S1.
Figure 3 shows the Mn K-edge XAS difference spectra between the native and the ammonia-treated S_1_ and S_2_ states in the pre-edge region. The binned and fitted spectra used to calculate the differences are presented in Figure S4, alongside the corresponding raw data. We use the differences between the fitted spectra as a basis for further analysis to avoid the amplification of noise-related artifacts that would result from subtracting the raw spectra. As shown in Figure 3, the intensity difference is near zero in the S_1_ state, whereas in the S_2_ state, the largest intensity differences are observed between 6539 and 6542 eV. Excitations in this region have been previously attributed to local excitations from the 1s to the 3d orbitals of Mn.^77^ Therefore, these differences indicate small geometry changes in the coordination sphere of one or more Mn ions of the cluster upon ammonia binding. In the next sections, we attempt to distinguish the ammonia binding modes that reproduce these changes with the aid of quantum chemical calculations.
Difference spectra between ammonia-treated samples and the native S1 (top) and S2 (bottom) samples. The differences between the 5-point binned experimental spectra are presented as light lines and the differences between the fitted spectra as dark lines. The difference between ammonia and native for the S2 state is the subtraction of the spectra shown in Figure 2c.
Correlation with Structural Models
3.2
To determine what the pre-edge region of the Mn XAS spectra reveals about ammonia binding in the S_2_ state, we employed quantum chemical calculations. Building on our previous study, which focused on magnetic properties and energetics,^70^ we examined 14 ammonia-bound S_2_ state models (Figure 4) that represent variations of the proposed ammonia binding modes described in Figure 1c. Since geometry optimization is conducted independently of the property under investigation, we used the same models to maintain consistency in our assessment. We note that the calculated difference spectra between the S_1_ and S_2_ states, whose structural identity has been previously established,^77^ reproduce the experimental difference spectra well (Figure S5). In type A models, ammonia replaces the O5 μ-oxo bridge of the cluster generating an amido (NH_2_^–^) bridging ligand in A1 and A5, and a nitrido bridge (N^3–^) in A2, A3, and A4. In type B and C models, ammonia substitutes the terminal Mn4 water ligands W1 and W2, respectively. Type D models feature ammonia as an additional ligand on Mn4 without dissociating a water molecule from the cluster. Finally, in type E models, ammonia coordinates as an additional ligand to the open coordination site of Mn1(III).
Structures of the inorganic cores of the ammonia-bound S2 state models. Mn(IV) ions are shown in purple, Mn(III) in pink, O atoms in red, N in blue, Ca2+ ions in yellow, and H atoms in white.
Given that the protonation states of the OEC are difficult to probe experimentally and there is no conclusive protonation state assignment either for the native or for the ammonia-bound S_2_ state,^52,105−107^ we examined variants with different protonation states for each type of model. We note that all models have the same valence distribution [Mn1, Mn2, Mn3, Mn4] = [III, IV, IV, IV]. Moreover, all models have a S = 1/2, ground state,^70^ consistent with the EPR signal of the ammonia-treated S_2_ state. To determine which ammonia binding modes are most consistent with the XAS pre-edge region, we calculated the Mn XAS spectra of the 14 models shown in Figure 4.
The calculated Mn XAS of the models compared to the untreated S_2_ state are shown in Figure 5a. To facilitate visualization, models of type A are plotted on the left panel, types B and C in the middle, and types D and E on the right panel. Figure 5a shows the spectra of the S_2_ state model with W1 = W2 = H_2_O protonation states, in line with recent Mn XAS results,^77^ suggesting that both S_1_ and S_2_ feature protonated terminal water ligands. The calculated spectra of the models compared to the S_2_ model with W2 = OH are shown in Figure S6.
(a) Calculated Mn XAS spectra of the S2 state model without ammonia (black) compared to the ammonia-bound S2 state models separated in groups A (left), B and C (middle), and D and E (right). (b) Experimental (black) and calculated difference Mn XAS spectra of the ammonia-treated S2 state from the untreated S2 state, i.e., .
Figure 5a shows that all ammonia binding modes include variants that exhibit absorption intensities lower than the S_2_ state, in line with experiment. Nevertheless, several variants can be confidently excluded. Starting with binding mode A, models A2, A3, and A4, where ammonia binds in the O5 position in its deprotonated nitrido form, can be ruled out because their absorption intensity in the 6540–6543 eV region is significantly larger than the S_2_ state. By contrast, ammonia binding in the O5 position in the amido form in models A1 and A5 diminishes the absorption intensity. Among the types B–E, models C1, E1, and E2 can also be ruled out because the calculated absorption intensities are almost identical to the S_2_ state spectra in the pre-edge region. A more refined comparative analysis for distinguishing between the models based on their similarity to the experimental spectra involves examining the difference spectra of the ammonia-treated samples relative to the untreated S_2_ state, . The difference spectra, shown in Figure 5b, contain exclusively the features that change upon ammonia binding to the OEC.
For each model, the deviation of the calculated difference spectra from the experimental difference spectra was quantified based on the root mean squared deviation (RMSD) in the region between 6538 and 6544.5 eV. The RMSDs of the variants are compared in Figure 6, and the numerical values are given in Table S2. The model with the smallest RMSD of 3.38 × 10^–3^ is C2, in which ammonia substitutes the terminal W2 ligand on Mn4. Models B2 and B1, in which ammonia substitutes the terminal W1 ligand on Mn4, follow closely, with quite larger RMSD values of 4.15 × 10^–3^ and 4.22 × 10^–3^, respectively. Interestingly, model E3, in which ammonia binds to Mn1 and W1 = W2 = H_2_O, also has one of the lowest RMSDs, 3.62 × 10^–3^. Models E1, E2, D1, and C1 have the largest RMSDs among all models shown in Figure 6.
Comparison of RMSDs of the calculated from the experimental difference spectra for the models. The RMSD values of A2, A3, and A4 are larger than 0.02, and therefore not shown in this figure.
Model C2 was previously found to be the most consistent based on energetic, magnetic, kinetic, and spectroscopic data, while B1 and B2 were also close enough to be considered good candidates in terms of these properties.^70^ Therefore, by analyzing the pre-edge region of Mn XAS using quantum chemistry, we arrive at practically the same conclusions as with magnetic spectroscopy data with respect to the ordering of models in terms of their “goodness of fit”. The fact that fundamentally different methods lead to the same conclusions is an important additional argument in favor of the ammonia substitution of a terminal water ligand on Mn4, most probably W2 (model C2) or W1 (models B1, B2).
Electronic
Structure Analysis
3.3
The data from the TD-DFT calculations enable us to examine in detail the electronic structure differences between the and S_2_ models that lead to changes in the absorption intensity upon ammonia binding. The XAS spectral shape of each model is a combination of the spectra of all individual Mn sites of the cluster. The XAS spectra of individual Mn ions are plotted in Figure S7. The XAS intensities of each Mn ion correlate strongly with the geometry of its coordination sphere.
The dramatically higher absorption intensities of the nitrido-substituted models A2, A3, and A4 relative to the amido-substituted A1 and A5 are exclusively attributed to the Mn3 and Mn4 ions. The stick spectra of the Mn3(IV) and Mn4(IV) ions of models A4 and A5 and of the native S_2_ state are compared in Figure 7. The vertical stick heights correspond to the intensities of the transitions. In Figure 7, the natural transition orbitals (NTOs) of the most intense peaks in the region between 6538 and 6542 eV of both Mn3 and Mn4 are plotted. Visual inspection of the NTOs shows that these transitions have predominantly local 1s → 3d character with small contributions from metal-to-metal and metal-to-ligand charge transfer excitations. By contrast, the peaks above 6542 eV are predominantly assigned to metal-to-metal charge transfer excitations. The intensity differences between A4, A5, and the native S_2_ in the 6539–6542 eV region can be attributed to differences in the local Mn3 and Mn4 geometries and to the nature of the nitrido and amido ligands. The local geometries of the Mn3 and Mn4 ions of A4, A5, and of the S_2_ state model are also shown in Figure 7. In A4, both Mn3 and Mn4 exhibit a pronounced distortion of their octahedral coordination spheres compared to A5 and S_2_ models. These distortions can be attributed to the strong trans effect of the nitrido (N^3–^) ligand that weakens the opposite Mn3–O and Mn4–O bonds, leading to significant elongation of about 0.2 Å. This deviation from the octahedral geometry allows the mixing of some Mn 4p character into the 3d orbitals, increasing the intensity of the pre-edge region. In addition, a visual comparison of the NTOs of A4 to those of A5 reveals that the pre-edge transitions of A4 have a more pronounced metal-to-ligand charge transfer character with the nitrido ligand playing a more significant role in the excitations than the amido ligand.
Calculated Mn K-edge XAS spectra: (a) of Mn3 and (b) Mn4 ions of models A4 (red), A5 (blue), and of the native S2 state (black). The energies and intensities of individual transitions are indicated by colored vertical lines. The acceptor NTOs of the most intense pre-edge transitions of models A4 and A5 are also depicted. At the bottom, the coordination sphere and Mn-ligand bond lengths (in Å) of Mn3 (a) and Mn4 (b) ions of each model are shown.
The pre-edge intensity differences between the models in which ammonia replaces a terminal water ligand on Mn4, i.e., models of type B and C, correlate to the degrees of distortion from the octahedral geometry around the Mn3 and Mn4 ions. Figure 8 analyzes two characteristic examples. In models C2 and C1, where ammonia substitutes the terminal ligand W2 on Mn4, differences in the protonation state of the W1 terminal ligand lead to variations primarily in the absorption intensities originating from the Mn3 ions. As shown in Figure 8a, the more intense Mn3 1s → 3d transitions in C1 correlate with a greater distortion in the Mn3 coordination geometry, particularly along the Mn3–O5 axis. Similarly, C1 shows a higher pre-edge intensity than B1, where ammonia binds to Mn4 in the W2 position rather than W1. Here, the origin of this difference lies in the increased degree of distortion around Mn4.
Calculated XAS spectra: (a) of Mn3 ions of models C1 (blue), C2 (red), and of the native S2 state (black), and (b) of Mn4 ions of models C1 (blue), B1 (red), and of the native S2 state (black). The energies and intensities of individual transitions are indicated by colored vertical lines. The acceptor NTOs of the most intense pre-edge transitions of models C1 and C2 are also depicted. At the bottom, the coordination sphere and Mn-ligand bond lengths (in Å) of the corresponding Mn ions of each model are shown.
Overall, these results underscore the high sensitivity of XAS to subtle perturbations in the local Mn coordination geometry. This enables distinguishing even between species with the same valence distributions. It is important to note that these structural perturbations result from different types of ammonia binding and the calculated spectra should be insensitive to minor structural perturbations arising from the chosen geometry optimization method. The present results strongly favor ammonia binding modes of type B, C, and E, as well as the possible variants among each mode. Nevertheless, it is important to note that the present analysis cannot explicitly account for the possibility of heterogeneity in the ammonia-treated samples. Specifically, it has been previously suggested based on interpretation of time-resolved detection of O_2_ formation, recombination fluorescence and FTIR experiments,^65^ that two different ammonia-bound S_2_ state forms might coexist in comparable amounts. Based on spectroscopic, magnetic, kinetic, and energetic results these forms were suggested to correspond to terminally substituted W1 and W2 populations.^65,70,108^ As we showed in a recent study,^70^ these models are not easily distinguishable by EPR. The present HERFD XAS results are consistent with both of these binding modes, but suggest that these models are not practically distinguishable by their pre-edge features either. In addition, XAS is consistent with ammonia binding as a sixth ligand on Mn1. However, the latter binding mode was found inconsistent with magnetic spectroscopy data.^70^ Overall, the available experimental data point toward terminal W1/W2 ligand substitution by ammonia and the question of heterogeneity in W1/W2 substitution by ammonia remains open.
Conclusions
4
We presented Mn K-edge HERFD XAS of ammonia-bound S_2_ state samples of PSII from T. vestitus, used in combination with quantum chemical calculations to distinguish models for ammonia binding to the S_2_ state of the OEC. Mn K-edge XAS spectra were calculated for models representing all proposed ammonia binding modes and compared with experimental difference spectra between ammonia-treated and untreated PSII samples. Our results reveal significant deviations from the experimental spectra in models where ammonia substitutes the bridging μ-oxo ligand O5, especially in its nitrido form. Likewise, the addition of ammonia as a sixth ligand on Mn4 is also found less favorable. The binding mode in which ammonia coordinates as a terminal ligand on Mn4, replacing W2, aligns most closely with the experimental data, followed by models where ammonia replaces the W1 terminal ligand on Mn4. Interestingly, a variant featuring ammonia as an additional sixth ligand on Mn1 also shows one of the lowest deviations from the experimental data. Quantum chemical analysis reveals that the spectral differences among the models originate from the degree of distortion in the Mn octahedral geometry, which gives rise to 4p mixing into Mn 3d orbitals. This structural sensitivity highlights the effectiveness of Mn K-edge HERFD XAS in probing the geometric structure of the OEC, even across variants of the same state and valence distribution. The geometry of the cluster is affected by both the ammonia binding mode and the protonation states of the terminal ligands on Mn4, yielding several possible structural variants. Although the present results do not allow a definitive distinction among the W1 and W2 terminal ligand substitution by ammonia, they offer strong additional and independent support from HERFD XAS for ammonia substitution of a terminal water ligand on Mn4.
The reference list from the paper itself. Each links out to its DOI / PubMed record.
- 1Shevela D.; Bjorn L. O.Photosynthesis: Solar Energy for Life; World Scientific Publishing: Singapore, 2018; p 204.
- 2Blankenship R. E.Molecular mechanisms of photosynthesis, 3rd Ed.; John Wiley & Sons: Chichester, 2021; p 352.
- 3Shevela D.; Kern J. F.; Govindjee G.; Messinger J. Solar energy conversion by photosystem II: principles and structures. Photosynth. Res. 2023, 156, 279–307. 10.1007/s 11120-022-00991-y.36826741 PMC 10203033 · doi ↗ · pubmed ↗
- 4Pantazis D. A. In Solar-to-Chemical Conversion: Photocatalytic and Photoelectrochemical Processes; Sun H., Ed.; Wiley: 2021, pp. 41–76.
- 5Lubitz W.; Chrysina M.; Cox N. Water oxidation in photosystem II. Photosynth. Res. 2019, 142, 105–125. 10.1007/s 11120-019-00648-3.31187340 PMC 6763417 · doi ↗ · pubmed ↗
- 6Yano J.; Yachandra V. Mn 4Ca Cluster in Photosynthesis: Where and How Water is Oxidized to Dioxygen. Chem. Rev 2014, 114, 4175–4205. 10.1021/cr 4004874.24684576 PMC 4002066 · doi ↗ · pubmed ↗
- 7Shen J.-R. The Structure of Photosystem II and the Mechanism of Water Oxidation in Photosynthesis. Annu. Rev. Plant Biol. 2015, 66, 23–48. 10.1146/annurev-arplant-050312-120129.25746448 · doi ↗ · pubmed ↗
- 8Joliot P.; Barbieri G.; Chabaud R. Un nouveau modele des centres photochimiques du systeme II. Photochem. Photobiol. 1969, 10, 309–329. 10.1111/j.1751-1097.1969.tb 05696.x. · doi ↗