Association of unsaturated fatty acid intake with risk of all-cause death in patients with osteoarthritis
Tianyang Li, Zhenzhou Tang, Sucheng Li, Weigang Jiang, Minhua Lu

TL;DR
Higher intake of certain unsaturated fatty acids is linked to lower risk of death in people with osteoarthritis.
Contribution
This study identifies specific unsaturated fatty acids associated with reduced mortality risk in osteoarthritis patients.
Findings
Monounsaturated fatty acids ≥31.30 reduced all-cause mortality risk in OA patients.
Omega-3 fatty acid ≥1.98 and omega-6 fatty acid ≥18.04 were linked to lower mortality risk.
Eicosenoic acid and alpha-linolenic acid at certain levels also showed mortality risk reduction.
Abstract
To investigate the relationship between unsaturated fatty acids (UFAs) intake and the risk of all-cause mortality in osteoarthritis (OA) patients. This cohort study included the data of 3,271 participants with OA using data from the National Health and Nutrition Examination Survey (NHANES). Univariate and multivariable weighted Cox regression models were applied to analyze the relationship between UFAs intake and the risk of mortality in patients with OA. Subgroup analysis was used in age, gender, cardiovascular disease (CVD), hypertension, and diabetes. Hazard ratio (HR), and 95% confidence interval (CI) were calculated. The median follow-up time was 38.00 (69.00, 104.00) months, with 2,670 participants survived and 601 died. Monounsaturated fatty acids (MUFAs) ≥31.30 was associated with reduced risk of all-cause mortality in OA patients (HR = 0.48, 95% CI: 0.32–0.73). Lowered risk…
Genes, proteins, chemicals, diseases, species, mutations and cell lines named across the full text — each resolved to its canonical identifier and authoritative record.
Click any figure to enlarge with its caption.
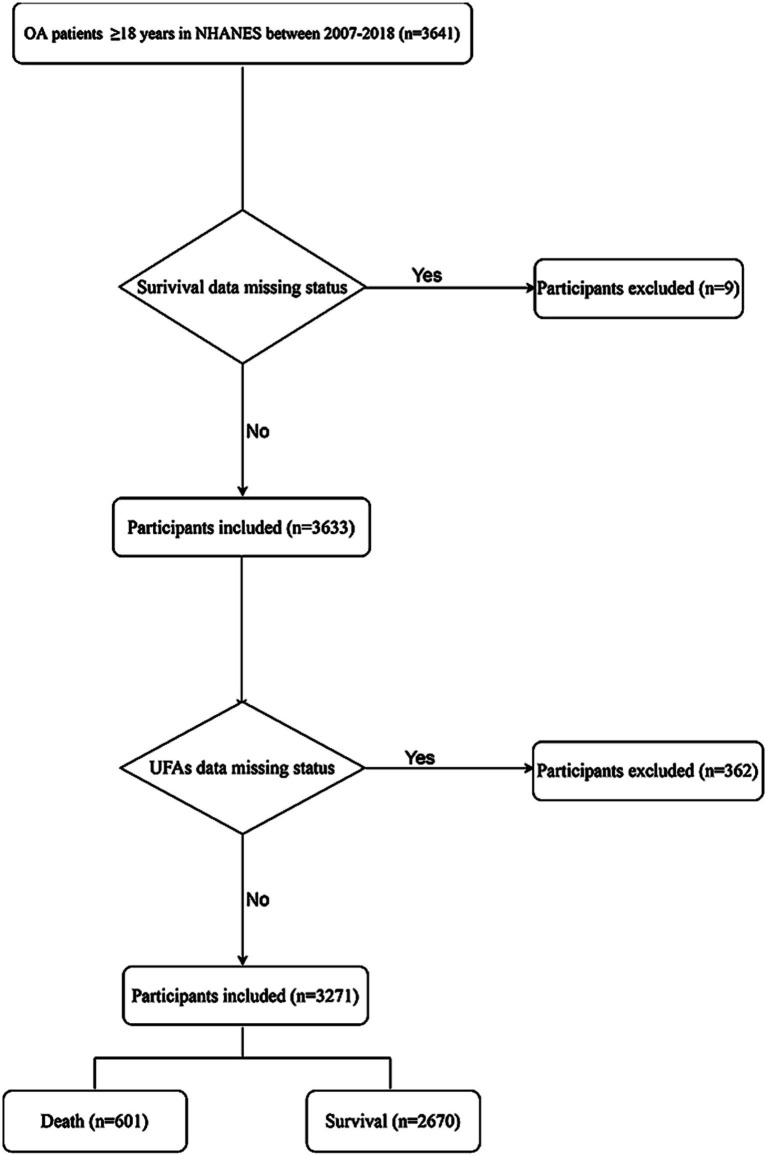 Figure 1
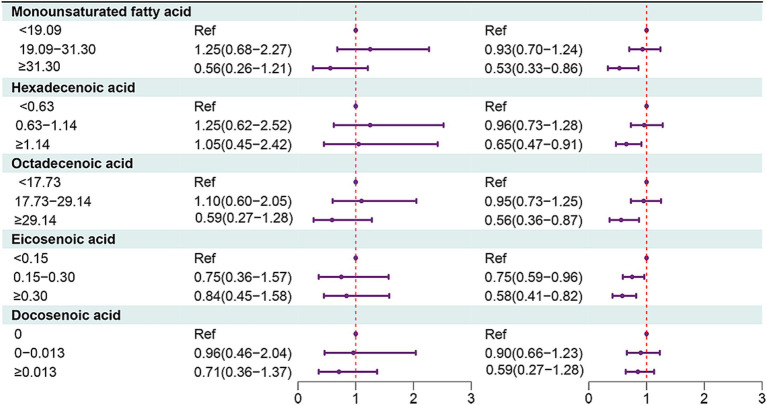 Figure 2
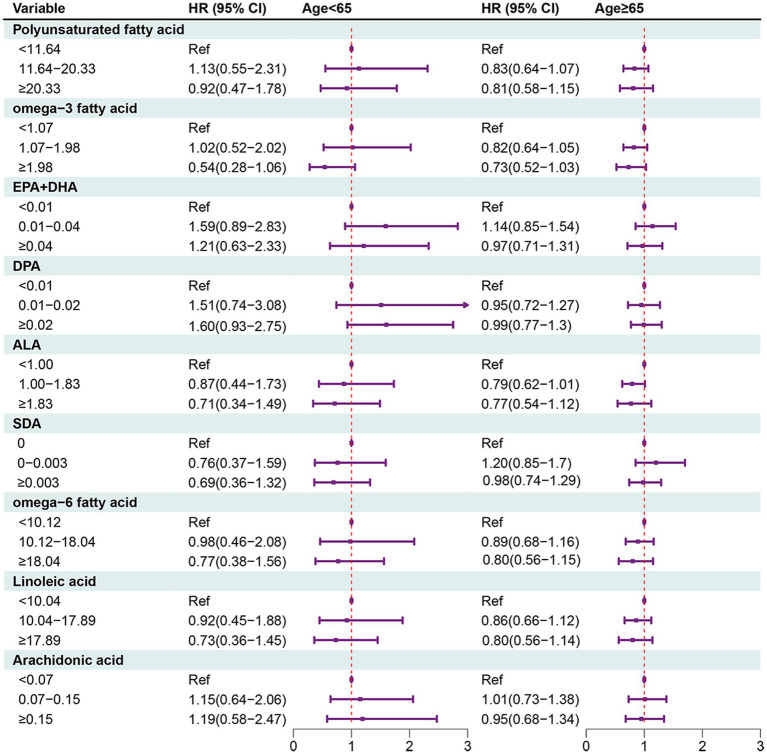 Figure 3
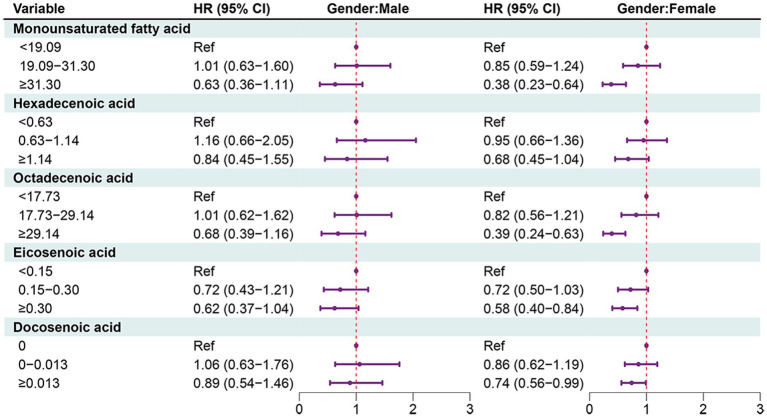 Figure 4
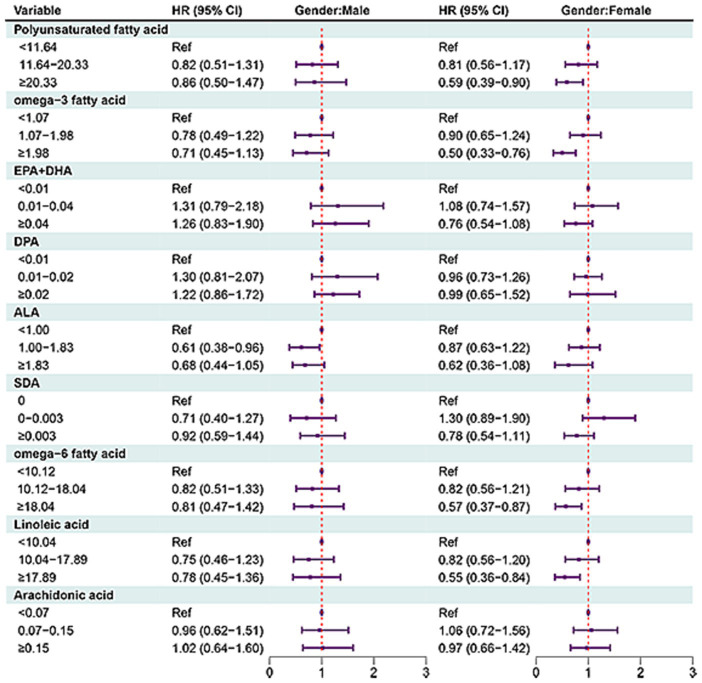 Figure 5
| Variables | Total ( | All-cause mortality | Statistics |
| |
|---|---|---|---|---|---|
| Survival group ( | Death group ( | ||||
| Age (years), mean (S.E.) | 61.76 (0.33) | 60.33 (0.36) | 70.59 (0.59) | <0.001 | |
| Gender, | 0.070 | ||||
| Male | 1,185 (36.02) | 927 (35.18) | 258 (41.23) | ||
| Female | 2,086 (63.98) | 1,743 (64.82) | 343 (58.77) | ||
| Race, | 0.005 | ||||
| White | 2,008 (81.72) | 1,581 (81.07) | 427 (85.80) | ||
| Black | 523 (6.80) | 441 (6.92) | 82 (6.08) | ||
| Other | 740 (11.48) | 648 (12.02) | 92 (8.13) | ||
| Education status, | <0.001 | ||||
| High school and below | 1,401 (36.10) | 1,106 (34.83) | 295 (43.99) | ||
| Above high school | 1,870 (63.90) | 1,564 (65.17) | 306 (56.01) | ||
| PIR, | <0.001 | ||||
| ≤1.3 | 876 (18.26) | 713 (17.52) | 163 (22.84) | ||
| 1.3–1.85 | 470 (11.83) | 354 (10.94) | 116 (17.37) | ||
| 1.85 | 1,925 (69.92) | 1,603 (71.55) | 322 (59.79) | ||
| Marital status, | <0.001 | ||||
| Married | 1,788 (60.55) | 1,510 (62.61) | 278 (47.79) | ||
| Widowed | 558 (13.81) | 372 (11.33) | 186 (29.23) | ||
| Divorced | 477 (13.08) | 398 (13.01) | 79 (13.51) | ||
| Separated | 87 (1.67) | 72 (1.69) | 15 (1.52) | ||
| Never married | 246 (7.46) | 214 (7.77) | 32 (5.55) | ||
| Living with partner | 115 (3.43) | 104 (3.59) | 11 (2.40) | ||
| Smoking status, | 0.013 | ||||
| No | 1,565 (47.90) | 1,310 (49.00) | 255 (41.08) | ||
| Yes | 1,706 (52.10) | 1,360 (51.00) | 346 (58.92) | ||
| Drinking status, | 0.684 | ||||
| No | 1,169 (30.26) | 952 (30.12) | 217 (31.17) | ||
| Yes | 2,102 (69.74) | 1,718 (69.88) | 384 (68.83) | ||
| Physical activity (MET min/week), | <0.001 | ||||
| <450 | 1,563 (41.57) | 1,178 (38.40) | 385 (61.27) | ||
| ≥450 | 1,708 (58.43) | 1,492 (61.60) | 216 (38.73) | ||
| Duration of arthritis, mean (S.E.) | 12.59 (0.29) | 12.06 (0.32) | 15.84 (0.71) | <0.001 | |
| Osteoporosis, | 0.212 | ||||
| No | 1,665 (50.17) | 1,350 (50.31) | 315 (49.34) | ||
| Yes | 10 (0.35) | 4 (0.25) | 6 (0.95) | ||
| Unknown | 1,596 (49.48) | 1,316 (49.45) | 280 (49.71) | ||
| Fracture, | 0.002 | ||||
| No | 1,671 (47.85) | 1,327 (47.19) | 344 (51.89) | ||
| Yes | 406 (12.95) | 313 (12.34) | 93 (16.74) | ||
| Unknown | 1,194 (39.20) | 1,030 (40.46) | 164 (31.38) | ||
| Hypertension, | <0.001 | ||||
| No | 629 (23.13) | 572 (25.18) | 57 (10.38) | ||
| Yes | 2,642 (76.87) | 2,098 (74.82) | 544 (89.62) | ||
| Diabetes, | <0.001 | ||||
| No | 2,362 (77.85) | 1,969 (79.36) | 393 (68.43) | ||
| Yes | 909 (22.15) | 701 (20.64) | 208 (31.57) | ||
| Dyslipidemia, | 0.546 | ||||
| No | 648 (19.36) | 516 (19.19) | 132 (20.42) | ||
| Yes | 2,623 (80.64) | 2,154 (80.81) | 469 (79.58) | ||
| CVD, | <0.001 | ||||
| No | 2,554 (81.67) | 2,163 (83.85) | 391 (68.13) | ||
| Yes | 717 (18.33) | 507 (16.15) | 210 (31.87) | ||
| CKD, | <0.001 | ||||
| No | 2,685 (85.83) | 2,296 (88.59) | 389 (68.69) | ||
| Yes | 375 (9.00) | 213 (6.47) | 162 (24.74) | ||
| Unknown | 211 (5.17) | 161 (4.95) | 50 (6.57) | ||
| Cancer, | 0.002 | ||||
| No | 2,597 (78.01) | 2,170 (79.15) | 427 (70.88) | ||
| Yes | 674 (21.99) | 500 (20.85) | 174 (29.12) | ||
| BMI, | 0.024 | ||||
| <25 | 668 (20.78) | 515 (20.00) | 153 (25.62) | ||
| 25–30 | 1,001 (31.52) | 795 (31.54) | 206 (31.38) | ||
| ≥30 | 1,602 (47.70) | 1,360 (48.46) | 242 (42.99) | ||
| Energy (kcal), mean (S.E.) | 1947.05 (20.14) | 1966.48 (21.98) | 1826.38 (42.25) | 0.003 | |
| White blood cell count (1,000 cells/μL), mean (S.E.) | 7.32 (0.06) | 7.29 (0.06) | 7.51 (0.14) | 0.133 | |
| Uric acid (μmol/L), mean (S.E.) | 325.52 (1.82) | 322.77 (1.96) | 342.62 (5.05) | <0.001 | |
| Non-steroidal anti-inflammatory agents, | 0.003 | ||||
| No | 2,847 (86.78) | 2,292 (85.90) | 555 (92.21) | ||
| Yes | 424 (13.22) | 378 (14.10) | 46 (7.79) | ||
| MUFAs (g), mean (S.E.) | 27.30 (0.41) | 27.88 (0.46) | 23.64 (0.65) | <0.001 | |
| MUFAs (g), | <0.001 | ||||
| <19.09 | 1,155 (32.97) | 909 (31.91) | 246 (39.56) | ||
| 19.09–31.30 | 1,119 (33.96) | 896 (33.15) | 223 (39.01) | ||
| ≥31.30 | 997 (33.06) | 865 (34.94) | 132 (21.42) | ||
| Hexadecenoic acid (g), mean (S.E.) | 1.03 (0.02) | 1.04 (0.02) | 0.91 (0.03) | <0.001 | |
| Hexadecenoic acid (g), | 0.048 | ||||
| <0.63 | 1,115 (32.98) | 887 (32.24) | 228 (37.61) | ||
| 0.63–1.14 | 1,073 (33.96) | 860 (33.73) | 213 (35.37) | ||
| ≥1.14 | 1,083 (33.06) | 923 (34.03) | 160 (27.02) | ||
| Octadecenoic acid (g), mean (S.E.) | 25.37 (0.39) | 25.91 (0.44) | 22.03 (0.60) | <0.001 | |
| Octadecenoic acid (g), | <0.001 | ||||
| <17.73 | 1,142 (32.96) | 897 (31.87) | 245 (39.74) | ||
| 17.73–29.14 | 1,125 (34.01) | 909 (33.39) | 216 (37.84) | ||
| ≥29.14 | 1,004 (33.03) | 864 (34.73) | 140 (22.43) | ||
| Eicosenoic acid (g), mean (S.E.) | 0.29 (0.01) | 0.30 (0.01) | 0.22 (0.01) | <0.001 | |
| Eicosenoic acid (g), | <0.001 | ||||
| <0.15 | 1,136 (32.94) | 863 (30.87) | 273 (45.75) | ||
| 0.15–0.30 | 1,096 (34.05) | 912 (34.59) | 184 (30.68) | ||
| ≥0.30 | 1,039 (33.01) | 895 (34.53) | 144 (23.58) | ||
| Docosenoic acid (g), mean (S.E.) | 0.04 (0.00) | 0.04 (0.00) | 0.02 (0.00) | 0.005 | |
| Docosenoic acid (g), | <0.001 | ||||
| 0 | 661 (16.99) | 491 (15.70) | 170 (25.01) | ||
| 0–0.013 | 1,339 (41.49) | 1,105 (41.48) | 234 (41.58) | ||
| ≥0.013 | 1,271 (41.51) | 1,074 (42.82) | 197 (33.41) | ||
| PUFAs (g), mean (S.E.) | 17.97 (0.28) | 18.41 (0.32) | 15.23 (0.46) | <0.001 | |
| PUFAs (g), | <0.001 | ||||
| <11.64 | 1,154 (32.98) | 889 (31.49) | 265 (42.21) | ||
| 11.64–20.33 | 1,088 (33.99) | 896 (34.06) | 192 (33.59) | ||
| ≥20.33 | 1,029 (33.02) | 885 (34.45) | 144 (24.20) | ||
| Omega-3 fatty acid (g), mean (S.E.) | 1.83 (0.04) | 1.88 (0.04) | 1.53 (0.07) | <0.001 | |
| Omega-3 fatty acid (g), | <0.001 | ||||
| <1.07 | 1,133 (33.00) | 871 (31.51) | 262 (42.22) | ||
| 1.07–1.98 | 1,106 (34.03) | 897 (33.72) | 209 (35.94) | ||
| ≥1.98 | 1,032 (32.97) | 902 (34.77) | 130 (21.84) | ||
| EPA (g), mean (S.E.) | 0.03 (0.00) | 0.03 (0.00) | 0.02 (0.00) | 0.009 | |
| EPA (g), | 0.002 | ||||
| 0 | 457 (13.35) | 349 (13.15) | 108 (14.58) | ||
| 0–0.007 | 1,417 (43.29) | 1,153 (42.35) | 264 (49.09) | ||
| ≥0.007 | 1,397 (43.36) | 1,168 (44.50) | 229 (36.33) | ||
| DHA (g), mean (S.E.) | 0.06 (0.00) | 0.06 (0.00) | 0.05 (0.01) | 0.021 | |
| DHA (g), | 0.924 | ||||
| 0 | 482 (14.20) | 386 (14.15) | 96 (14.55) | ||
| 0–0.018 | 1,306 (42.61) | 1,084 (42.78) | 222 (41.59) | ||
| ≥0.018 | 1,483 (43.18) | 1,200 (43.07) | 283 (43.86) | ||
| EPA + DHA (g), mean (S.E.) | 0.09 (0.01) | 0.10 (0.01) | 0.07 (0.01) | 0.012 | |
| EPA + DHA (g), | 0.661 | ||||
| <0.01 | 1,039 (32.82) | 831 (32.59) | 208 (34.19) | ||
| 0.01–0.04 | 1,091 (34.02) | 906 (33.87) | 185 (34.93) | ||
| ≥0.04 | 1,141 (33.17) | 933 (33.54) | 208 (30.87) | ||
| DPA (g), mean (S.E.) | 0.02 (0.00) | 0.02 (0.00) | 0.02 (0.00) | <0.001 | |
| DPA (g), | <0.001 | ||||
| <0.01 | 1,006 (29.54) | 761 (28.05) | 245 (38.80) | ||
| 0.01–0.02 | 1,191 (36.86) | 1,003 (37.66) | 188 (31.83) | ||
| ≥0.02 | 1,074 (33.61) | 906 (34.29) | 168 (29.37) | ||
| ALA (g), mean (S.E.) | 1.71 (0.04) | 1.75 (0.04) | 1.44 (0.07) | <0.001 | |
| ALA (g), | <0.001 | ||||
| <1.00 | 1,147 (33.00) | 877 (31.48) | 270 (42.40) | ||
| 1.00–1.83 | 1,090 (33.88) | 895 (33.86) | 195 (33.97) | ||
| ≥1.83 | 1,034 (33.13) | 898 (34.65) | 136 (23.63) | ||
| SDA (g), mean (S.E.) | 0.01 (0.00) | 0.01 (0.00) | 0.01 (0.00) | 0.072 | |
| SDA (g), | 0.045 | ||||
| 0 | 1,723 (50.95) | 1,361 (49.86) | 362 (57.70) | ||
| 0–0.003 | 636 (21.17) | 542 (21.66) | 94 (18.10) | ||
| ≥0.003 | 912 (27.88) | 767 (28.48) | 145 (24.20) | ||
| Omega-6 fatty acid (g), mean (S.E.) | 15.89 (0.25) | 16.29 (0.28) | 13.35 (0.40) | <0.001 | |
| Omega-6 fatty acid (g), | <0.001 | ||||
| <10.12 | 1,154 (32.86) | 887 (31.34) | 267 (42.29) | ||
| 10.12–18.04 | 1,089 (34.12) | 894 (34.05) | 195 (34.58) | ||
| ≥18.04 | 1,028 (33.02) | 889 (34.61) | 139 (23.12) | ||
| Linoleic acid (g), mean (S.E.) | 15.75 (0.25) | 16.16 (0.28) | 13.22 (0.40) | <0.001 | |
| Linoleic acid (g), | <0.001 | ||||
| <10.04 | 1,155 (32.90) | 887 (31.33) | 268 (42.65) | ||
| 10.04–17.89 | 1,087 (34.08) | 893 (34.06) | 194 (34.23) | ||
| ≥17.89 | 1,029 (33.02) | 890 (34.62) | 139 (23.12) | ||
| Arachidonic acid (g), mean (S.E.) | 0.14 (0.00) | 0.14 (0.00) | 0.12 (0.01) | 0.069 | |
| Arachidonic acid (g), | 0.078 | ||||
| <0.07 | 1,094 (32.93) | 872 (32.16) | 222 (37.71) | ||
| 0.07–0.15 | 1,080 (33.96) | 881 (33.96) | 199 (33.96) | ||
| ≥0.15 | 1,097 (33.11) | 917 (33.88) | 180 (28.32) | ||
| Follow-up duration (month), mean (S.E.) | 75.90 (1.83) | 77.38 (1.98) | 66.67 (3.30) | 0.003 | |
| Variables | HR (95% CI) |
|
|---|---|---|
| Age | 1.08 (1.07–1.10) | <0.001 |
| Gender | ||
| Male | Ref | |
| Female | 0.78 (0.61–0.99) | 0.048 |
| Race | ||
| White | Ref | |
| Black | 0.90 (0.71–1.14) | 0.375 |
| Other | 0.77 (0.58–1.02) | 0.073 |
| Education status | ||
| High school and below | Ref | |
| Above high school | 0.73 (0.60–0.90) | 0.003 |
| PIR | ||
| ≤1.3 | Ref | |
| 1.3–1.85 | 1.10 (0.80–1.52) | 0.536 |
| >1.85 | 0.65 (0.52–0.82) | <0.001 |
| Marital status | ||
| Married | Ref | |
| Widowed | 3.23 (2.47–4.24) | <0.001 |
| Divorced | 1.34 (0.94–1.91) | 0.100 |
| Separated | 1.23 (0.63–2.38) | 0.539 |
| Never married | 0.97 (0.55–1.71) | 0.923 |
| Living with partner | 0.93 (0.41–2.08) | 0.851 |
| Smoking status | ||
| No | Ref | |
| Yes | 1.31 (1.05–1.63) | 0.016 |
| Drinking status | ||
| No | Ref | |
| Yes | 0.83 (0.68–1.02) | 0.072 |
| Physical activity (MET min/week) | ||
| <450 | Ref | |
| ≥450 | 0.42 (0.34–0.51) | <0.001 |
| Duration of arthritis | 1.02 (1.01–1.03) | <0.001 |
| Osteoporosis | ||
| No | Ref | |
| Yes | 8.39 (3.12–22.57) | <0.001 |
| Unknown | 1.50 (1.19–1.89) | <0.001 |
| Fracture | ||
| No | Ref | |
| Yes | 1.31 (0.99–1.73) | 0.055 |
| Unknown | 1.07 (0.80–1.43) | 0.626 |
| Hypertension | ||
| No | Ref | |
| Yes | 2.88 (2.13–3.88) | <0.001 |
| Diabetes | ||
| No | Ref | |
| Yes | 1.94 (1.56–2.42) | <0.001 |
| Dyslipidemia | ||
| No | Ref | |
| Yes | 0.99 (0.79–1.23) | 0.908 |
| CVD | ||
| No | Ref | |
| Yes | 2.52 (1.92–3.32) | <0.001 |
| CKD | ||
| No | Ref | |
| Yes | 4.30 (3.32–5.58) | <0.001 |
| Unknown | 1.64 (1.09–2.47) | 0.017 |
| Cancer | ||
| No | Ref | |
| Yes | 1.67 (1.29–2.15) | <0.001 |
| BMI | ||
| <25 | Ref | |
| 25–30 | 0.82 (0.65–1.05) | 0.120 |
| ≥30 | 0.85 (0.65–1.11) | 0.233 |
| Energy | 0.84 (0.74–0.95) | 0.005 |
| White blood cell count | 1.03 (1.01–1.06) | 0.007 |
| Uric acid | 1.24 (1.10–1.40) | <0.001 |
| Non-steroidal anti-inflammatory agents | ||
| No | Ref | |
| Yes | 0.58 (0.38–0.89) | 0.013 |
| Variables | Model 1 | Model 2 | ||
|---|---|---|---|---|
| HR (95% CI) |
| HR (95% CI) |
| |
| MUFAs | ||||
| <19.09 | Ref | Ref | ||
| 19.09–31.30 | 0.98 (0.77–1.25) | 0.883 | 0.88 (0.68–1.14) | 0.332 |
| ≥31.30 | 0.56 (0.41–0.76) | <0.001 | 0.48 (0.32–0.73) | <0.001 |
| Hexadecenoic acid | ||||
| <0.63 | Ref | Ref | ||
| 0.63–1.14 | 0.90 (0.70–1.15) | 0.400 | 0.99 (0.76–1.29) | 0.935 |
| ≥1.14 | 0.69 (0.52–0.93) | 0.017 | 0.75 (0.53–1.07) | 0.116 |
| Octadecenoic acid | ||||
| <17.73 | Ref | Ref | ||
| 17.73–29.14 | 0.96 (0.74–1.23) | 0.735 | 0.87 (0.67–1.12) | 0.271 |
| ≥29.14 | 0.57 (0.42–0.77) | <0.001 | 0.50 (0.34–0.72) | <0.001 |
| Eicosenoic acid | ||||
| <0.15 | Ref | Ref | ||
| 0.15–0.30 | 0.70 (0.55–0.89) | 0.005 | 0.70 (0.55–0.90) | 0.005 |
| ≥0.30 | 0.64 (0.49–0.83) | 0.001 | 0.62 (0.46–0.84) | 0.003 |
| Docosenoic acid | ||||
| 0 | Ref | Ref | ||
| 0–0.013 | 0.93 (0.71–1.22) | 0.585 | 0.89 (0.68–1.17) | 0.407 |
| ≥0.013 | 0.76 (0.58–0.99) | 0.048 | 0.77 (0.58–1.02) | 0.072 |
| PUFAs | ||||
| <11.64 | Ref | Ref | ||
| 11.64–20.33 | 0.80 (0.63–1.01) | 0.061 | 0.82 (0.63–1.07) | 0.137 |
| ≥20.33 | 0.67 (0.53–0.84) | <0.001 | 0.72 (0.54–0.96) | 0.025 |
| Omega-3 fatty acid | ||||
| <1.07 | Ref | Ref | ||
| 1.07–1.98 | 0.90 (0.69–1.17) | 0.409 | 0.83 (0.65–1.07) | 0.147 |
| ≥1.98 | 0.61 (0.47–0.79) | <0.001 | 0.60 (0.45–0.81) | <0.001 |
| EPA + DHA | ||||
| <0.01 | Ref | Ref | ||
| 0.01–0.04 | 1.07 (0.81–1.41) | 0.638 | 1.20 (0.92–1.58) | 0.180 |
| ≥0.04 | 0.91 (0.70–1.19) | 0.489 | 0.99 (0.77–1.28) | 0.973 |
| DPA | ||||
| <0.01 | Ref | Ref | ||
| 0.01–0.02 | 0.89 (0.67–1.20) | 0.450 | 1.05 (0.80–1.39) | 0.710 |
| ≥0.02 | 0.91 (0.70–1.18) | 0.470 | 1.10 (0.87–1.40) | 0.402 |
| ALA | ||||
| <1.00 | Ref | Ref | ||
| 1.00–1.83 | 0.84 (0.64–1.10) | 0.205 | 0.75 (0.59–0.96) | 0.024 |
| ≥1.83 | 0.66 (0.51–0.86) | 0.002 | 0.65 (0.46–0.92) | 0.017 |
| SDA | ||||
| 0 | Ref | Ref | ||
| 0–0.003 | 0.89 (0.65–1.20) | 0.435 | 1.05 (0.77–1.43) | 0.735 |
| ≥0.003 | 0.78 (0.59–1.02) | 0.071 | 0.90 (0.69–1.19) | 0.466 |
| Omega-6 fatty acid | ||||
| <10.12 | Ref | Ref | ||
| 10.12–18.04 | 0.82 (0.64–1.06) | 0.130 | 0.83 (0.63–1.10) | 0.198 |
| ≥18.04 | 0.64 (0.50–0.81) | <0.001 | 0.68 (0.51–0.92) | 0.012 |
| Linoleic acid | ||||
| <10.04 | Ref | Ref | ||
| 10.04–17.89 | 0.81 (0.63–1.04) | 0.092 | 0.80 (0.61–1.06) | 0.117 |
| ≥17.89 | 0.63 (0.49–0.80) | <0.001 | 0.67 (0.50–0.90) | 0.008 |
| Arachidonic acid | ||||
| <0.07 | Ref | Ref | ||
| 0.07–0.15 | 0.94 (0.71–1.25) | 0.686 | 1.01 (0.75–1.36) | 0.949 |
| ≥0.15 | 0.91 (0.71–1.17) | 0.447 | 1.02 (0.78–1.33) | 0.884 |
Peer Reviews
No public reviews on file for this paper yet. If you reviewed it on a platform where reviews are public (OpenReview, ICLR, NeurIPS, ICML), you can paste yours below so the community can read it here.
Videos
No videos yet. Explain this paper in a talk, walkthrough, or lecture? Add one.
Taxonomy
TopicsFatty Acid Research and Health · Liver Disease Diagnosis and Treatment · Eicosanoids and Hypertension Pharmacology
Introduction
Osteoarthritis (OA) is one of the most important chronic diseases that leads to the degeneration and loss of cartilage within joints, resulting in a huge burden to patients and society (1). A study based on Global Burden of Disease (GBD) data revealed that OA had an annual global increase of 0.32% in age standardized incidence rate or approximately 9% increase over the 28-year period from 1990 to 2017 (2). Compared with the general population, patients with OA have a significantly increased risk of all-cause mortality (3). A number of observational studies have reported that people with OA are at increased risk of premature mortality compared to the general population (4, 5). The primary management of OA may necessitate sequential treatment (6), thus, to identify more reliable biomarkers associated with the prognosis of OA patients is of great value.
Previous studies highlighted the significance of joint-specific inflammation and oxidative stress in the progression and prognosis of OA (7–9), indicating that incorporating nutrients with anti-inflammatory properties into nutritional interventions may confer benefits. Unsaturated fatty acids (UFAs) are essential fatty acids for human body (10). Polyunsaturated fatty acids (PUFAs), especially omega-3 fatty acids, have been found to help improve pain, cartilage loss and joint function in OA patients due to their antioxidant and anti-inflammatory properties (11). Omega-3 fatty acids have been proposed as potential therapeutic agents for individuals with OA owing to their capacity to attenuate the systemic inflammatory response and foster an environment that inhibits cartilage degradation (11). In addition, studies have found that monounsaturated fatty acids (MUFAs) and PUFA might alleviate the progression of knee OA (12). However, whether UFAs played roles on the prognosis of patients with OA was still unclear.
This study aimed to investigate the relationship between UFAs intake and the risk of all-cause mortality in OA patients based on the data from National Health and Nutrition Examination Survey (NHANES). Subgroup analysis was performed in terms of age, gender, complicated with cardiovascular disease (CVD), diabetes, or hypertension.
Methods
Study design and population
In this cohort study, the records of 3,642 participants with OA were extracted from NHANES between 2007–2018. NHANES is an ongoing survey of non-institutionalized civilians residing in the United States, utilizing a complex sampling design that oversamples specific minority groups, income brackets, and age ranges (13). Data from NHANES are publicly available from https://wwwn.cdc.gov/nchs/nhanes/Default.aspx. Participants included should meet the following criteria: (1) ≥18 years old; (2) OA based on self-reported personal interview data. Participants were asked if they had ever been told by their doctor or another health professional that they had OA. The exclusion criteria of participants were: (1) missing survival data; (2) information of unsaturated fatty acid intake. Finally, 3,271 participants were analyzed.
Main variables and outcome
Main variables were MUFAs including total MUFAs, hexadecenoic acid, octadecenoic acid (g), eicosenoic acid (g), and docosenoic acid (g), and PUFAs including total PUFAs, total omega-3 [eicosapentaenoic acid (EPA) + docosahexaenoic acid (DHA) + docosapentaenoic acid (DPA) + alpha-linolenic acid (ALA) + stearidonic acid (SDA)], EPA + DHA, DPA, ALA, SDA, total omega-6 (linoleic acid +arachidonic acid), linoleic acid, and arachidonic acid.
The food and nutrient intake of each participant in the NHANES database was recorded through a 24-h dietary recall interview. The 24-h dietary recall interview is comprised of two parts, the 24-h recall and a short set of post-dietary recall questions. Information collected from the 24-h recall interview will be coded and linked to a database of nutrient composition of foods. Calculations of total daily intakes of energy and 51 dietary components, including 19 individual fatty acids will be derived from these data. Following the dietary recall, the second part of the dietary interview will consist of a short questionnaire. The Food and Nutrient Database for Dietary Studies provided by the United States Department of Agriculture was utilized to calculate the consumption of UFAs (14). The intake of dietary supplements during the previous month, including dosage, frequency, and duration of consumption, was determined based on the questionnaire interview (15). The daily total intake of UFAs was determined by calculating the average of the two 24-h dietary intake records and dietary supplements intake.
All-cause mortality was the outcome in our study. The median follow-up time was 38.00 (69.00, 104.00) months.
Potential covariates and definitions
Age (years), gender (males or females), race (White, Black or other races), education status (high school and below, or above high school), poverty to income ratio (PIR) (≤1.3, 1.3–1.85, or >1.85) (16, 17), marital status (married, widowed, divorced, separated, never married, or living with partner), smoking status (yes or no), drinking status (yes or no), physical activity [<450 metabolic equivalent (MET) × min/week or ≥450 MET × min/week], duration of arthritis, osteoporosis (yes or no), fracture (yes or no), hypertension (yes or no), diabetes (yes or no), dyslipidemia (yes or no), cardiovascular disease (CVD) (yes or no), chronic kidney disease (CKD) (yes or no), cancer (yes or no), BMI (<25 kg/m^2^, 25–30 kg/m^2^, or ≥30 kg/m^2^), energy, white blood cell count, uric acid, and non-steroidal anti-inflammatory agents (yes or no) were variables analyzed.
Statistical analysis
All the data were analyzed in a weighted manner. The masked variance unit pseudo-stratum was sdmvstra, and the masked variance unit pseudo-primary sampling units was sdmvpsu. The confidence interval (CI) was applied for evaluating the reliability of an estimate. WTDRD1 was used as the dietary data weight. Continuous data were described as mean and standard error (S.E.), and the weighted t-test was used for comparison between groups. Enumeration data were described as the number and percentages of cases [n (%)], and χ^2^ test was used for comparison between groups. Univariate weighted Cox regression model was established to identify potential covariates associated the mortality of OA patients. Univariate and multivariable weighted Cox regression models were applied to analyze the relationship between UFAs intake and the risk of mortality in patients with OA. Missing values were manipulated via multiple imputation (Supplementary Table 1), and the results were compared between data with and without missing values imputation (Supplementary Table 2). Subgroup analysis was used in age, gender, CVD, hypertension, and diabetes. Hazard ratio (HR), and 95% confidence interval (CI) were calculated. Alpha was set as 0.05. Data analysis was generated using SAS 9.4.
Results
Comparisons of characteristics of participants survived or died
In total, the data of 3,642 participants were extracted from NHANES. Among them, participants without survival information were excluded (n = 9). Also, those without data on UFAs were not analyzed (n = 362). Finally, 3,271 subjects were involved in our study. There were 2,670 participants survived and 601 died. The screen process of the participants was depicted in Figure 1.
The screen process of the participants.
The mean MUFAs levels (27.88 g vs. 23.64 g, p < 0.001), hexadecenoic acid level (1.04 g vs. 0.91 g, p < 0.001), eicosenoic acid level (0.30 g vs. 0.22 g, p < 0.001), docosenoic acid level (0.04 g vs. 0.02 g, p = 0.005) in the survival group were higher than the death group, the mean omega-3 fatty acid level in the survival group was higher than the death group (1.88 g vs. 1.53 g, p < 0.001). Higher omega-6 fatty acid levels were observed in the survival group compared to the death group (16.29 g vs. 13.35 g, p < 0.001) (Table 1).
Associations between UFAs with all-cause mortality in OA patients
As exhibited in Table 2, age, gender, education, PIR, marital status, smoking status, physical activity, duration of arthritis, osteoporosis, hypertension, diabetes, CVD, CKD, cancer, energy, WBC, uric acid, and non-steroidal anti-inflammatory agents were covariates associated with all-cause mortality in OA patients.
The results delineated that total MUFAs ≥31.30 (HR = 0.56, 95% CI: 0.41–0.76), hexadecenoic acid ≥1.14 (HR = 0.69, 95% CI: 0.52–0.93) might be associated with decreased risk of all-cause mortality in OA patients. Octadecenoic acid ≥29.14, eicosenoic acid of 0.15–0.30 (HR = 0.70, 95% CI: 0.55–0.89) or eicosenoic acid ≥0.30 might be correlated with reduced risk of all-cause mortality in OA patients. Docosenoic acid ≥0.013 (HR = 0.76, 95% CI: 0.58–0.99), PUFAs ≥20.33 (HR = 0.67, 95% CI: 0.53–0.84), omega-3 fatty acid ≥1.98 (HR = 0.61, 95% CI: 0.47–0.79), ALA ≥1.83 (HR = 0.66, 95% CI: 0.51–0.86), omega-6 fatty acid ≥18.04 (HR = 0.64, 95% CI: 0.50–0.81), or linoleic acid ≥17.89 (HR = 0.63, 95% CI: 0.49–0.80) might be related to lowered risk of all-cause mortality in OA patients (Table 3).
After adjusting for confounding factors, MUFAs ≥31.30 was associated with reduced risk of all-cause mortality in OA patients (HR = 0.48, 95% CI: 0.32–0.73). Lowered risk of all-cause mortality in OA patients was observed in patients with octadecenoic acid ≥29.14 (HR = 0.50, 95% CI: 0.34–0.72). Eicosenoic acid of 0.15–0.30 (HR = 0.70, 95% CI: 0.55–0.90) or eicosenoic acid ≥0.30 (HR = 0.62, 95% CI: 0.46–0.84) was related to decreased risk of all-cause mortality in OA patients. PUFAs ≥20.33 was associated with reduced risk of all-cause mortality in OA patients (HR = 0.72, 95% CI: 0.54–0.96). Omega-3 fatty acid ≥1.98 was correlated with decreased risk of all-cause mortality in OA patients (HR = 0.60, 95% CI: 0.45–0.81). Decreased risk of all-cause mortality was found in people with ALA of 1.00–1.83 (HR = 0.75, 95% CI: 0.59–0.96) or ALA ≥1.83 (HR = 0.65, 95% CI: 0.46–0.92) in OA patients. Omega-6 fatty acid ≥18.04 (HR = 0.68, 95% CI: 0.51–0.92) or linoleic acid ≥17.89 (HR = 0.67, 95% CI: 0.50–0.90) were related to decreased risk of all-cause mortality in people with OA (Table 3).
Subgroup analysis of associations between UFAs with all-cause mortality in OA patients
In people aged ≥65 years, MUFAs ≥31.30 (HR = 0.53, 95% CI: 0.33–0.86), hexadecenoic acid ≥1.14 (HR = 0.65, 95% CI: 0.47–0.91), octadecenoic acid ≥29.14 (HR = 0.56, 95% CI: 0.36 = 0.87), eicosenoic acid of 0.15–0.30 (HR = 0.75, 95% CI: 0.59–0.96) or eicosenoic acid ≥0.30 (HR = 0.58, 95% CI: 0.41–0.82) were associated with decreased risk of all-cause mortality in people with OA (Figures 2, 3).
Forest plot showing the associations between MUFAs with all-cause mortality in OA patients in different age groups.
Forest plot showing the associations between PUFAs with all-cause mortality in OA patients in different age groups.
In females, MUFAs ≥31.30 (HR = 0.38, 95% CI: 0.23–0.64), octadecenoic acid ≥29.14 (HR = 0.39, 95% CI: 0.24–0.63), eicosenoic acid ≥0.30 (HR = 0.58, 95% CI: 0.40–0.84), docosenoic acid ≥0.013 (HR = 0.74, 95% CI: 0.56–0.99). PUFAs ≥20.33 (HR = 0.59, 95% CI: 0.39–0.90), omega-3 fatty acid ≥1.98 (HR = 0.50, 95% CI: 0.33–0.76), omega-6 fatty acid ≥18.04 (HR = 0.57, 95% CI: 0.37–0.87), or linoleic acid ≥17.89 (HR = 0.55, 95% CI: 0.36–0.87) (Figures 4, 5).
Forest plot showing the associations between MUFAs with all-cause mortality in OA patients in different gender groups.
Forest plot showing the associations between PUFAs with all-cause mortality in OA patients in different gender groups.
Discussion
The present study investigated the relationship between the levels of MUFAs and PUFAs intake and the risk of all-cause mortality in OA patients. The results depicted that total MUFAs ≥31.30, octadecenoic acid ≥29.14, and eicosenoic acid ≥0.15 as well as PUFAs ≥20.33, omega-3 fatty acid ≥1.98, ALA ≥1, omega-6 fatty acid ≥18.04 and linoleic acid ≥17.89 were related to decreased risk of all-cause mortality in OA patients. The finding showed directions for further studies to analyze the biologic and prognostic properties of MUFAs and PUFAs in OA patients.
In a previous study, a significant positive correlation of the consumption of saturated fatty acids, MUFAs, and PUFAs with bone mineral density was confirmed (18). MUFAs and PUFAs were reported to reduce radiographic progression of knee OA (12). Matsumoto et al. (19) revealed that MUFA, as a component of the Mediterranean diet score, was significantly lower in the rheumatoid arthritis, than in the control group and the ratio of consumed MUFA/SFA significantly differed within the rheumatoid arthritis group, which might suppress the disease activity in rheumatoid arthritis patients. Paunescu et al. (20) identified that MUFAs levels were positively associated with the stiffness index, and the status of MUFAs was associated with the strength of bone. Another cohort study identified that the HRs for total mortality when comparing the extreme quintiles of specific dietary fats were 0.81 (95% CI, 0.78–0.84) for PUFAs and 0.89 (95% CI, 0.84–0.94) for MUFAs. Replacing 5% of energy from saturated fats with an equivalent amount of energy from PUFAs and MUFAs was associated with estimated reductions in total mortality by 27% (HR, 0.73; 95% CI, 0.70–0.77) and 13% (HR, 0.87; 95% CI, 0.82–0.93), respectively (21). These findings might provide some support to the results in the current study. We found that total MUFAs ≥31.30, octadecenoic acid ≥29.14 and eicosenoic acid ≥0.15 were correlated with decreased risk of all-cause mortality of patients with OA, which suggested that that high MUFAs, octadecenoic acid, and and eicosenoic acid might help lower the mortality risk of OA patients.
Also, the relationship of PUFAs and bone health was illustrated in several studies. The potential therapeutic use of omega-3 fatty acids was postulated for individuals with OA, owing to their recognized anti-inflammatory properties, which could be beneficial in the context of OA by effectively moderating pro-inflammatory markers and mitigating cartilage loss (11). There was evidence indicated that the resolvin D1 (RvD1), a derivatives of omega-3 fatty acids, might participate in the pathogenesis of OA (22). The anti-inflammatory properties of omega-3 fatty acids are well recognized, which could be advantageous in the context of OA for modulating pro-inflammatory markers and mitigating cartilage loss (23, 24). A meta-analysis of randomized controlled trials revealed that the supplementation of omega-3 fatty acids has been proven effective in alleviating pain and enhancing joint function among patients with OA (25). The omega-3 fatty acids were reported to participate in certain mechanistic pathways involved in inflammation (26). The potential mechanisms underlying the beneficial effects of omega-3 fatty acids on OA are multifactorial. As previously reported, joint-specific inflammation plays a crucial role in the pathogenesis of OA (7), indicating that nutritional interventions incorporating anti-inflammatory nutrients may be beneficial. Omega-3 fatty acids are well-established for their potent anti-inflammatory properties (27). The alteration of cell membrane fatty acid composition, induced by the consumption of foods or supplements rich in omega-3 fatty acids, appears to play a crucial role in the anti-inflammatory effects attributed to omega-3 fatty acids (26). The omega-3 fatty acids were reported to participate in certain mechanistic pathways involved in inflammation (25). The alteration of cell membrane fatty acid composition, induced by the consumption of foods or supplements rich in omega-3 fatty acids, appears to play a crucial role in the anti-inflammatory effects attributed to omega-3 fatty acids (26). Omega-3 fatty acids exert anti-inflammatory effects by inhibiting inflammatory markers such as interleukin-1 beta (IL-1β) and inducible nitric oxide synthase (iNOS). Additionally, they suppress the expression of metalloproteinase 13, inhibit chondrocyte apoptosis, and restrain bone remodeling and angiogenesis within the osteochondral unit (28). The supplementation form of ALA significantly increased the content of bone-specific alkaline phosphatase, which was associated with bone health (29). A Mendelian randomization study indicated that there was causal relationship between PUFAs and OA susceptibility, and offered a novel insight that high omega-6 fatty acids might reduce the risk of knee OA and hip OA (30). These results were allied with the findings in our study, which delineated that PUFAs ≥20.33, omega-3 fatty acid ≥1.98, ALA ≥1, omega-6 fatty acid ≥18.04 and inoleic acid ≥17.89 were correlated with decreased risk of all-cause mortality in OA patients. High PUFAs including omega-3 fatty acid ALA omega-6 fatty acid and inoleic acid were potentially associated with the prognosis of OA patients. The causal associations still require validation in future studies.
Our study has a few notable advantages. This is the first study to examine the association between the intake of UFAs and the risk of all-cause mortality in patients with OA. The samples of this study was obtained from the NHANES database through multi-stage complex sampling, which represented the local population. The sample size was large and the follow-up time was long to ensure a sufficient number of outcome events. These results underscore the importance of maintaining the levels of UFAs in OA patients. Dietary recommendations advocating the role of UFAs and dietary guidelines should carefully consider the health effects of recommendations for UFAs in OA patients. The first limitation of this study was that this was a retrospective cohort study, and recall bias might exist. Second, due to the limitation of the NHANES database, to distinguish patients with OA at different sites was not possible. The association between UFAs intake and the risk of death in patients with OA at different sites needs to be further studied.
Conclusion
The associations of MUFAs and PUFAs intake with the risk of all-cause mortality in OA patients were investigated in the present study. The results depicted that total MUFAs and PUFAs, octadecenoic acid, eicosenoic acid, omega-3 fatty acid, ALA, omega-6 fatty acid and linoleic acid were correlated with decreased risk of all-cause mortality in OA patients. The finding might suggest the importance of specific UFAs supplement in OA patients.
The reference list from the paper itself. Each links out to its DOI / PubMed record.
- 1Salman LA Ahmed G Dakin SG Kendrick B Price A. Osteoarthritis: a narrative review of molecular approaches to disease management. Arthritis Res Ther. (2023) 25:27. doi: 10.1186/s 13075-023-03006-w, PMID: 36800974 PMC 9938549 · doi ↗ · pubmed ↗
- 2Jin Z Wang D Zhang H Liang J Feng X Zhao J. Incidence trend of five common musculoskeletal disorders from 1990 to 2017 at the global, regional and national level: results from the Global Burden of Disease Study 2017. Ann Rheum Dis. (2020) 79:1014–22. doi: 10.1136/annrheumdis-2020-217050, PMID: 32414807 · doi ↗ · pubmed ↗
- 3Constantino de Campos G Mundi R Whittington C Toutounji MJ Ngai W Sheehan B. Osteoarthritis, mobility-related comorbidities and mortality: an overview of meta-analyses. Ther Adv Musculoskelet Dis. (2020) 12:1759720 x 20981219. doi: 10.1177/1759720 x 20981219, PMID: 33488786 PMC 7768583 · doi ↗ · pubmed ↗
- 4Nüesch E Dieppe P Reichenbach S Williams S Iff SJüni P. All cause and disease specific mortality in patients with knee or hip osteoarthritis: population based cohort study. BMJ. (2011) 342:d 1165. doi: 10.1136/bmj.d 1165, PMID: 21385807 PMC 3050438 · doi ↗ · pubmed ↗
- 5Liu R Kwok WY Vliet Vlieland TP Kroon HM Meulenbelt I Houwing-Duistermaat JJ. Mortality in osteoarthritis patients. Scand J Rheumatol. (2015) 44:70–3. doi: 10.3109/03009742.2014.922213, PMID: 25179456 · doi ↗ · pubmed ↗
- 6Healey EL Afolabi EK Lewis M Edwards JJ Jordan KP Finney A. Uptake of the NICE osteoarthritis guidelines in primary care: a survey of older adults with joint pain. BMC Musculoskelet Disord. (2018) 19:295. doi: 10.1186/s 12891-018-2196-2, PMID: 30115048 PMC 6097435 · doi ↗ · pubmed ↗
- 7Stannus O Jones G Cicuttini F Parameswaran V Quinn S Burgess J. Circulating levels of IL-6 and TNF-α are associated with knee radiographic osteoarthritis and knee cartilage loss in older adults. Osteoarthr Cartil. (2010) 18:1441–7. doi: 10.1016/j.joca.2010.08.016, PMID: 20816981 · doi ↗ · pubmed ↗
- 8Marchev AS Dimitrova PA Burns AJ Kostov RV Dinkova-Kostova AT Georgiev MI. Oxidative stress and chronic inflammation in osteoarthritis: can Nrf 2 counteract these partners in crime? Ann N Y Acad Sci. (2017) 1401:114–35. doi: 10.1111/nyas.13407, PMID: 28662306 · doi ↗ · pubmed ↗