Association between maternal distress during pregnancy and lower 5-min-Apgar score of the offspring: the Japan Environment and Children’s Study
Gita Nirmala Sari, Satoyo Ikehara, Kanami Tanigawa, Yoko Kawanishi, Ehab S. Eshak, Tadashi Kimura, Tomotaka Sobue, Hiroyasu Iso

TL;DR
This study finds that high levels of maternal distress during pregnancy are linked to a higher risk of low Apgar scores in newborns, particularly in preterm and low birth weight babies.
Contribution
The study provides new evidence on the association between maternal distress and low Apgar scores in Japanese women, a population underrepresented in prior research.
Findings
Moderate to severe maternal distress during mid-late pregnancy is associated with a higher risk of low 5-minute Apgar scores in newborns.
The association is strongest in preterm births and low birth weight infants.
The adjusted odds ratio for severe distress is 1.42 compared to low distress.
Abstract
Although the influence of maternal distress during pregnancy on newborn Apgar scores has been studied in various populations, there is limited research specifically addressing this issue among Asian women. This study of Japanese women aims to investigate the association between maternal distress during pregnancy and the risk of a low 5-min-Apgar score among newborns. We analyzed data from 87,765 mother-newborn pairs in the Japan Environment and Children’s Study. Using multivariable logistic regression, we estimated odds ratios (OR) and 95% confidence intervals (CI) for low Apgar scores (<7) at 5 minutes about maternal distress during early and mid-late pregnancy, as measured by the Kessler Psychological Distress Scale (K6). Apgar scores were obtained from newborns’ medical records. A higher risk of low Apgar score in newborns at 5 minutes was found in mothers with moderate to severe…
Genes, proteins, chemicals, diseases, species, mutations and cell lines named across the full text — each resolved to its canonical identifier and authoritative record.
Click any figure to enlarge with its caption.
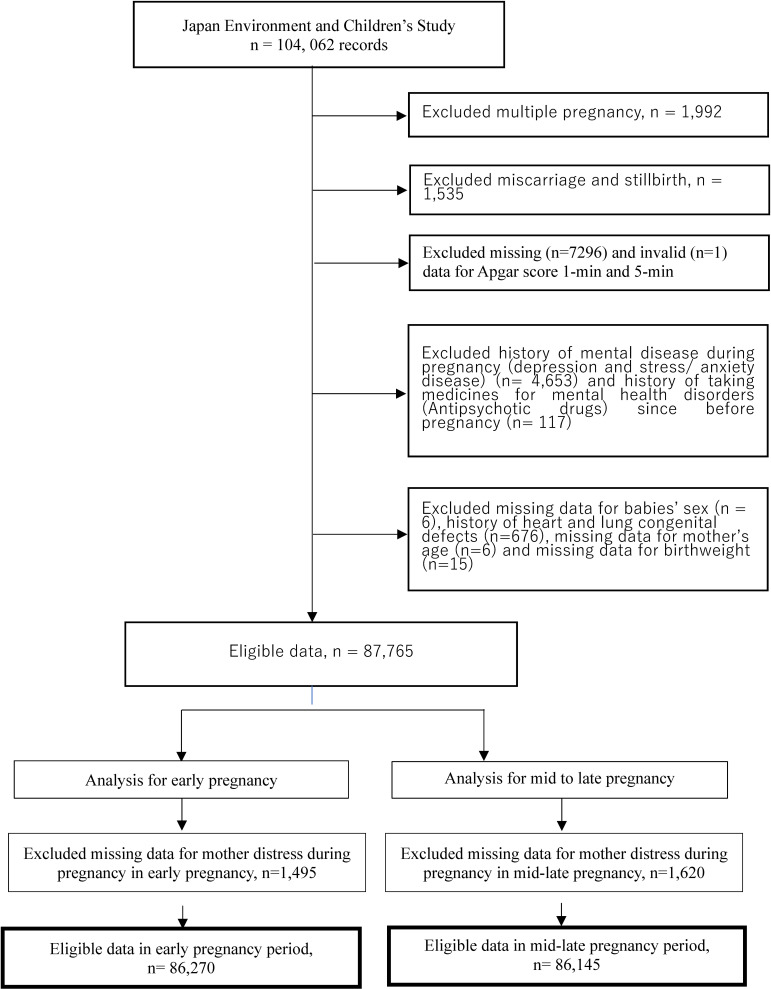 Fig. 1
|
|
|
| ||||
|
|
| |||||
|
|
|
|
|
|
| |
| Number at risk, n (%) | 59,983 (69.5) | 23,757 (27.5) | 2530 (2.9) | 62,401 (72.4) | 21,342 (24.8) | 2,402 (2.8) |
| Mother age at delivery, mean (SD) | 31.5 (5.0) | 30.6 (5.1) | 29.5 (5.3) | 31.5 (4.9) | 30.5 (5.2) | 29.2 (5.6) |
|
| ||||||
| Parity, n (%) | ||||||
| 0 | 22,291 (37.2) | 10,191 (42.9) | 1123 (44.4) | 23,831 (38.2) | 8767 (41.1) | 994 (41.4) |
| ≥1 | 36,397 (60.7) | 12,994 (54.7) | 1349 (53.3) | 37,148 (59.5) | 12,119 (56.8) | 1346 (56.0) |
| Missing | 1295 (2.2) | 572 (2.4) | 58 (2.3) | 1422 (2.3) | 456 (2.1) | 62 (2.6) |
| Gestational age, n (%) | ||||||
| ≤36 weeks (preterm) | 2613 (4.4) | 1074 (4.5) | 117 (4.6) | 2521 (4.0) | 1045 (4.9) | 134 (5.6) |
| ≥37 weeks (term) | 57,370 (95.6) | 22,683 (95.5) | 2413 (95.4) | 59,880 (96.0) | 20,297 (95.1) | 2268 (94.4) |
| Birthweight, n (%) | ||||||
| <2500 g | 4609 (7.7) | 1934 (8.1) | 215 (8.5) | 4621 (7.4) | 1807 (8.5) | 226 (9.4) |
| ≥2500 g | 55,374 (92.3) | 21,823 (91.9) | 2315 (91.5) | 57,780 (92.6) | 19,535 (91.5) | 2176 (90.6) |
| Mode of delivery | ||||||
| Spontaneous delivery | 34,875 (58.1) | 13,609 (57.3) | 1461 (57.8) | 36,245 (58.1) | 12,273 (57.5) | 1384 (57.6) |
| Induction of labor | 10,451 (17.4) | 4297 (18.1) | 443 (17.5) | 11,058 (17.7) | 3779 (17.7) | 385 (16.0) |
| Vacuum/Forceps | 3298 (5.5) | 1498 (6.3) | 149 (5.9) | 3484 (5.6) | 1303 (6.1) | 143 (6.0) |
| Cesarean section | 11,262 (18.8) | 4321 (18.2) | 474 (18.7) | 11,516 (18.5) | 3959 (18.6) | 485 (20.2) |
| Missing | 97 (0.2) | 32 (0.1) | 3 (0.1) | 98 (0.2) | 28 (0.1) | 5 (0.2) |
|
| ||||||
| Pregnancy induced hypertension, n (%) | ||||||
| No | 58,110 (96.9) | 23,031 (96.9) | 2450 (96.8) | 60,496 (97.0) | 20,663 (96.8) | 2314 (96.3) |
| Yes | 1873 (3.1) | 726 (3.1) | 80 (3.2) | 1905 (3.1) | 679 (3.2) | 88 (3.7) |
| Preexisting hypertension, n (%) | ||||||
| No | 59,096 (98.5) | 23,420 (98.6) | 2478 (97.9) | 61,517 (98.6) | 21,007 (98.4) | 2348 (97.8) |
| Yes | 887 (1.5) | 337 (1.4) | 52 (2.1) | 884 (1.4) | 335 (1.6) | 54 (2.2) |
| Preexisting diabetes mellitus, n (%) | ||||||
| No | 59,305 (98.9) | 23,507 (99.0) | 2501 (98.9) | 61,711 (98.9) | 21,115 (98.9) | 2364 (98.4) |
| Yes | 678 (1.1) | 250 (1.1) | 29 (1.2) | 690 (1.1) | 227 (1.1) | 38 (1.6) |
| Gestational diabetes mellitus, n (%) | ||||||
| No | 58,345 (97.3) | 23,108 (97.3) | 2468 (97.6) | 60,721 (97.3) | 20,750 (97.2) | 2322 (96.7) |
| Yes | 1638 (2.7) | 649 (2.7) | 62 (2.5) | 1680 (2.7) | 592 (2.8) | 80 (3.3) |
| Hypothyroidism, n (%) | ||||||
| No | 59,266 (98.8) | 23,472 (98.8) | 2506 (99.1) | 61,637 (98.8) | 21,111 (98.9) | 2375 (98.9) |
| Yes | 717 (1.2) | 285 (1.2) | 24 (1.0) | 764 (1.2) | 231 (1.1) | 27 (1.1) |
| Anemia medication (iron pill), n (%) | ||||||
| No | 34,408 (57.4) | 13,823 (58.2) | 1478 (58.4) | 35,897 (57.5) | 12,308 (57.7) | 1423 (59.2) |
| Yes | 25,575 (42.6) | 9934 (41.8) | 1052 (41.6) | 26,504 (42.5) | 9034 (42.3) | 979 (40.8) |
| Education, n (%) | ||||||
| ≤high school | 20,503 (34.2) | 9034 (38.0) | 1169 (46.2) | 21,108 (33.8) | 8648 (40.5) | 1224 (51.0) |
| ≥college/university | 38,772 (64.6) | 14,401 (60.6) | 1312 (51.9) | 41,049 (65.8) | 12,601 (59.0) | 1162 (48.4) |
| Missing | 708 (1.2) | 322 (1.4) | 49 (1.9) | 244 (0.4) | 93 (0.4) | 16 (0.7) |
| Smoking during pregnancy, n (%) | ||||||
| Never | 35,736 (59.6) | 12,707 (53.5) | 1168 (46.2) | 37,547 (60.2) | 11,282 (52.9) | 1065 (44.3) |
| Quit before pregnant | 14,094 (23.5) | 5589 (23.5) | 521 (20.6) | 14,761 (23.7) | 5023 (23.5) | 541 (22.5) |
| Quit after pregnant | 7033 (11.7) | 3791 (16.0) | 540 (21.3) | 7378 (11.8) | 3569 (16.7) | 504 (21.0) |
| Current smoking | 2246 (3.7) | 1247 (5.3) | 232 (9.2) | 2273 (3.6) | 1239 (5.8) | 259 (10.8) |
| Missing | 874 (1.5) | 423 (1.8) | 69 (2.7) | 442 (0.7) | 229 (1.1) | 33 (1.4) |
| Congenital malformation, n (%) | ||||||
| No | 59,432 (99.1) | 23,508 (99.0) | 2511 (99.3) | 61,849 (99.1) | 21,112 (98.9) | 2371 (98.7) |
| Yes | 551 (0.9) | 249 (1.1) | 19 (0.8) | 552 (0.9) | 230 (1.1) | 31 (1.3) |
|
|
|
|
|
|
| |||||
|
|
| |||||||||
|
|
|
|
|
|
| |||||
| Number at risk | 59,983 | 23,757 | 2,530 | 62,401 | 21,342 | 2,402 | ||||
| Number of cases (%) | 619 (1.0) | 278 (1.2) | 25 (1.0) | 589 (0.9) | 251 (1.2) | 35 (1.5) | ||||
| Crude OR (95%CI) | 1.00 | 1.14 (0.99–1.31) | 0.96 (0.64–1.43) | 1.06 (0.97–1.15) | 0.23 | 1.00 | 1.25 (1.08–1.45) | 1.55 (1.10–2.19) | 1.18 (1.09–1.28) | <0.001 |
| 1.00 | 1.12 (0.97–1.28) | 1.00 | 1.28 (1.11–1.48) | |||||||
| Multivariable OR (95%CI)* | 1.00 | 1.11 (0.96–1.28) | 0.91 (0.61–1.37) | 1.04 (0.95–1.13) | 0.43 | 1.00 | 1.22 (1.05–1.42) | 1.42 (1.00–2.01) | 1.16 (1.06–1.26) | 0.002 |
| 1.00 | 1.09 (0.95–1.26) | 1.00 | 1.25 (1.08–1.44) | |||||||
|
|
|
|
| |||||
|
|
| |||||||
|
|
|
|
|
|
| |||
|
| ||||||||
|
| ||||||||
| Mean (SD) | 34.5 (2.6) | 34.5 (2.6) | 34.5 (2.7) | 34.7 (2.2) | 34.4 (2.6) | 34.2 (2.8) | ||
| Number at risk | 2,613 | 1,074 | 117 | 2,521 | 1,045 | 134 | ||
| Number of cases (%) | 227 (8.7) | 106 (9.9) | 9 (7.7) | 174 (6.9) | 103 (9.9) | 19 (14.2) | ||
| Crude OR (95% CI) | 1.00 | 1.15 (0.90–1.47) | 0.88 (0.44–1.75) | 0.53 | 1.00 | 1.48 (1.14–1.90) | 2.23 (1.34–3.71) | <0.001 |
| Multivariable OR (95%CI)* | 1.00 | 1.16 (0.90–1.49) | 0.92 (0.44–1.84) | 0.50 | 1.00 | 1.44 (1.11–1.87) | 2.02 (1.19–3.44) | <0.001 |
|
| ||||||||
| Mean (SD) | 39.0 (1.1) | 39.1 (1.1) | 39.1 (1.2) | 39.1 (1.1) | 39.0 (1.1) | 39.0 (1.2) | ||
| Number at risk | 57,370 | 22,683 | 2,413 | 59,880 | 20,297 | 2,268 | ||
| Number of cases (%) | 392 (0.7) | 172 (0.8) | 16 (0.7) | 415 (0.7) | 148 (0.7) | 16 (0.7) | ||
| Crude OR (95% CI) | 1.00 | 1.11 (0.93–1.33) | 0.97 (0.59–1.60) | 0.43 | 1.00 | 1.05 (0.87–1.27) | 1.02 (0.62–1.68) | 0.67 |
| Multivariable OR (95%CI)* | 1.00 | 1.07 (0.89–1.28) | 0.92 (0.56–1.53) | 0.67 | 1.00 | 1.03 (0.85–1.24) | 0.95 (0.57–1.57) | 0.96 |
| P for interaction | 0.88 | 0.01 | ||||||
|
| ||||||||
|
| ||||||||
| Mean (SD) | 2202 (368) | 2202 (364) | 2229 (345) | 2229 (325) | 2191 (377) | 2164 (382) | ||
| Number at risk | 4609 | 1934 | 215 | 4621 | 1807 | 226 | ||
| Number of cases (%) | 242 (5.3) | 111 (5.7) | 8 (3.7) | 191 (4.1) | 106 (5.9) | 19 (8.4) | ||
| Crude OR (95% CI) | 1.00 | 1.10 (0.87–1.39) | 0.70 (0.34–1.43) | 0.99 | 1.00 | 1.45 (1.13–1.85) | 2.13 (1.30–3.48) | <0.001 |
| Multivariable OR (95%CI)* | 1.00 | 1.10 (0.86–1.40) | 0.64 (0.31–1.34) | 0.89 | 1.00 | 1.41 (1.10–1.81) | 1.86 (1.11–3.12) | 0.001 |
|
| ||||||||
| Mean (SD) | 3100 (334) | 3092 (332) | 3088 (328) | 3100 (334) | 3092 (331) | 3085 (334) | ||
| Number at risk | 55,374 | 21,823 | 2315 | 57,780 | 19,535 | 2176 | ||
| Number of cases (%) | 377 (0.7) | 167 (0.8) | 17 (0.7) | 398 (0.7) | 145 (0.7) | 16 (0.7) | ||
| Crude OR (95% CI) | 1.00 | 1.13 (0.94–1.35) | 1.08 (0.66–1.76) | 0.26 | 1.00 | 1.08 (0.89–1.31) | 1.07 (0.65–1.76) | 0.47 |
| Multivariable OR (95%CI)* | 1.00 | 1.10 (0.91–1.32) | 1.04 (0.64–1.71) | 0.41 | 1.00 | 1.06 (0.87–1.28) | 1.01 (0.61–1.68) | 0.66 |
| P for interaction | 0.47 | 0.02 | ||||||
Peer Reviews
No public reviews on file for this paper yet. If you reviewed it on a platform where reviews are public (OpenReview, ICLR, NeurIPS, ICML), you can paste yours below so the community can read it here.
Videos
No videos yet. Explain this paper in a talk, walkthrough, or lecture? Add one.
Taxonomy
TopicsMaternal Mental Health During Pregnancy and Postpartum · Birth, Development, and Health · Child Nutrition and Feeding Issues
Background
Pregnant women often experience psychological distress during pregnancy [1]. Prenatal distress has a direct effect on infant health and adverse outcomes through stimulating the hypothalamic-pituitary-adrenal (HPA) axis and an indirect effect through maternal illness accompanied by poor nutrition, reduced physical activity, and disordered sleep [2].
One of the major clinical outcomes for infant health is the newborn’s condition assessed by the Apgar score [3], determining the need for resuscitation and assessing the risk of neurologic disability and mortality [4]. A large multiethnic cohort study of 8,050 pregnant women in the Netherlands reported that depressive symptoms, as assessed with a score of ≥16 with the Center for Epidemiologic Studies Depression (CES-D) scale, at the second trimester of gestation was associated with an increased risk of low 5-min Apgar score (<7) with the multivariable OR of 1.74 (95% CI: 1.13–2.69) [5]. That association did not differ among Dutch, Creole, Turkish, and Moroccan. No such research has been conducted in Eastern countries, including Japan, but the research would be important because maternal distress and depressive symptoms could be influenced by social and ethical backgrounds. Therefore, this study aims to investigate the association between the mothers’ distress during pregnancy and the risk of a low 5-min Apgar score of newborns.
Methods
Study population and setting
The present study used the data from the Japan Environment and Children’s Study (JECS), recruiting pregnant women between January 2011 and March 2014. The research concept and protocol of JECS were reported comprehensively elsewhere [6, 7]. Briefly, JECS is funded by Japan’s Ministry of the Environment and involves the collaboration between the Programme Office (National Institute for Environmental Studies), the Medical Support Centre (National Centre for Child Health and Development), and 15 Regional Centers located across Japan.
The research data was based on the jecs-ta-20190930 data set, released in October 2019, revised in February 2020, and included 104,062 records. The information on pregnant women in the first to third trimesters was collected during antenatal check-ups using a questionnaire and included the medical records of the examination. Physicians, midwives/nurses, and/or research coordinators performed data transcription of the medical record.
Of the 104,062 records, we excluded 1,992 records of mothers with multiple pregnancies, 1,535 records of mothers whose pregnancies ended with miscarriage or stillbirth, and 7,297 records with missing and invalid newborn Apgar score data. We further excluded 4,653 records of mothers who reported a history of mental illness during pregnancy (depression and stress/anxiety illness), 117 mothers with history of taking medicine for mental health disorder (anti-psychotic drug) since before pregnancy, six records for missing data on the sex of the newborn, 676 records of newborn with a history of heart and lung congenital defect [8], six records of missing data for mother’s age, and 15 records for missing data on birth weight.
The total sample size in this study consisted of 87,765 pairs of mothers and newborns. Furthermore, we excluded 1,495 and 1,620 records because of missing data on mothers’ distress in the early and mid-late pregnancy periods, respectively. Finally, we used 86,270 mothers and newborns in the early pregnancy period and 86,145 mothers and newborns in the mid-late pregnancy period as the final samples for data analyses (Fig. 1).
Flow chart for the calculation of respondents
Assessment of distress during pregnancy
We used the Kessler Psychological Distress Scale (K6) to assess distress during the first trimester (early pregnancy, 0–12 weeks) and between the second and third trimesters (mid-late pregnancy, 12–27 and 28–40 weeks). K6 is a psychological measurement tool used to measure distress in adults, and a Japanese version has also been adapted [9]. In this study, we categorized pregnant women into the following three groups according to the K6 score: low (<5), moderate (5–12), and severe distress (≥13).
Assessment of outcome
The outcome in this study was the Apgar score at 5 minutes of the newborn’s life. The Apgar score is a scoring system used to assess the condition of newborns at 1 and 5 minutes after birth, which is carried out by health workers easily and quickly without the need for special equipment (includes heart rate, respiratory effort, reflex irritability, muscle tone, and color) [10] Apgar score is still used to assess the newborns’ physical condition immediately after birth to predict survival of neonates [11]. The total Apgar score (Apgar score = 10) is obtained from the sum of the scores of all the components of the Apgar score assessment; a score of ≥7 indicates that the baby is in good condition [11]. We retrieved the Apgar score data from the medical records of the newborns’ physical examination (diagnosed by a doctor). We dichotomized the 5-min Apgar score into a low (<7) and a standard Apgar score (≥7).
Statistical analysis
The characteristics of pregnant women and newborns were summarized using descriptive statistics. Continuous variables are presented as mean values with standard deviations, while categorical variables are expressed as proportions across the three categories of maternal distress.
To assess the association between maternal distress and the risk of a low 5-min Apgar score (<7), we performed logistic regression analyses. Odds ratios (ORs) and 95% confidence intervals (CIs) were calculated to estimate the strength of the association. Separate models were constructed for maternal distress during early pregnancy (first trimester) and mid-late pregnancy (second and third trimesters). Adjustments were made for potential confounders, including mothers’ age, education (≤high school or college/university) and smoking during pregnancy (never, quit before pregnancy, quit after being pregnant, or currently smoking), parity (0 or ≥1), mode of delivery (spontaneous delivery, induction of labor, vacuum/forceps, or cesarean section), preexisting hypertension (yes or no), pregnancy-induced hypertension (yes or no), preexisting diabetes mellitus (yes or no), gestational diabetes mellitus (yes or no), hypothyroidism (yes or no), anemia medication/iron pill (yes or no) and congenital malformation (yes or no). For sensitivity analysis, we combined moderate and severe distress (K6 ≥ 5) into a single category and recalculated the ORs in comparison to the low distress group (K6 < 5). We also estimated ORs for every five-point increment in the K6 score to evaluate a dose-response relationship.
Stratified analyses were performed by gestational age at birth (<37 weeks or ≥37 weeks) and birth weight (<2500 g or ≥2500 g). Cross-product terms between maternal distress and these stratification variables were included in the logistic regression models to test for statistical interactions.
All missing observations for covariates were treated as dummy variables to maintain the sample size. The statistical analysis was conducted using SAS statistical software version 9.4 (SAS Institute Inc., Cary, NC, USA). The statistical significance was set at a two-tailed p-value of <0.05.
Ethical statement
The JECS protocol was reviewed and approved by the Ministry of the Environment’s Institutional Review Board on Epidemiological Studies and the Ethics Committees of all participating institutions. Written informed consent was obtained from all participants.
Results
Participant’s characteristics
The characteristics of pregnant women and newborns with respect to maternal distress during the pregnancy period are presented in Table 1. Of the 86,270 participants in early pregnancy and 86,145 participants in mid-late pregnancy, the incidence of low 5-min Apgar scores was 1.1% (922 newborns) and 1.0% (875 newborns) of the total participants, respectively.
The mothers who experienced severe distress (K6 ≥ 13) in the early and mid-late pregnancy period were younger, with a higher prevalence of preterm birth and low birth weight of newborns. In addition, they were currently smoking and had lower educational levels.
Distress during pregnancy and risk of the newborn’s low Apgar score at 5 minutes of life
Table 2 presents the association between maternal distress at different stages of pregnancy and the risk of a low 5-min Apgar score. Maternal distress during mid-late pregnancy was associated with an increased risk of low Apgar score but was not during early pregnancy. Compared to low distress (K6 < 5) during mid-late pregnancy, the multivariable ORs (95%CI) of low Apgar score were 1.22 (1.05–1.42) for moderate distress (K6 score: 5–12) and 1.42 (1.00–2.01) for severe distress (K6 score ≥13) (p for trend = 0.002). The multivariable OR (95% CI) of low Apgar score with moderate-to-severe distress (K6 ≥ 5) was 1.25 (1.08–1.44) compared to low distress. The multivariable OR (95% CI) of low Apgar score per five-point increment in K6 was 1.16 (1.06–1.26).
Table 3 shows the adjusted OR (95% CI) of low Apgar score at 5 minutes, stratified by gestational age and birth weight according to distress during early and mid-late pregnancy periods. The risk of low Apgar score was confined to preterm birth (≤36 weeks) and low birth weight (<2500 g) with moderate and severe distress in mid-late pregnancy compared to those with low distress. The OR (95% CI) of moderate and severe distress were 1.44 (1.11–1.87) and 2.02 (1.19–3.44), respectively in preterm birth and 1.03 (0.85–1.24) and 0.95 (0.57–1.57), respectively in term birth (p for interaction = 0.01). The corresponding OR (95% CI) was 1.41 (1.10–1.81) and 1.86 (1.11–3.12) for low birth weight and 1.06 (0.87–1.28) and 1.01 (0.61–1.68) for normal birth weight (p for interaction = 0.02).
Discussion
Based on the data of 87,765 pairs of mothers and newborns, we found that pregnant women with moderate and severe distress during mid-late pregnancy had a 22% and 42% higher risk of delivering a baby with a low Apgar score at 5 minutes, respectively than women with low distress. A five-point increment in K6 was associated with a 16% higher risk of low Apgar score. Such associations were not observed in the early pregnancy period. Our result was consistent with the findings from a large multiethnic cohort study in the Netherlands [5]. We extended the evidence that such positive associations were confined to preterm births and low birth weight.
The mechanisms by which maternal distress in mid-late pregnancy can affect neonatal health include a direct effect of the enhancing hypothalamic-pituitary-adrenal (HPA) axis to elevate levels of cortisol and stimulate the production of inflammatory cytokines [2] which can affect fetal development by reducing placental blood flow and oxygen delivery to the fetus [12]. An indirect effect is a maternal illness accompanied by poor nutrition, reduced physical activity, and disordered sleep [2], which could raise the risk of hypertension and diabetes, leading to impaired respiratory and cardiovascular function in the fetus [13, 14]. We adjusted maternal hypertension and diabetes in the multivariable model to examine the association between maternal distress and Apgar score, but residual confounding remained, so the indirect effect is not negated.
The strength of our study was a large prospective study with a high response rate under a national birth cohort. In addition, we used the K6 distress measuring tool with sufficient precision for use by the Japanese population [9]. It is important to acknowledge that this study has some limitations as well. First, distress data during pregnancy were obtained from a self-report questionnaire without being diagnosed by psychiatrists. Second, the biomarkers of distress during pregnancy, such as cortisol or catecholamine levels, were not measured, leaving the need for future studies. Third, some conditions, such as general anesthesia during delivery and hospitalization during pregnancy, may affect the results. Fourth, the JECS study is a nationwide cohort study, but variations in socio-cultural factors across different cultures and regions may affect the broader applicability of our findings. Further research in different cultural and regional contexts is needed. Finally, future longitudinal studies with repeated assessments of maternal psychological states and biomarkers or randomized controlled trials to reduce maternal distress are needed.
Conclusions
In conclusion, pregnant women with moderate to severe distress during mid-late pregnancy but not during early pregnancy were at high risk for giving birth to newborns with low Apgar scores at 5 minutes of life. This association was confined to preterm births and low birth weight.
The reference list from the paper itself. Each links out to its DOI / PubMed record.
- 1Fatoye F, Adeyemi A, Oladimeji B. Emotional distress and its correlates among Nigerian women in late pregnancy. J Obstet Gynaecol (Lahore) [Internet]. 2004 Aug 2;24(5):504–9. doi: 10.1080/01443610410001722518.15369927 · doi ↗ · pubmed ↗
- 2Coussons-Read ME. Effects of prenatal stress on pregnancy and human development: mechanisms and pathways. Obstet Med [Internet]. 2013 Jun 1;6(2):52–7. doi: 10.1177/1753495 x 12473751.27757157 PMC 5052760 · doi ↗ · pubmed ↗
- 3Li F, Wu T, Lei X, Zhang H, Mao M, Zhang J. The Apgar Score and Infant Mortality. Gong Y, editor. P Lo S One [Internet]. 2013 Jul 29;8(7):e 69072. doi: 10.1371/journal.pone.0069072.23922681 PMC 3726736 · doi ↗ · pubmed ↗
- 4Ehrenstein V. Association of Apgar scores with death and neurologic disability. Clin Epidemiol [Internet]. 2009 May;45. doi: 10.2147/CLEP.S 4782.PMC 294316020865086 · doi ↗ · pubmed ↗
- 5Goedhart G, Snijders AC, Hesselink AE, Van Poppel MN, Bonsel GJ, Vrijkotte TGM. Maternal depressive symptoms in relation to perinatal mortality and morbidity: Results from a large multiethnic cohort study. Psychosom Med. 2010;72(8):769–76.20668282 10.1097/PSY.0b 013e 3181 ee 4a 62 · doi ↗ · pubmed ↗
- 6Kawamoto T, Nitta H, Murata K, Toda E, Tsukamoto N, Hasegawa M, . Rationale and study design of the Japan environment and children’s study (JECS). BMC Public Health [Internet]. 2014 Dec 10;14(1):25. doi: 10.1186/1471-2458-14-25.24410977 PMC 3893509 · doi ↗ · pubmed ↗
- 7Michikawa T, Nitta H, Nakayama SF, Yamazaki S, Isobe T, Tamura K, . Baseline Profile of Participants in the Japan Environment and Children’s Study (JECS). J Epidemiol [Internet]. 2018;28(2):99–104. doi: 10.2188/jea.JE 20170018.29093304 PMC 5792233 · doi ↗ · pubmed ↗
- 8Mezawa H, Tomotaki A, Yamamoto-Hanada K, Ishitsuka K, Ayabe T, Konishi M, . Prevalence of Congenital Anomalies in the Japan Environment and Children’s Study. J Epidemiol [Internet]. 2019 Jul 5;29(7):247–56. doi: 10.2188/jea.JE 20180014.30249945 PMC 6556438 · doi ↗ · pubmed ↗