Evaluation of dyssynchrony in children with dilated cardiomyopathy: a comparison of electrical and mechanical delay using Doppler, tissue imaging and strain
Fariba Rashidi Ghader, Mohammad Mahdavi, Hossein Mehrali, Mohammad Dalili, Hossein Shahzadi, Reza Abbaszade

TL;DR
This study examines how heart muscle disease in children causes uneven heart contractions and finds that even those with normal electrical signals can have mechanical delays.
Contribution
The study reveals that mechanical dyssynchrony in children with dilated cardiomyopathy is common even when electrical signals appear normal.
Findings
86.5% of DCM patients showed intra-ventricular dyssynchrony, regardless of QRS width.
Nearly half of patients with normal PR intervals still exhibited AV dyssynchrony.
Mortality and disease severity correlated with the severity of dyssynchrony types.
Abstract
Dilated cardiomyopathy (DCM) is a primary myocardial disease characterized by systolic dysfunction, which can lead to disparity and disorganized contraction, commonly referred to as dyssynchrony. Three types of dyssynchrony include atrioventricular (AVD), interventricular (inter-VD), and intra-LV dyssynchrony (intra-VD). We aimed to investigate the prevalence and interdependence of electrical and mechanical dyssynchrony in order to elucidate the optimizing patients for cardiac resynchronization therapy (CRT). A total of 37 DCM patients (1–17 years, 51% female) were included in this cross-sectional study. Regarding the intra-VD, inter-VD, and AVD, the study showed inter-VD in 37%, 27%, and 48% by Doppler, Doppler tissue imaging (DTI), and color-coded DTI methods, respectively; however, 70% showed right ventricular free wall delay based on the presence of peak of strain after pulmonic…
Genes, proteins, chemicals, diseases, species, mutations and cell lines named across the full text — each resolved to its canonical identifier and authoritative record.
Click any figure to enlarge with its caption.
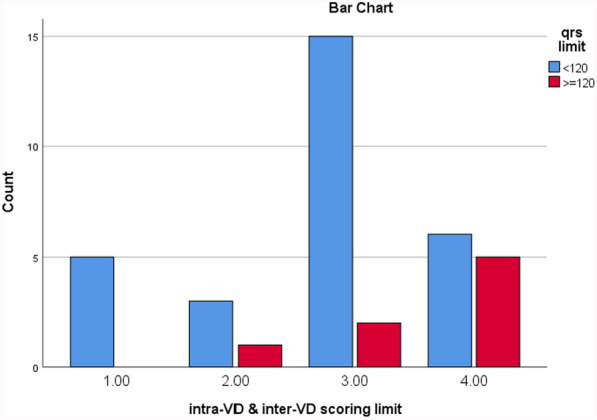 Figure 1
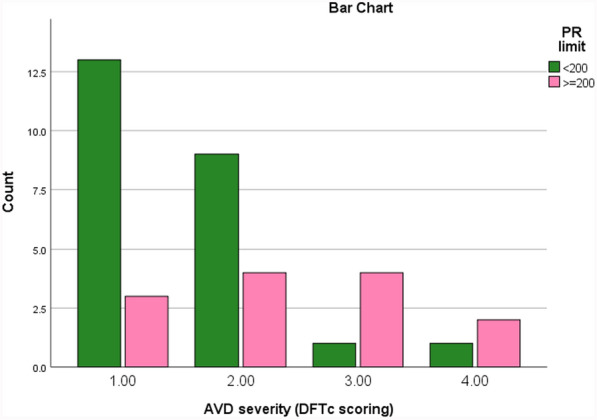 Figure 2
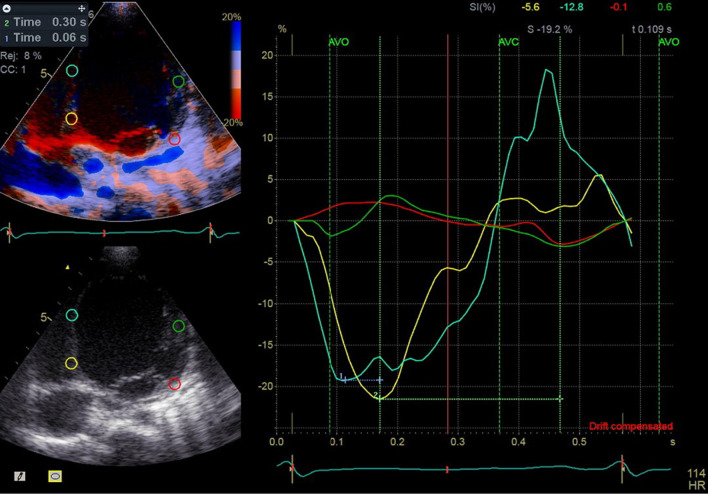 Figure 3
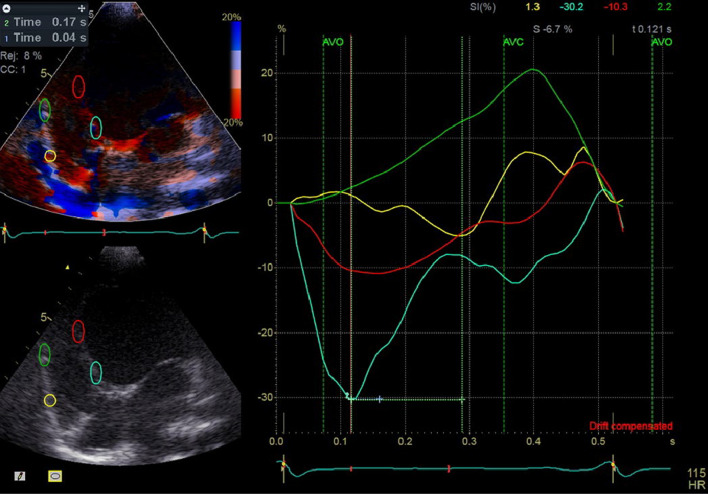 Figure 4
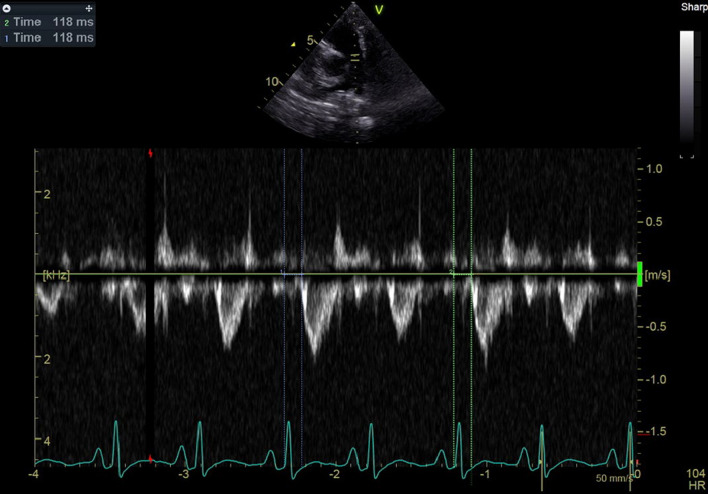 Figure 5
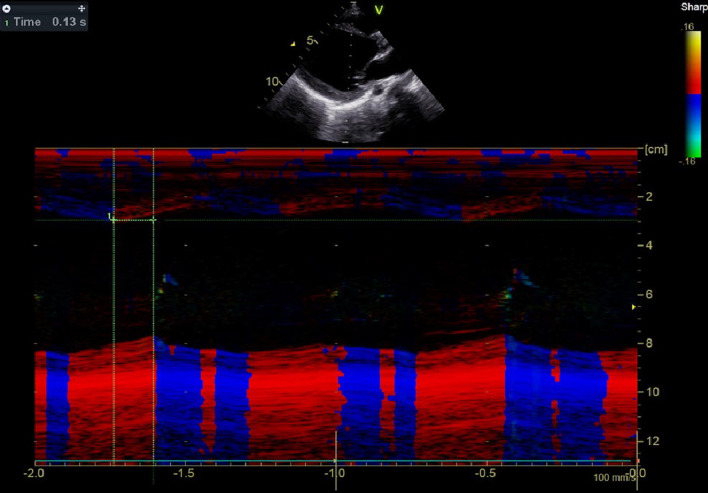 Figure 6
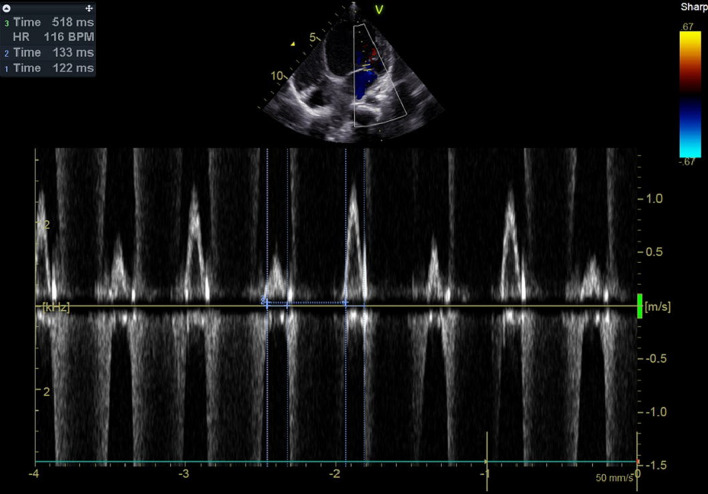 Figure 7
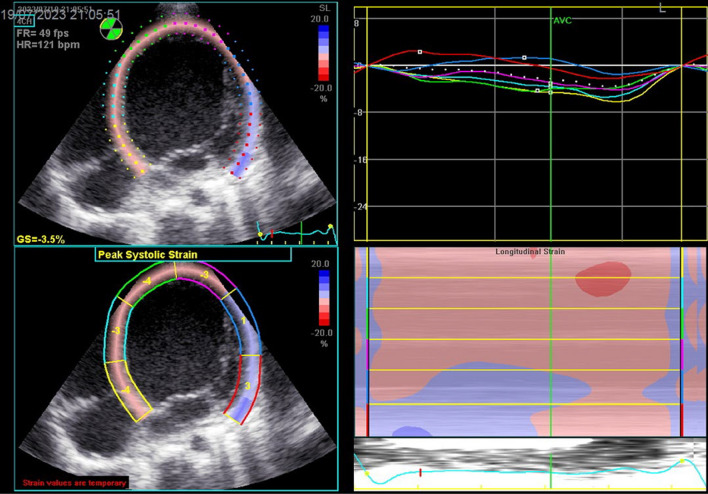 Figure 8
Peer Reviews
No public reviews on file for this paper yet. If you reviewed it on a platform where reviews are public (OpenReview, ICLR, NeurIPS, ICML), you can paste yours below so the community can read it here.
Videos
No videos yet. Explain this paper in a talk, walkthrough, or lecture? Add one.
Taxonomy
TopicsCardiac pacing and defibrillation studies · Cardiac Arrhythmias and Treatments · Cardiomyopathy and Myosin Studies
Background
Dilated cardiomyopathy (DCM) is a primary, progressive and usually irreversible myocardial disorder characterized by left ventricular (LV) or biventricular dilation and global systolic dysfunction in the absence of structural heart disease such as congenital heart disease (CHD), valvular disorders, hypertension, or coronary artery disease [1]. The extent of ventricular dysfunction has traditionally been assessed by M-mode, Doppler, and tissue Doppler imaging (TDI) [2, 3]. More recently, deformation studies have provided additional insights [2, 3]. In a healthy heart, myocardial segments exhibit highly synchronized onset and peak motion across all planes. The activation of LV is disturbed in DCM, leading to a delayed activation of the lateral wall. When the earlier activated interventricular septum contracts and produces very little mechanical work pushing blood simply toward the relaxed lateral wall, then the late-activated LV lateral wall is pre-stretched so it performs a higher workload. This disparity, known as dyssynchrony, results in different expression of multiple proteins, heterogeneous calcium-handling properties, changes in wall thickness, and variations in electrical conduction speeds within the LV [4]. Consequently, dyssynchrony disorganizes cardiac contraction and reduces pumping efficiency. Patients with severe LV systolic dysfunction and prolonged QRS interval have been reported to have higher morbidity and mortality rates than those with normal QRS duration [5].
Dyssynchrony can be categorized into three types: atrioventricular dyssynchrony (AVD), characterized by delayed ventricular contraction; interventricular dyssynchrony (inter-VD), exhibiting discordance between LV and right ventricular (RV) contractions; and intra-LV dyssynchrony (intra-VD), marked by discordant contractions of different LV walls [5]. Cardiac resynchronization therapy (CRT) has been demonstrated to reduce heart failure symptoms and hospitalizations, enhance quality of life, and improve exercise capacity and overall prognosis [5]. CRT eliminates the mechanical dyssynchrony, thereby improving systolic and diastolic dysfunction, as well as functional mitral regurgitation, in patients with DCM [5]. Historically, many studies have employed the presence of electrical dyssynchrony (QRS ≥ 120 ms) as an inclusion criterion [6]. Nonetheless, some patients with wide QRS fail to respond adequately to CRT, potentially due to the absence of mechanical dyssynchrony. Conversely, certain patients without wide QRS exhibit better responses, which can be attributed to the lack of a strong correlation between electrical and mechanical dyssynchrony [7].
There are several reasons to measure mechanical dyssynchrony in addition to electrical dyssynchrony. Firstly, QRS duration alone does not provide detailed information on the activation timing of different LV regions and fails to distinguish between LV and RV activation [4, 6]. Secondly, coordinated myocyte contraction is a complex process essential for moving blood through the aortic and pulmonic valves. This process can encounter delays in electromechanical coupling, which is initiated by electrical activity but only represents an early step [4, 6]. Thirdly, mechanical dyssynchrony may hold more significance in optimizing patient selection for CRT and predicting cardiovascular events in heart failure patients [4, 6].
Objectives
Various methods have been employed to detect mechanical dyssynchrony, including cardiovascular magnetic resonance (CMR), radionuclide scintigraphy, invasive conductance catheter recordings, and echocardiography [7]. Echocardiography is widely recognized as a useful, feasible, and cost-effective tool to identify motional disparities using velocity, displacement, or strain measurements [5, 6, 8]. In this study, our objectives were to evaluate the prevalence of different types of mechanical dyssynchrony in patients with DCM, examine potential relationships between PR interval and AVD, as well as between QRS duration and inter-VD and intra-VD, and provide an overview of the most commonly employed echocardiographic methods to obtain mechanical dyssynchrony in order to elucidate the optimizing patients for CRT.
Methods
Study design
DCM patients with LVEF < 50% of the age limit of 6 month–17 years were enrolled in the study as outpatients and inpatients. This single-center cross-sectional study was conducted throughout 1 year at our institute. The patients with CHD or arrhythmia were excluded. All patients underwent evaluation for electrical and mechanical dyssynchrony using ECG and echocardiography, respectively. Demographic data including age, body surface area (BSA), sex, and some laboratory tests included NT pro-BNP, bilirubin, SGOT, SGPT, creatinine, and hemoglobin were collected for analysis. New York Heart Association functional class (NYHA FC) was determined based on patient and parent reports.
Electrocardiography
Electrocardiography was done at about the same time as echocardiography in relaxing and calming state, by standardized 12 leads at voltage calibrated so that 1 mV = 10 mm and speed of 25 mm/s. Then ECG interpreted as QRS duration and PR interval were measured and adjusted according to bazett’s formula (QRS dur/√RR). Left bundle branch block (LBBB) was identified by the presence of QRS > 120 ms in leads V_1_–V_6_ with notching or slurring, poor R/S progression, notching in leads I and AVL, and/or left axis deviation. Participants were then divided into two groups based on QRS duration (≥ 120 ms and < 120 ms) and PR interval (≥ 200 ms and < 200 ms).
Echocardiography
Echocardiographic examinations were performed using Doppler, TDI, color-coded tissue, color-coded M-mode, and 2D techniques. Ventricular volumes and EF were determined using the Simpson biplane method on two available echocardiography systems: the GE s60 (General Electric, Norway), primarily used for inpatients with NYHA FC ≥ 2 in the heart failure ICU ward, and the Philips iE33 for other patients. An experienced pediatric echocardiographer conducted all examinations. High-quality two-dimensional (2D), color-coded TDI, and pulsed-wave (PW) TDI images were acquired from the apical 2-, 3-, and 4-chamber views. Color-coded TDI was used to sample regions of interest (ROI) in six basal and six mid-segments. The speckle-tracking analysis also was performed on acceptable quality acquisited 2D images to obtain global longitudinal strain (GLS), global circumferential strain (GCS), and time-to-peak strain (Figs. 1 and 2).Fig. 1. Severity of dyssynchrony scoring 1–4 from no VD to severe VD, score 1 = no dyssynchrony: It means that, the longer the QRS interval, the more severe the VD. Refer to list of abbreviations before referencesFig. 2Severity of AV dyssynchrony scoring 1–4 from no AVD through severe AVD (score 1 = no AVD, 2: 0.35 < DFT ≤ 0.40, 3: 0.3 < DFT ≤ 0.35, 4: DFT ≤ 0.3; it means that: The longer the PR interval, the more severe the AVD. Refer to list of abbreviations before references
For the calculation of electromechanical delay and electrosystolic delay, the time interval from the beginning of the QRS wave to the onset of aortic and pulmonary valve opening was utilized. These values were derived from PW TDI, Doppler, and color-coded TDI. Electrosystolic delay was calculated using the time interval from the beginning of the QRS wave to the aortic and pulmonary valve peak systolic velocity. Additionally, the time-to-peak longitudinal strain obtained from speckle-tracking analysis and the septal-to-posterior wall motion delay (SPWMD) on color-coded M-mode was employed to assess dyssynchrony. All the measured parameters except speckle-tracking analysis were calculated as the average of three consecutive beats (Figs. 3, 4, 5, 6, 7 and 8).Fig. 3. Electrosystolic delay of mid (blue and green curves) and basal portion (yellow and red curves) of inferoseptal and anterolateral walls as demonstrated by strain analysis, note the systolic delay of base and mid portion of anterolat wall as peak of strain appears after aortic valve closure (AVC) and early stretching at first third of systole and early peak of strain of base and mid of inferoseptal at first third of systole instead of end of systole (classical pattern), notice the time difference of peak of strains of opposing segments, Time 1 = 0.06 s (difference between basal and mid portion of IS),Time 2 = 0.30 s (difference between basal of IS and AL)Fig. 4. Electrosystolic delay of mid (red and green curves) and basal portion (yellow and blue curves) of inferoseptal and RV free walls as demonstrated by strain analysis, note the paradoxical motion of mid-portion of RV free wall where peak of strain appears at third portion of diastole, normal appearance of peak of strain of basal of RV free wall (yellow curve), early peak of strain of basal and mid of IS at first third of systole instead of end of systole, notice the time difference of peak of strains of opposing segments, Time 1 = 0.04 s (difference between basal and mid portion of IS),Time 2 = 0.17 s (difference between basal of IS and RV free wall)Fig. 5. Electromechanical delay of RV by Doppler analysis = 118 msFig. 6Time difference of septum and posterior wall of LV (SPWMD) = 0.13 sFig. 7Diastolic filling time = 133, 122 ms (avge = 127 ms), RR interval = 518 ms, DFTc = 127/518 = 25%), note prolonged DFTc < 40% in DCMFig. 8Decreased GLS of LV at 4c view = − 3.5%, note the delayed appearance of peak of systolic strain after aortic valve closure (AVC) of most segments
According to QRS duration and PR interval, the patients were divided into two subgroups: for QRS duration group 1 with QRS duration ≥ 120 ms and group 2 with a narrow QRS < 120 ms. And for PR interval further two groups included PR interval ≥ 200 ms and PR interval < 200 ms, and then the groups compared in terms of mechanical dyssynchrony parameters.
For the assessment of AVD, a mean left ventricular filling time (LVFT)-to-cardiac cycle ratio (LVFT/RR × 100) below 40% was considered abnormal. AVD grading was determined by measuring diastolic filling time (DFT) as follows:
- Grade I: No AVD
- Grade II: 0.35 s < DFT ≤ 0.40 s
- Grade III: 0.3 s < DFT ≤ 0.35 s
- Grade IV: DFT ≤ 0.3 s
To evaluate inter-VD: The difference between the two values as an inter-VD > 40 ms was considered for the cutoff value of inter-VD; however, it was adjusted by patients’ heart rate (HR) by the formula of inter-dyssynchrony × 75/HR [9]. Inter-VD was determined based on the difference of opening of PA and AO at Doppler, spectral tissue Doppler imaging (DTI), and peak of RV free wall and septal Sm at color-coded DTI (cc DTI).
We determined the electrosystolic delay (ESD) by PW DTI from the onset of the QRS complex to the positive peak systolic velocity (Sm) for four basal segments (septal, lateral, inferior, and anterior).
Intra-LVD was identified when absolute differences between two opposing segments exceeded 65 ms. Intra-LVD was also determined using strain analysis of the following six basal and six mid-segments: inferoseptal, anterolateral, inferior, anterior, anteroseptal, and inferolateral [7]. Then the time interval from the onset of the QRS complex to the peak of strain was measured. Segments with the peak of strain occurring after aortic and pulmonic valve closure were identified as delayed mechanical segments in LV and RV, respectively. These delayed segments were further classified into three groups based on the degree of dyssynchrony:
- Mild dyssynchrony: Peak strain appears in the first third of diastole or is delayed until the second third after aortic valve closure.
- Moderate dyssynchrony: Peak strain occurs between the first and second third of diastole.
- Severe/paradoxical dyssynchrony: Peak strain appears in the last third of diastole or is paradoxically positive.
A scoring system was used to quantify dyssynchrony at different segments, taking into account the degree of dyssynchrony as follows: the number of segments with mild dyssynchrony + 2 × (the number of segments with mod dyssynchrony) + 4 × (the number of segments with severe dyssynchrony or paradoxical motion).
The total severity score was then recalculated and categorized as absent (no segments with dyssynchrony), near absent (only 1 or 2 segments with peak strain appearance at less than one-third of diastole), presence of dyssynchrony as depicted in Table 6.
Statistical analysis
Data were collected and analyzed with SPSS 26. Continuous and qualitative variables were presented as mean or median ± standard deviation. Comparisons between frequencies in the two groups were performed using crosstab with the Chi-square test. Correlations between electrocardiographic, echocardiographic, and demographic parameters were explored using Pearson’s or spearman’s correlation. To check the correlation of electromechanical variables, P value derived from χ^2^ test and odds ratio (OR) with CI = 0.95 for ordinal variables; additionally, P value derived from Mann–Whitney and effect size for quantitative variables were applied.
Results
A total of 37 patients with the diagnosis of DCM were enrolled in the study. Their characteristics are presented in Table 1, as demonstrated the mean age of DCM patients was 9.4 ± 4.53 with the range of 1–17 year consisted of 18 male and 19 female 27% of whom were expired during the year of study. Echocardiographic and electrocardiographic parameters are demonstrated in Tables 2 and 3, respectively. The fibrosis based on as assessed by late gadolinium enhancement (LGE) and non-compaction LV (NCLV) based on CMR and echocardiographic methods were also reported. 6 out of 37 patients who were younger and with milder intensity DCM had not done cardiac MRI, which their EF and volumetric data were obtained using biplane Simpson’s echo method. Table 1. Patients’ characteristicsMean ± SD, unit; median ± SDUnitNumbers/percent; min/maxMortality10, 27%Transplant6, 16%Age9.4 ± 4.53Year1–17GenderM/F = 0.9518 Male/19 femaleSA1.07 ± 0.41M^2^NT pro-BNP8360 ± 10,107Pg/ml20–35,000Creatinine0.73 ± 0.31Mg/dlSGOT45 ± 41Unit/lSGPT42 ± 111Unit/lBil1.27 ± 1.01Mg/dlHb11.7 ± 1.52g/dlNYHA FC3 ± 0.93 (median)FC 1–4Refer to list of abbreviations before referencesTable 2Patients echocardiographic parametersMean ± SD; median ± SDUnitNumbers/percent; min/maxFAC0.27 ± 0.07–RV Sm8.6 ± 2.35Cm/sMR degree3 ± 0.72TR degree2 ± 0.64LV EDV183.1 ± 61.8MlLV ESV151.6 ± 63.7MlRV EDV121.6 ± 51.3MlRV ESV87.2 ± 45.1MlLVEF20% ± 0.127–50%RVEF29% ± 0.16NCLV0 ± 0.95No: 23(62%)Mild: 8(21%)Mod: 3(8%)Severe: 3(8%)LGE0 ± 0.98No: 16(43%)Mild: 7(19%)Mod: 7(19%)Severe: 2(5%)Clot0 ± 0.77No: 31(83%)Small: 3(8%)Mod: 1(2%)Large: 2(5%)GLS LV− 0.07 ± 0.0480.0 to (− 0.18)GCS LV− 0.10 ± 0.054− 0.02 to (− 0.20)GLS RV−.0099 ± 0.054− 0.02 to (− 0.20)Refer to list of abbreviations before referencesTable 3Patients ECG parametersMean ± SD; median ± SDUnitNumbers/percent; min/maxQRSc duration101.4 ± 28.4MsQRSc ≥ 120 msQRSc ≥ 120 ms = 8 (21.6%)QRSc < 120 msQRSc < 120 ms = 29 (78.4%)PRc interval191.24 ± 40.4MsPRc ≥ 200 msPRc ≥ 200 ms = 13 (35.1%)PRc < 200 msPRc < 200 ms = 24 (64.9%)LBBB1 ± 0.31No = 1,yes = 2YesYes: 4 (10.8%)NoNo: 33 (89.2%)Refer to list of abbreviations before references, QRSc, PRc: corrected by Bazette’s formula
Data on dyssynchrony, including inter-VD, intra-VD, and AVD, are presented in Table 4. Further details on inter-VD and intra-VD obtained using Doppler, TDI, and color-coded TDI methods are shown in Table 5. Information regarding RV free wall delay based on the presence of peak strain after pulmonic valve closure and the classification of severity can be found in Table 6. Table 4. Patients dyssynchrony parametersMean ± SD; median ± SDUnitNumbers/percent; min/maxHorizontal dyssynchronyMs2c(ant-inf difference)124.5 ± 40.420–2003c(AS-IL difference)151.6 ± 50.160–3004c(IS-AL difference)142.3 ± 55.130–300Vertical dyssynchronyMsAnt93 ± 41.135–190Inf81.9 ± 55.310–250AS92.3 ± 4020–170IL99.7 ± 64.610–350IS103.9 ± 56.920–270AL77.7 ± 47.610–200Horizontal LV-RV dyssynchrony105.5 ± 39.1Ms20–180Vertical RV free wall dyssynchrony75 ± 62.6Ms10–270AVD40% ± 10%22–65%SPWMDc102.5 ± 52.4Ms25–220Refer to list of abbreviations before references. To evaluate horizontal dyssynchrony, compare base to base and mid to mid at each standard views of 2c, 3c, and 4c views, then obtaining mean valueTable 5Patients’ inter-VD and intra-VD parameters by Doppler, Doppler DTI, color-coded DTI and M-modeMean ± SD; median ± SDUnitNumbers, percent; min/maxInter-VDNumber/percentEMD LV dop107.3 ± 18.2Ms83–174EMD LV dop DTI94.7 ± 21.1Ms40–167EMD LV CC DTI81 ± 36.7Ms14–177ESD LV dop188.3 ± 35.3Ms116–280ESD LV dop DTI172.6 ± 30.7Ms118–255ESD LV CC DTI180.5 ± 58.6Ms55–355EMD RV dop91.1 ± 20.1Ms60–140EMD RV dop DTI81.7 ± 16.1Ms50–134EMD RV CC DTI58.6 ± 48.6Ms8–240ESD RV dop162 ± 33.3Ms92–250ESD RV dop DTI155.1 ± 39Ms100–270ESD RV CC DTI140.4 ± 73.6Ms26–350AO-PA opening dop diff30.7 ± 10.9Ms15–4814/37 (37%)AO-PA opening dop DTI diff26.1 ± 12.7Ms8–4810/37 (27%)AO-PA opening cc DTI diff35.9 ± 17.2Ms5–6818/37 (48%)AO-PA peak dop diff29.4 ± 27.3Ms− 17 to 8210/37(35%)AO-PA peak dop DTI diff20 ± 2Ms− 52 to 709/37(24%)AO-PA peak cc DTI diff40 ± 39.7Ms− 60 to 11811/37(29%)SLWSDc DTI38 ± 11.2Ms12–509/37(24%)SLWSDc CC54.2 ± 32.3Ms30–10112/37(32%)SPWMD102.5 ± 52.4Ms25–22014/37(37%)Refer to list of abbreviations before referencesEMD: Electromechanical delay: Time difference from the onset of QRS to the AO valve opening in LV and PA opening in RV which have been acquired by Doppler (method 1), DTI (method 2) and color-coded DTI (method 3)ESD: Electrosystolic delay: Time difference from the onset of QRS to the peak of aortic flow wave in LV and PA flow wave in RV which have been obtained by Doppler (method 1) and DTI (method 2) and color-coded DTI (method 3)AO-PA difference has been calculated by subtracting the EMDs and ESDs of LV and RV acquired by all three methodsSLWSDc: Septo lateral wall systolic (corrected by HR) delay by color-codedTable 6Classification of dyssynchrony severityDyssynchronyNumber/percent of subjects intra-VDSLWSD DTIc ≥ 65 msSLWSDcc c ≥ 65 msNumber/percent of subjects free wall of RVTotalAbsent (or near absent): score = 0–25, 13.5%29, 78%25, 67.5%11, 30%LV = 5RV = 11PresentLV = 32RV = 26Mild (2 < score ≤ 10)4, 10.8%1, 2.7%2, 5%26, 70%Mod (10 < score ≤ 20)17, 46%3, 8%4, 10.8%0Severe/pdx (score > 20)11, 29.7%5, 13.5%6, 16%0Refer to list of abbreviations before references
ECG parameters were divided into two groups as QRSc ≥ 120 ms and QRSc < 120 ms, and PRc interval ≥ 200 ms and PR < 200 ms (Table 3). Dyssynchrony data were demonstrated based on horizontal and vertical dyssynchrony, SPWMD, SLWSD, inter-VD, intra-VD, and DFTc (Table 4). Inter-VD and intra-VD data by Doppler, DTI, and color-coded DTI methods are presented in Table 5; however, the values regarding RV free wall delay based on the presence of peak of strain after pulmonic valve closure are denoted in Table 6).Classification of severity is also shown in Table 6. Correlation of severity of intra-VD and QRS duration and cross-tabulation of intra-VD according to QRSc limits is shown in Tables 7 and 8. Accordingly, 100% (8 out of 8) of DCM patients with prolonged QRS (QRSc ≥ 120 ms) and 83% (24/29) of patients with narrow QRS (QRSc < 120 ms) had intra-VD, in which both groups were differentiated based on the severity of dyssynchrony (Tables 7 and 8; Fig. 1). Table 7. Correlation of severity of intra-VD with QRS durationSeverity of intra-VDQRS limitTotalQRSc < 120QRSc ≥ 12015, 17%0523, 10%03315, 51%3, 37%1846, 13%5, 63%1129837Refer to list of abbreviations before referencesSeverity of dyssynchrony scoring 1–4 from no VD to severe VD, score 1 = no dyssynchrony: Score2 = mild, score 3 = mod, score 4: severeTable 8Cross-tabulation of correlation of QRS limit and intra-VDQRS limitTotalQRS ≥ 120 msQRS < 120 msIntravent dyssynchronyNearly absent05, 17%5, 17%Present8, 100%24, 83%32, 87%8, 22%29, 78%37Refer to list of abbreviations before references
Correlation of severity of AVD and PRc interval and cross-tabulation of AVD and PRc interval are indicated in Tables 9 and 10. Based on our results, there were 16 out of 37 patients without AVD. Differentiation of their severity was also denoted for both group of PRc < 200 ms and PR ≥ 200 ms (Tables 9 and 10; Fig. 2). Data of vertical dyssynchrony for different segments between base and mid-portion are determined, which are notified in Table 4. Table 9. Correlation of severity of AV dyssynchrony with PR intervalSeverity of AVDPRc limitTotalPRc < 200PRc ≥ 200113, 54%3, 23%1629, 36%4, 30%1331, 4%4, 30%541, 4%2, 8%3241337Refer to list of abbreviations before referencesSeverity of AV dyssynchrony scoring 1–4 from no AVD through severe AVD (score 1 = no AVD, 2: 0.35 s < DFT ≤ 0.40 s, 3: 0.3 s < DFT ≤ 0.35 s, 4: DFT ≤ 0.3 sTable 10Cross-tabulation of correlation of PR limit and AVDPR limittotalPRc ≥ 200 msPRc < 200 msAVDAbsent3, 23%13, 54%16, 43%Present10, 77%11, 46%21, 57%13, 35%24, 65%37Refer to list of abbreviations before references
The similarity between tissue Doppler and color-coded DTI with strain analysis showed that SLWSD of 24% by DTI and 32% by color-coded DTI of which 88% and 83%, respectively, was among grades 3–4 intra-VD by strain scoring (Tables 5 and 6).
LVEF was lower and LV GLS, mortality, Pro-BNP, NYHA FC, and severity of intra-VD were higher in the group with QRS ≥ 120 ms and PR ≥ 200 ms. The effect size was in favor of valuable effect of prolonged QRS on worsening LV and RV GLS, LV and RV dyssynchrony score, LVEF, and pro-BNP. Likewise, it indicated the valuable effect of prolonged PR on deteriorating LVEF, LV GLS, LV dyssynchrony score, and pro-BNP. Also OR, effect size, and P value showed that prolonged QRS and PR could be accounted as some risk factors for mortality and clinical manifestation (Table 11). Table 11. Some characteristics of patients with two different QRS and PR limits groupsGroupLVEF%RVEF%LV GLSRV GLSLV Dys scoreRV Dys scoreMortalityPro-BNPNYHA median ± SDMean ± SDMean ± SDMean ± SDMean ± SDMean ± SDMean ± SDMean ± SDMean ± SDQRS ≥ 120 (no = 8)15% ± 9%30% ± 20%− 4% ± 3%− 8% ± 4%18.6 ± 4.51.5 ± 0.5 (1–2)50%13,947 ± 14,8233 ± 0.7Range = 2–4QRS < 120(no = 29)21% ± 13%28% ± 15%− 7% ± 5%− 10% ± 5%13.8 ± 8.11.5 ± 2 (0–8)20.7%6818.5 ± 80642 ± 0.9Range = 1–4P value/ES/ORP = 0.135ES = 0.54P = 0.912ES = 0.06P = 0.160ES = 0.61P = 0.149ES = 0.52P = 0.215ES = 0.58P = 0.119ES = 0.67P = 0.161ES = 0.64P = 0.098OR = 3.83CI = 0.95(0.73–19.99)P = 0.095ES = 1.01PR ≥ 200(no = 13)14% ± 6%27% ± 13%− 4% ± 3%− 8% ± 3%18.8 ± 5.21.07 ± 0.861.5%14,109 ± 12,0823 ± 0.76Range = 2–4PR < 200(no = 24)22% ± 14%30% ± 18%− 8% ± 5%− 10% ± 6%12.7 ± 81.75 ± 2.18.3%5245 ± 74112 ± 0.9Range = 1–4P value/ES/ORP = 0.088ES = 0.80P = 0.86ES = 0.19P = 0.044ES = 0.87P* = 0.175ES = 0.10P = 0.014ES = 0.98P* = 0.570ES = 0.02P = 0.026ES = 0.91P* = 0.001OR = 17.6 CI = 0.95 (2.82–109.56P* = 0.077ES = 1Refer to list of abbreviations before referencesES, effect size; OR, odds ratio, *shows significant P value (NS at P > 0.05)
The evaluation of severity of dyssynchrony of different segments indicated that inferolateral, anterolateral, anterior, anteroseptal walls were among the most severe delayed segments sequentially (Table 12). Table 12. Severity of dyssynchrony at different segmentsSegmentsMildModSevere/paradoxTotal scoreInferolateral6838174Anteroseptal1171169Inferoseptal254865Anterolateral162612116Anterior9131075Inferior79129RV free wall260026Refer to list of abbreviations before references
Most dyssynchrony parameters were correlated appropriately with ventricular function and ECG parameters. Gender was not correlated with any parameters. Although fibrosis correlation with mortality, GLS, and LVEF was not significant, it was significantly positive with age, LBBB, and QRS interval (Tables 13 and 14). Table 13. Some correlation of dyssynchrony with echo and electrocardiographic parametersLVEFRVEFLV GLSRV GLSLVEDVLVESVRVEDVRVESVQRScPRcIntra-VD (strain)R = − 0.80R = − 0.55R = 0.74R = 0.64R = 0.58R = 0.66R = 0.39R = 0.51R = 0.38R = 0.61P = 0.000P = 0.000P = 0.000P = 0.000P = 0.000P = 0.000P = 0.015P = 0.001P = 0.019P = 0.000DFTcR = 0.71R = 0.48R = − 0.64R = − 0.40R = − 0.46R = − 0.52R = − 0.16R = − 0.27R = − 0.49R = − 0.76P = 0.000P = 0.002P = 0.000P = 0.013P = 0.004P = 0.001P = 0.32P = 0.10P = 0.002P = 0.000Inter-VD, dopR = − 0.40R = − 0.10R = 0.42R = 0.21R = 0.38R = 0.39R = − 0.039R = − 0.77R = 0.51R = 0.58P = 0.013P = 0.55P = 0.008P = 0.20P = 0.019P = 0.015P = 0.81P = 0.65P = 0.001P = 0.000Inter-VD,DTIR = − 0.39R = − 0.12R = 0.39R = 0.29R = 0.38R = 0.39R = − 0.12R = − 0.058R = 0.47R = 0.49P = 0.015P = 0.47P = 0.017P = 0.075P = 0.020P = 0.016P = 0.44P = 0.73P = 0.003P = 0.002Inter-VD,CCR = − 0.31P = 0.06R = − 0.17P = 0.29R = 0.34P = 0.03R = 0.33P = 0.05R = 0.24P = 0.13R = 0.26P = 0.11R = − 0.23P = 0.17R = − 0.13P = 0.44R = 0.43P = 0.007R = 0.50P = 0.001Inter-VD,strainR = 0.45R = 0.46R = 0.49R = 0.57R = 0.25R = 0.32R = 0.21R = 0.37R = 0.044R = 0.10P = 0.005P = 0.004P = 0.002P = 0.000P = 0.125P = 0.052P = 0.199P = 0.021P = 0.79P = 0.54SPWMDR = − 0.47R = − 0.22R = 0.53R = 0.41R = 0.34R = 0.38R = 0.11R = 0.09R = 0.60R = 0.58P = 0.003P = 0.17P = 0.001P = 0.03P = 0.03P = 0.02P = 0.5P = 0.58P = 0.000P = 0.000SLWSD DTIR = − 0.49R = − 0.25R = 0.48R = 0.48R = 0.57R = 0.59R = 0.34R = 0.36R = 0.33R = 0.38P = 0.002P = 0.12P = 0.002P = 0.002P = 0.000P = 0.000P = 0.04P = 0.03P = 0.04P = 0.02Refer to list of abbreviations before references, significant P value at P ≤ 0.05Table 14Correlation of dyssynchrony with other parametersMortalityAgeSexPro-BNPFCSLWMD DTILGE fibrosisLBBBQRS durIntra-VD (strain)R = 0.37P = 0.02R = 0.03P = 0.84R = − 0.12P = 0.46R = 0.48P = 0.002R = − 0.69P = 0.000R = 0.82P = 0.000R = 0.2P = 0.2R = 0.17P = 0.30R = 0.38P = 0.019DFTcR = − 0.30P = 0.067R = − 0.01P = 0.95R = − 0.16P = 0.33R = − 0.37P = 0.024R = − 0.50P = 0.002R = − 0.23P = 0.16R = − 0.25P = 0.16R = − 0.17P = 0.30R = − 0.49P = 0.002Inter-VD, dopR = 0.56P = 0.000R = 0.036P = 0.83R = 0.23P = 0.15R = 0.44P = 0.006R = 0.48P = 0.002R = 0.17P = 0.3R = 0.2P = 0.25R = 0.37P = 0.024R = 0.51P = 0.01Inter-VD, DTIR = 0.37P = 0.02R = − 0.004P = 0.98R = 0.19P = 0.24R = 0.39P = 0.01R = 0.19P = 0.25R = 0.18P = 0.27R = 0.16P = 0.36R = 0.3P = 0.07R = 0.47P = 0.03Inter-VD, CCR = 0.42P = 0.008R = 0.198P = 0.24R = 0.29P = 0.08R = 0.29P = 0.07R = 0.38P = 0.02R = 0.3P = 0.06R = 0.22P = 0.22R = o.22P = 0.18R = 0.44P = 0.007Inter-VD, strainR = 0.26P = 0.11R = 0.06P = 0.71R = 0.03P = 0.84R = 0.35P = 0.03R = 0.50P = 0.002R = 0.1P = 0.5R = 0.38P = 0.03R = 0.18P = 0.29R = 0.37P = 0.024SPWMDR = 0.35P = 0.03R = 0.20P = 0.21R = − 0.004P = 0.98R = 0.22P = 0.17R = 0.50P = 0.002R = 1R = 0.25P = 0.15R = 0.30P = 0.06R = 0.34P = 0.04LGE fibrosisR = 0.1P = 0.5R = 0.45P = 0.009R = 0.04P = 0.8R = 0.27P = 0.12R = 0.28P = 0.11R = 0.25P = 0.15R = 1R = 0.49P = 0.004R = 0.36P = 0.04Refer to list of abbreviations before references, significant P value at P ≤ 0.05
Our study showed 27% inter-VD by spectral DTI method and 38% by Doppler method where differentiation by QRSc was in favor of lack of complete correspondence of electrical and mechanical dyssynchrony (Tables 15 and 16). Table 15. Cross-tabulation of AO-PA diff Doppler with QRS intervalQRS ≥ 120 msQRS < 120 msTotalInter-VDPresent6, 75%8, 27%14, 38%Absent2, 25%21, 73%23, 62%82937Refer to list of abbreviations before referencesTable 16Cross-tabulation of AO-PA diff DTI Doppler with QRS intervalQRS ≥ 120 msQRS < 120 msTotalInter-VDPresent3, 37%7, 24%10, 27%Absent5, 63%22, 76%27, 73%82937Refer to list of abbreviations before references
Discussion
Numerous studies have highlighted the role of mechanical dyssynchrony in adult patients with heart failure, primarily to ameliorate patient selection for CRT. Our objective was to clarify different types of dyssynchrony to facilitate the application of CRT in pediatric patients.
Our study showed that 100% of DCM patients with prolonged QRS (QRS ≥ 120 ms) had intra-VD, of which 12.5% had mild, 25% mod and 62.5% severe dyssynchrony. However, around 83% of patients with narrow QRS (QRS < 120 ms) had intra-VD, of which 10% were mild, 52% mod, and 21% severe dyssynchrony and also revealed that 77% of DCM patients with prolonged PRc had AVD of which around 31% were mild, 31% mod, and 15% severe AVD, while among PRc < 200 ms, 54% did not have AVD, 38% mild AVD, 4% mod, and another 4% had severe AVD. Moreover, our study showed the presence of remarkable effect of prolonged QRS and PR on worsening LV and RV GLS, LV, and RV dyssynchrony score, LVEF, and pro-BNP. Likewise, they both could be accounted as some risk factors for mortality and clinical manifestation.
In the presence of prolonged PR interval, LV PET, IVCT, and IVRT are prolonged and ET is of short duration, actually interpreting as much wasted time and intrinsic workload without blood displacement, so MV opening is delayed and DFT is decreased, in which the correspondence was also demonstrated in our study [5, 10]. AVD can result in impaired filling of the LV, resulting in diminished stretching of myocyte and reduced LV stroke volume via the Frank–Starling mechanism; also concomitant contraction of the LA and the LV can induce retrograde blood flow into the pulmonary veins and, possibly, pulmonary edema [6, 7].
Classical pattern of dyssynchrony, as described by Forsha et al., is characterized by the early contraction of at least one septal segment and early stretching in at least one opposing lateral wall segment. This pattern is further defined by the presence of late post-systolic peak contraction occurring after aortic valve closure in the segment that initially experienced early stretching. The classical pattern was demonstrated in 38% of subjects with 2nd and 3rd AVB, all of whom had LBBB and LV dysfunction and also 35% of whom had elongated time to peak of ejection where seen in only 2% of non-classical pattern subjects [11]. They had previously performed a similar work on DCM pediatric patients for presence of classical pattern dyssynchrony, of which 85% of them had wide QRS [12]. Those findings chime with our study results regarding the compatibility of severity of dyssynchrony based on strain and tissue imaging (Tables 5 and 6) and also the correlation of severity of intra-VD and QRS interval (Tables 11 and 13).
In a study involving patients with advanced heart failure, TDI revealed that 27% of patients with a narrow QRS complex (< 120 ms) exhibited mechanical dyssynchrony. Conversely, 30% of patients with a very wide QRS complex (> 150 ms) showed no significant mechanical dyssynchrony [6]. Contrastingly, our study utililizing strain analysis found that 100% of DCM patients with prolonged QRS (QRSc ≥ 120 ms) had intra-VD, and 83% of patients with narrow QRS (QRSc < 120 ms) also exhibited intra-VD. This finding was determined by the later occurrence of peak strain after aortic valve closure time. Importantly, the severity of dyssynchrony in our patients ranged from mild to severe based on the scoring measurements, a finding that was not reported in the aforementioned study [6]. Moreover, our study showed the presence of remarkable effect of prolonged QRS and PR on worsening LV and RV GLS, LV, and RV dyssynchrony score, LVEF, and pro-BNP. Likewise, they both could be accounted as some risk factors for mortality and clinical manifestation (Table 11).
According to some research, a difference of more than 40 ms between the two velocities on CC DTI is considered abnormal [5, 6]. Thereby, our study showed 27% inter-VD by DTI Doppler method, of which 30% were among patients with prolonged QRS and 70% of narrow QRS group; however, the time difference was adjusted by HR in our patients. All of these data are in favor of lack of complete correspondence of electrical and mechanical dyssynchrony (Tables 15 and 16). We obtained inter-VD by other methods too, in which their cross-tabulation results waived in this article but are available on request. Based on strain analysis, we found no delay in 30% and just mild delay in 70%.
In earlier research, pre-CRT longitudinal strain analysis revealed a typical LBBB contraction pattern characterized by the presence of a septal flash (a rapid, short inward motion of the septum) and apical rocking (a transverse motion of the apex during systole in both left and right directions). These patterns demonstrated the most convincing evidence for clinical application. Post-CRT implantation, persistent or worsening dyssynchrony was directly correlated with an increased risk of fatal arrhythmias [13, 14]. Nevertheless, our patients were more likely candidates for heart transplantation rather than CRT, primarily due to the rare occurrence of actual LBBB in this cohort.
SPWMD has been suggested as a method to assess dyssynchrony in patients with heart failure, with a cutoff value of more than 130 ms between 2 opposing segments. Still, the cutoff point is not well defined in the pediatric age group due to higher and more variable heart rates. Moreover, the low reproducibility of SPWMD has been noted in previous studies, which limits its clinical value and practical application [6, 7]. However, in our study, only 37% of patients had SPWMD exceeding 130 ms, significantly lower than the 86% obtained from strain analysis. This discrepancy could primarily be attributed to the higher heart rate in children, suggesting a lower cutoff value may be more appropriate for identifying SPWMD in this population. Our findings are consistent with a study by Cazeau et al., which concluded that no single electromechanical parameter could fully describe mechanical dyssynchrony [14]. Additionally, a decrease in left time to ejection by TDI was found to be a favorable predictor of resynchronization, while an increase in DFT and a decrease in SPWMD were not considered good CRT targets [15].
Intra-VD can be evaluated using TDI and strain analysis, both of which provide insight into myocardial motion. Motion can be represented as velocity, displacement, or strain. In a healthy heart, the peaks of motion for all segments occur simultaneously, resulting in velocity curves from all regions of the LV peaking together during early systole, while strain curves peak at the end of systole. Conversely, in a dyssynchronous heart, the peaks of regional wall motion curves do not overlap [7]. However, detecting peak velocity can be challenging in some patients due to the presence of multiple, jagged, or flat peaks in the TDI color-coded velocity curves. Further, the timing of peak velocities can be significantly affected by even small changes in the placement of the region of interest. Additionally, TDI is unable to differentiate between active contraction and passive motion resulting from tethering or translational movement of the heart, which may further complicate the interpretation of results [6, 7]. A cutoff value of 65 ms has been suggested [6] which accordingly, our study showed the presence of 29% inter-VD by CC DTI peak values (Table 5).
We utilized strain analysis for assessing intra-VD since strain offers advantages in distinguishing motion resulting from active contraction, as opposed to tethering or translational motion of the heart. This analysis enables more accurate identification of delays for each segment. In addition, considering the higher and more variable heart rate in children and the lower reproducibility associated with TDI, strain analysis emerges as a more reliable and precise method for assessing intra-VD in this population.
LBBB is observed in approximately 30% of patients with heart failure [6]. Nonetheless, we found this pattern in only 10.8% of our patients, which could be explained by the age group difference.
Some investigators found that a time difference of > 130 ms between peak septal wall and posterior wall radial strain predicted long-term response to CRT [6]. Given the higher and more variable heart rate in children, the time difference required for the designation of dyssynchrony may be lower than 130 ms. To account for this, we partitioned the delay following aortic valve closure into three segments: the first, second, and third segments, which we termed mild, moderate, and severe (paradoxical) dyssynchrony, respectively. We then tallied the number of segments exhibiting mild, moderate, and severe dyssynchrony, as detailed in the Methods section.
Andrei et al. demonstrated that cardiac electromechanical dyssynchrony could be improved by hemodynamic treatment, including fluid expansion and inotropic drugs, in adult patients with hemodynamic instability. Their study established a connection between dyssynchrony and ventricular–arterial coupling [16].
A study involving heart failure patients with narrow QRS complexes revealed a significant electromechanical delay during peak physical exercise [17]. Another study in pediatric patients with DCM demonstrated that more severe LV discoordination was linked to increased LV dysfunction and a higher likelihood of death or transplantation [18].
A recent study in children with pulmonary hypertension revealed that RV and LV mechanical dyssynchrony, along with RV dilatation, were prognostic factors for poorer clinical outcomes [19]. Our study’s findings, demonstrating a direct correlation between mortality rate, functional capacity, and pro-BNP levels and the severity of intra-VD, inter-VD, and AVD, further support these observations (Table 14).
Using CMR, a study examining fibrosis in patients with heart failure revealed a link between greater degrees of intra-VD and fibrosis [20]. Our findings, however, indicated a nonsignificant positive correlation between the presence of fibrosis, as shown by late gadolinium enhancement in CMR, and both intra-VD and mortality. This discrepancy might be attributed to the fact that CMR was not performed for 5 of our patients, and our study’s follow-up period for mortality was both short and heterogeneous. While the correlation between fibrosis and mortality, GLS, and LVEF was nonsignificant, there was a significant positive correlation with age, LBBB, and QRS duration.
In a multivariate analysis including guideline criteria for CRT (i.e., QRS width, presence of LBBB, and ejection fraction), interventricular mechanical delay and Tei index, baseline DFT was the strongest predictor of adverse outcome [10].
Equilibrium radionuclide angiography (ERNA) has been proposed as a method to assess the severity of dyssynchrony by examining the dynamic structure associated with QRS and PR intervals, as well as LVEF. This approach aims to differentiate between absent, mild, and moderate-to-severe inter-VD and intra-VD [21]. A prior study found that dyssynchrony of papillary muscles with a value greater than 30 ms was predictive of moderate-to-severe mitral regurgitation in DCM patients [22].
In our study, the highest dyssynchrony scores, calculated based on the time of appearance of peak systolic strain after aortic valve closure (Table 6), were associated with the inferolateral, anterolateral, anterior, and anteroseptal walls, in descending order. Overall, advancements in echocardiographic techniques have the potential to improve its accuracy compared with CMR. Furthermore, the affordability, accessibility, and applicability of echocardiography in unstable hospitalized patients make it a more suitable option for monitoring patients with DCM.
According to this study results, we suggest that the acquisition of dyssynchrony parameters by echocardiography including inter-VD, intra-VD, and AVD can be used to identify the optimal candidates for cardiac resynchronization therapy (CRT) to enable achieving maximum benefit from CRT. It is obvious that the application of CRT can improve the systolic and diastolic ventricular function and reduces functional mitral regurgitation to great extent; thereby, it would be useful to postpone the heart transplant, as it would be encountered the scarcity, the impediments and later potential complications.
Conclusions
Our findings indicated that DCM causes both intra- and inter-VD, associated with QRS duration concerning severity, and also results in AVD that are correlated with PRc interval. Notably, a substantial proportion of patients with narrow QRSc also demonstrated intra-VD and inter-VD, while nearly half of those with normal PRc exhibited AVD. Collectively, these observations suggest a lack of complete correspondence between electrical and mechanical dyssynchrony.
Limitations of the study
The major limitation of our study is the small number of subjects. The second is that we had to perform echocardiography by ICU echosystem of GE S 60—which did not have the ability of taking GCS and GRS for inward patients, that led to the absence of GCS in most subjects and GRS at all. Furthermore, because of the higher and more variable HR in children, the time difference needed for the assignment of dyssynchrony in children might be lower than 130 ms. Therefore, we divide the amount of delay after AVC into three parts: the first, the second, and the third segments, namely mild, mod, and severe/paradoxical dyssynchrony, respectively**.** The third was that our patients were non-homogenous, regarding the severity of systolic dysfunction (most of patients had severe systolic dysfunction). The next was the unequal follow-up periods to determine the death rate, given the longer follow-up period for the earlier subjects entered in the study and the shorter follow-up periods for the later ones. The other shortcoming was that, given the lack of 3D deformation data because of non-availability of relevant software, we had to detect strain analysis just in two directions, which may not optimally reflect 3D heart motion. Finally none of our patients were undertaken CRT, so our mechanical dyssynchrony data could not be checked prior to and following that. Therefore, the further studies would be suggested in this regard to increase the accuracy and applicability.