Association between peripheral blood serum phenylalanine to tyrosine ratio and the risk of moyamoya disease: a case-control study
Shixiong Lei, Mengnan Wang, Jiali Pan, Daming Wang, Peicong Ge, Dong Zhang

TL;DR
This study found that higher levels of phenylalanine to tyrosine ratio in blood are linked to increased risk of moyamoya disease, suggesting it could be a useful biomarker.
Contribution
The study identifies a novel association between serum phenylalanine/tyrosine ratio and moyamoya disease risk in adults.
Findings
Serum phenylalanine/tyrosine ratio was significantly higher in moyamoya disease patients compared to healthy controls.
Elevated phenylalanine/tyrosine ratio was positively associated with increased risk of moyamoya disease after adjusting for traditional risk factors.
Adding phenylalanine/tyrosine ratio to conventional risk factors improved moyamoya disease risk prediction.
Abstract
Phenylalanine (Phe) and its metabolite tyrosine (Tyr) have been shown to play an important role in the mechanisms and development of cardiovascular and cerebrovascular disease, and its ratio (Phe/Tyr) has been suggested to be an important indicator of inflammation. It was uncertain whether Phe/Tyr is associated with higher risk of MMD. Therefore, we conducted this study to evaluate the relationship between Phe/Tyr and the risk of MMD and its subtypes. A total of 360 adult MMD patients and 89 age-matched healthy controls (HCs) were consecutively recruited for this prospective study. We measured peripheral blood serum Phe and Tyr levels in all participants to analyze the association between Phe/Tyr and the risk of MMD and its subtypes. Serum Phe/Tyr was significantly higher in MMD patients and their subtypes than in HCs (p < 0.01). After adjusting for traditional risk factors, Phe/Tyr…
Genes, proteins, chemicals, diseases, species, mutations and cell lines named across the full text — each resolved to its canonical identifier and authoritative record.
Click any figure to enlarge with its caption.
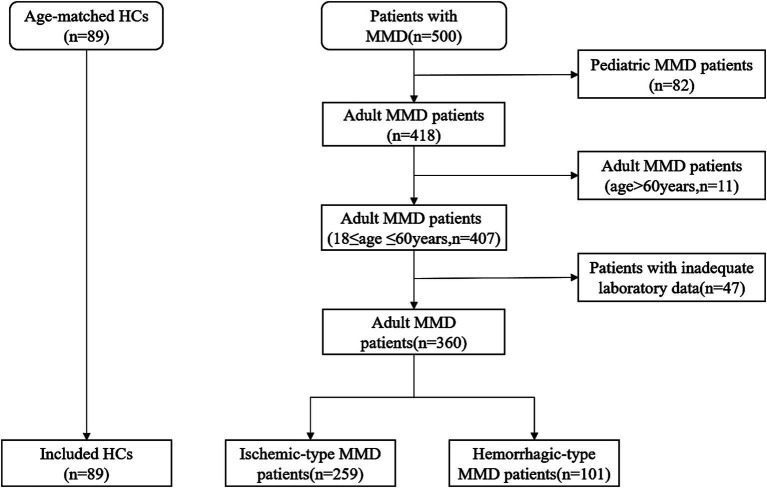 Figure 1
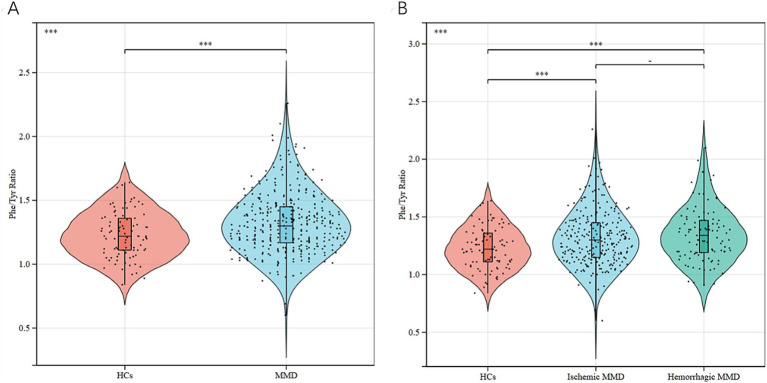 Figure 2
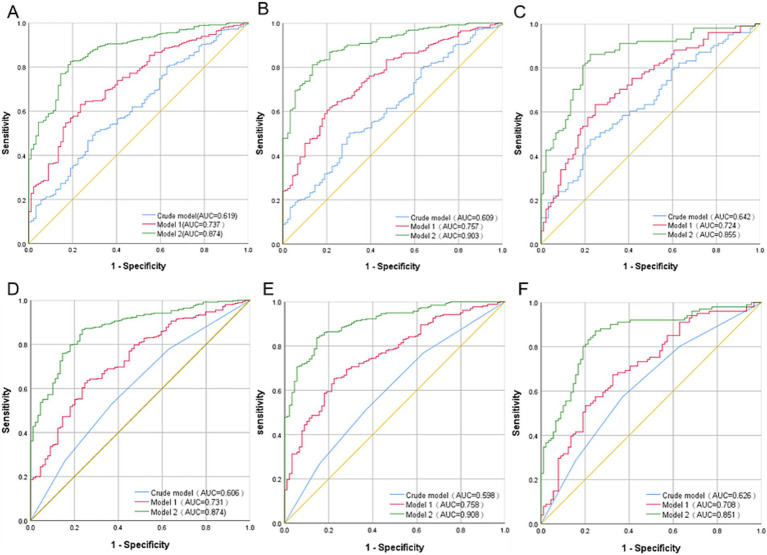 Figure 3
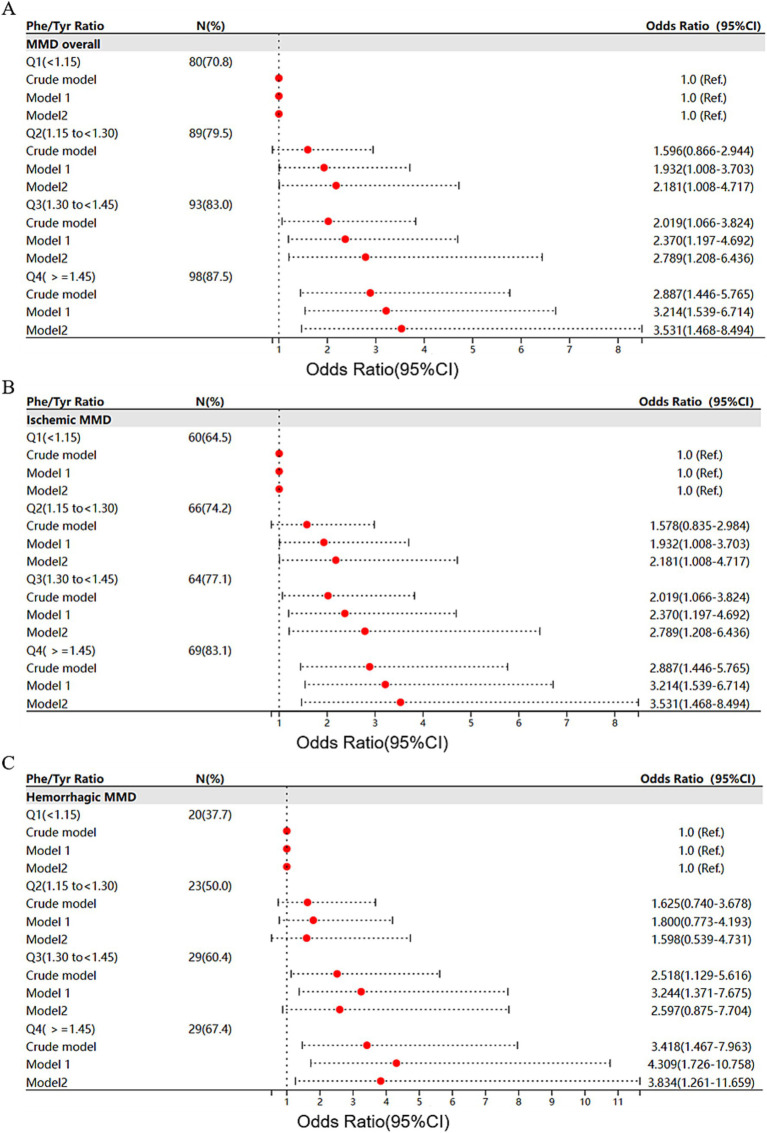 Figure 4
| Variables | HC ( | MMD ( | Ischemic ( | Hemorrhagic ( | |||
|---|---|---|---|---|---|---|---|
| Age, years, mean ± SD | 39.81 ± 11.57 | 41.60 ± 10.25 | 0.151 | 41.53 ± 10.12 | 0.185 | 41.78 ± 10.61 | 0.198 |
| Gender, male, | 37 (41.6) | 150 (41.7) | 0.987 | 116 (44.8) | 0.598 | 34 (33.7) | 0.261 |
| Medical history | |||||||
| Hypertension, | 0 (0.0) | 131 (36.4) | <0.001 | 102 (39.4) | <0.001 | 29 (28.7) | <0.001 |
| Diabetes, | 0 (0.0) | 59 (16.4) | <0.001 | 55 (21.2) | <0.001 | 4 (4.0) | 0.058 |
| Hyperlipidemia, | 0 (0.0) | 54 (15.0) | <0.001 | 45 (17.4) | <0.001 | 9 (8.9) | 0.004 |
| Smoking, | 2 (2.2) | 71 (19.7) | <0.001 | 54 (20.8) | <0.001 | 17 (16.8) | 0.001 |
| Drinking, | 0 (0.0) | 42 (11.7) | 0.001 | 34 (13.1) | <0.001 | 8 (7.9) | 0.007 |
| Clinical features, mean ± SD | |||||||
| Heart rate, bpm | 77.79 ± 9.73 | 78.54 ± 6.42 | 0.375 | 78.25 ± 6.59 | 0.602 | 79.30 ± 5.92 | 0.149 |
| SBP, mmHg | 123.64 ± 11.77 | 132.33 ± 12.81 | <0.001 | 133.56 ± 12.84 | <0.001 | 129.16 ± 12.25 | 0.003 |
| DBP, mmHg | 78.46 ± 8.35 | 81.85 ± 9.33 | 0.002 | 82.45 ± 9.42 | <0.001 | 80.32 ± 8.96 | 0.162 |
| BMI, kg/m2 | 23.94 ± 3.40 | 25.43 ± 4.51 | 0.004 | 25.87 ± 4.57 | <0.001 | 24.28 ± 4.15 | 0.585 |
| Laboratory examinations, mean ± SD | |||||||
| WBC count, 109/L | 6.09 ± 1.49 | 7.17 ± 2.08 | <0.001 | 7.26 ± 2.00 | <0.001 | 6.93 ± 2.25 | 0.004 |
| LY count, 109/L | 1.89 ± 0.50 | 2.01 ± 0.67 | 0.140 | 2.07 ± 0.59 | 0.022 | 1.83 ± 0.80 | 0.516 |
| NEUT count, 109/L | 3.69 ± 1.32 | 4.62 ± 1.94 | <0.001 | 4.64 ± 1.80 | <0.001 | 4.59 ± 2.27 | 0.001 |
| MONO count, 109/L | 0.35 ± 0.11 | 0.38 ± 0.14 | 0.084 | 0.39 ± 0.14 | 0.035 | 0.36 ± 0.13 | 0.649 |
| PLT count, 109/L | 248.26 ± 59.57 | 255.72 ± 70.75 | 0.359 | 259.01 ± 71.65 | 0.203 | 247.30 ± 68.01 | 0.923 |
| GLU, mmol/L | 5.10 ± 0.50 | 5.53 ± 1.55 | 0.010 | 5.71 ± 1.71 | <0.001 | 5.07 ± 0.89 | 0.888 |
| ALT, g/L | 22.00 ± 14.34 | 27.60 ± 24.32 | 0.038 | 28.79 ± 25.43 | 0.015 | 24.56 ± 21.04 | 0.437 |
| AST, g/L | 18.99 ± 5.11 | 19.61 ± 9.26 | 0.541 | 19.48 ± 9.19 | 0.643 | 19.95 ± 9.48 | 0.441 |
| ALB, g/L | 45.12 ± 2.20 | 45.25 ± 2.96 | 0.697 | 45.28 ± 3.01 | 0.635 | 45.16 ± 2.83 | 0.921 |
| Urea, mmol/L | 6.46 ± 10.57 | 4.70 ± 1.37 | 0.002 | 4.67 ± 1.34 | 0.003 | 4.79 ± 1.45 | 0.018 |
| Cr, μmol/L | 58.26 ± 15.08 | 57.05 ± 14.05 | 0.471 | 57.30 ± 13.68 | 0.581 | 56.41 ± 15.01 | 0.371 |
| UA, μmol/L | 310.61 ± 74.27 | 315.62 ± 90.23 | 0.628 | 322.55 ± 91.02 | 0.264 | 297.85 ± 86.06 | 0.313 |
| TG, mmol/L | 1.10 ± 0.73 | 1.42 ± 1.06 | 0.006 | 1.46 ± 1.15 | 0.003 | 1.33 ± 0.80 | 0.116 |
| TC, mmol/L | 4.65 ± 0.73 | 4.23 ± 0.98 | <0.001 | 4.09 ± 0.96 | <0.001 | 4.57 ± 0.94 | 0.557 |
| HDL- C, mmol/L | 1.52 ± 0.29 | 1.31 ± 0.28 | <0.001 | 1.28 ± 0.28 | <0.001 | 1.38 ± 0.26 | <0.001 |
| LDL- C, mmol/L | 2.72 ± 0.66 | 2.44 ± 0.85 | 0.003 | 2.31 ± 0.81 | <0.001 | 2.76 ± 0.84 | 0.750 |
| ApoA, g/L | 1.40 ± 0.19 | 1.30 ± 0.25 | <0.001 | 1.29 ± 0.26 | <0.001 | 1.31 ± 0.24 | 0.014 |
| ApoB, g/L | 0.82 ± 0.20 | 0.84 ± 0.22 | 0.488 | 0.82 ± 0.21 | 0.954 | 0.89 ± 0.24 | 0.032 |
| Homocysteine, μmol/L | 11.22 ± 6.27 | 13.40 ± 6.92 | 0.007 | 13.63 ± 7.41 | 0.004 | 12.79 ± 5.46 | 0.112 |
| Phenylalanine, μmol/L | 90.79 ± 15.43 | 95.61 ± 17.88 | 0.020 | 95.30 ± 17.10 | 0.036 | 96.43 ± 19.82 | 0.027 |
| Tyrosine, μmol/L | 74.76 ± 12.86 | 73.52 ± 15.11 | 0.476 | 73.75 ± 14.78 | 0.576 | 72.93 ± 16.01 | 0.393 |
| Phe/Tyr ratio | 1.22 ± 0.18 | 1.33 ± 0.23 | <0.001 | 1.32 ± 0.23 | <0.001 | 1.34 ± 0.23 | 0.001 |
| Phe + Tyr, mmol/L | 165.55 ± 25.61 | 0.364 | 0.364 | 0.364 | 0.364 | 0.364 | 0.364 |
| Characteristics | Q1(<1.17, | Q2 (1.17-<1.31, | Q3 (1.31-<1.46, | Q (≥1.46, | |
|---|---|---|---|---|---|
| Age, years, mean ± SD | 41.79 ± 10.54 | 43.00 ± 9.48 | 40.66 ± 10.50 | 40.96 ± 10.45 | 0.420 |
| Gender, male, | 30 (37.5) | 38 (42.7) | 45 (48.4) | 37 (37.8) | 0.399 |
| Medical history | |||||
| Hypertension, | 28 (31.1) | 32 (35.6) | 37 (41.1) | 34 (37.8) | 0.562 |
| Diabetes, | 13 (14.4) | 11 (14.4) | 14 (15.6) | 19 (21.1) | 0.571 |
| Hyperlipidemia, | 11 (12.2) | 14 (15.6) | 17 (18.9) | 12 (13.3) | 0.608 |
| Smoking, | 19 (21.1) | 14 (15.6) | 22 (24.4) | 16 (17.8) | 0.461 |
| Drinking, | 7 (7.8) | 12 (13.3) | 11 (12.2) | 12 (13.3) | 0.608 |
| Clinical features, mean ± SD | |||||
| Heart rate, bpm | 78.50 ± 5.70 | 78.62 ± 6.22 | 77.76 ± 7.15 | 79.29 ± 6.52 | 0.461 |
| SBP, mmHg | 132.94 ± 13.87 | 131.34 ± 10.40 | 132.90 ± 13.33 | 132.12 ± 13.48 | 0.817 |
| DBP, mmHg | 81.48 ± 9.68 | 80.94 ± 8.76 | 82.96 ± 10.02 | 82.03 ± 8.83 | 0.516 |
| BMI, kg/m2 | 25.73 ± 5.43 | 25.01 ± 4.24 | 25.78 ± 3.89 | 25.18 ± 4.34 | 0.574 |
| RNF213 p.R4810K, | 0.170 | ||||
| Wild-type | 65 (74.7) | 74 (83.1) | 74 (87.1) | 73 (82.0) | |
| Mutant | 22 (25.3) | 15 (16.9) | 11 (12.9) | 16 (18.0) | |
| Laboratory examinations, mean ± SD | |||||
| WBC count, 109/L | 6.90 ± 1.80 | 7.13 ± 2.27 | 7.45 ± 2.18 | 7.20 ± 2.03 | 0.358 |
| LY count, 109/L | 2.04 ± 0.62 | 1.85 ± 0.56 | 2.11 ± 0.79 | 2.02 ± 0.65 | 0.060 |
| NEUT count, 109/L | 4.35 ± 1.55 | 4.74 ± 2.22 | 4.77 ± 1.95 | 4.63 ± 1.97 | 0.462 |
| MONO count, 109/L | 0.37 ± 0.12 | 0.40 ± 0.18 | 0.40 ± 0.14 | 0.36 ± 0.11 | 0.171 |
| PLT count, 109/L | 253.08 ± 84.71 | 258.63 ± 68.91 | 249.23 ± 58.28 | 261.96 ± 69.08 | 0.631 |
| GLU, mmol/L | 5.60 ± 1.60 | 5.44 ± 1.19 | 5.44 ± 1.73 | 5.63 ± 1.65 | 0.774 |
| ALT, g/L | 30.04 ± 32.02 | 26.35 ± 21.33 | 27.45 ± 18.23 | 26.57 ± 23.75 | 0.728 |
| AST, g/L | 20.63 ± 11.04 | 19.52 ± 9.30 | 19.37 ± 6.90 | 18.92 ± 9.39 | 0.647 |
| ALB, g/L | 45.04 ± 2.83 | 45.08 ± 2.78 | 45.37 ± 3.13 | 45.50 ± 3.11 | 0.682 |
| Urea, mmol/L | 4.77 ± 1.19 | 4.70 ± 1.38 | 4.60 ± 1.45 | 4.74 ± 1.47 | 0.860 |
| Cr, μmol/L | 54.02 ± 13.89 | 57.57 ± 12.58 | 59.99 ± 15.58 | 56.61 ± 13.56 | 0.039 |
| UA, μmol/L | 312.39 ± 86.91 | 310.65 ± 80.47 | 326.88 ± 98.76 | 312.57 ± 94.25 | 0.597 |
| TG, mmol/L | 1.41 ± 1.13 | 1.34 ± 0.84 | 1.60 ± 1.39 | 1.36 ± 0.76 | 0.334 |
| TC, mmol/L | 4.20 ± 1.12 | 4.19 ± 1.12 | 4.31 ± 1.00 | 4.21 ± 0.87 | 0.813 |
| HDL-C, mmol/L | 1.31 ± 0.30 | 1.34 ± 0.27 | 1.29 ± 0.28 | 1.31 ± 0.28 | 0.679 |
| LDL-C, mmol/L | 2.39 ± 0.96 | 2.40 ± 0.76 | 2.51 ± 0.86 | 2.45 ± 0.79 | 0.784 |
| ApoA, g/L | 1.32 ± 0.27 | 1.29 ± 0.25 | 1.28 ± 0.23 | 1.30 ± 0.25 | 0.741 |
| ApoB, g/L | 0.82 ± 0.24 | 0.82 ± 0.21 | 0.86 ± 0.23 | 0.86 ± 0.21 | 0.343 |
| Homocysteine, μmol/L | 12.72 ± 6.22 | 13.90 ± 7.58 | 13.72 ± 8.56 | 13.24 ± 4.79 | 0.668 |
| Phenylalanine, μmol/L | 88.00 ± 14.11 | 93.20 ± 16.38 | 97.44 ± 18.03 | 103.80 ± 19.02 | <0.001 |
| Tyrosine, μmol/L | 83.16 ± 14.48 | 75.96 ± 13.59 | 70.89 ± 12.84 | 64.08 ± 12.86 | <0.001 |
| Phe/Tyr ratio | 1.06 ± 0.09 | 1.23 ± 0.04 | 1.37 ± 0.04 | 1.63 ± 0.17 | <0.001 |
| Phe + Tyr, mmol/L | 171.16 ± 27.04 | 169.16 ± 29.83 | 168.34 ± 30.77 | 167.88 ± 30.95 | 0.887 |
| Clinical type | 0.591 | ||||
| Ischemic type | 69 (76.7) | 62 (68.9) | 66 (73.3) | 62 (68.9) | |
| Hemorrhagic type | 21 (23.3) | 28 (31.1) | 24 (26.7) | 28 (31.1) | |
| Admission mRS, | 0.499 | ||||
| 0–2 | 82 (91.1) | 81 (90.0) | 84 (93.3) | 78 (86.7) | |
| 3–5 | 8 (8.9) | 9 (10.0) | 6 (6.7) | 12 (13.3) | |
| Suzuki stage, | 0.311 | ||||
| 1–2 | 25 (27.8) | 26 (28.9) | 20 (22.2) | 30 (33.3) | |
| 3–4 | 42 (46.7) | 46 (51.1) | 55 (61.1) | 39 (43.3) | |
| 5–6 | 23 (25.6) | 18 (20.0) | 15 (16.7) | 21 (23.3) | |
| Phe/Tyr | No. of | Crude Model | Model 1 | Model 2 | |||
|---|---|---|---|---|---|---|---|
| Events (%) | OR (95% CI) | OR (95% CI) | OR (95% CI) | ||||
| Moyamoya overall continuous | 360 (80.2) | 8.938 (2.715,29.421) | <0.001 | 10.698 (2.947,38.839) | <0.001 | 14.035 (2.784,70.748) | 0.001 |
| Quartiles | |||||||
| Q1 (<1.15) | 80 (70.8) | 1.0 (Ref.) | 1.0 (Ref.) | 1.0 (Ref.) | |||
| Q2 (1.15 to <1.30) | 89 (79.5) | 1.596 (0.866,2.944) | 0.134 | 1.932 (1.008,3.703) | 0.047 | 2.181 (1.008,4.717) | 0.048 |
| Q3 (1.30 to <1.45) | 93 (83.0) | 2.019 (1.066,3.824) | 0.031 | 2.370 (1.197,4.692) | 0.013 | 2.789 (1.208,6.436) | 0.016 |
| Q4 (> = 1.45) | 98 (87.5) | 2.887 (1.446,5.765) | 0.003 | 3.214 (1.539,6.714) | 0.002 | 3.531 (1.468,8.494) | 0.005 |
| Ischemic MMD continuous | 259 (74.4) | 7.735 (2.248,26.616) | 0.001 | 7.194 (1.801,28.726) | 0.005 | 18.658 (2.502,139.108) | 0.004 |
| Quartiles | |||||||
| Q1 (<1.15) | 60 (64.5) | 1.0 (Ref.) | 1.0 (Ref.) | 1.0 (Ref.) | |||
| Q2 (1.15 to <1.30) | 66 (74.2) | 1.578 (0.835,2.984) | 0.160 | 2.36 (1.167,4.771) | 0.017 | 5.419 (2.074,14.16) | 0.001 |
| Q3 (1.30 to <1.45) | 64 (77.1) | 1.853 (0.952,3.604) | 0.069 | 2.154 (1.025,4.523) | 0.043 | 3.367 (1.254,9.039) | 0.016 |
| Q4 (> = 1.45) | 69 (83.1) | 2.711 (1.327,5.538) | 0.006 | 2.577 (1.186,5.600) | 0.017 | 4.635 (1.602,13.408) | 0.005 |
| Hemorrhagic MMD continuous | 101 (53.2) | 15.870 (3.474,72.493) | <0.001 | 27.418 (5.069,148.3) | <0.001 | 23.028 (2.859,185.479) | 0.003 |
| Quartiles | |||||||
| Q1 (<1.15) | 20 (37.7) | 1.0 (Ref.) | 1.0 (Ref.) | 1.0 (Ref.) | |||
| Q2 (1.15 to <1.30) | 23 (50.0) | 1.625 (0.740,3.678) | 0.221 | 1.800 (0.773,4.193) | 0.173 | 1.598 (0.539,4.731) | 0.398 |
| Q3 (1.30 to <1.45) | 29 (60.4) | 2.518 (1.129,5.616) | 0.024 | 3.244 (1.371,7.675) | 0.007 | 2.597 (0.875,7.704) | 0.086 |
| Q4 (> = 1.45) | 29 (67.4) | 3.418 (1.467,7.963) | 0.004 | 4.309 (1.726,10.758) | 0.002 | 3.834 (1.261,11.659) | 0.018 |
| NRI | IDI | ||||
|---|---|---|---|---|---|
| Variables | AUC | Estimate(95%CI) | Estimate(95%CI) | ||
| MMD overall | |||||
| Basic model | 0.863 | Ref. | Ref. | ||
| Basic model + Phe/Tyr continuous | 0.874 | 0.393 (0.167–0.617) | <0.001 | 0.025 (0.005–0.044) | 0.012 |
| Basic model + Phe/Tyr quartiles | 0.874 | 0.386 (0.161–0.612) | <0.001 | 0.002(0.003–0.039) | 0.025 |
| Ischemic MMD | |||||
| Basic model | 0.895 | Ref. | Ref. | ||
| Basic model + Phe/Tyr continuous | 0.903 | 0.396 (0.159–0.632) | 0.001 | 0.020 (0.001–0.039) | 0.039 |
| Basic model + Phe/Tyr quartiles | 0.908 | 0.364 (0.128–0.600) | 0.003 | 0.018 (0.000–0.036) | 0.055 |
| Hemorrhagic MMD | |||||
| Basic model | 0.835 | Ref. | Ref. | ||
| Basic model + Phe/Tyr continuous | 0.855 | 0.500 (0.226–0.773) | <0.001 | 0.043 (0.015–0.071) | 0.003 |
| Basic model + Phe/Tyr quartiles | 0.851 | 0.489 (0.213–0.765) | <0.001 | 0.030 (0.006–0.053) | 0.013 |
- —National Key Research and Development Program of China10.13039/501100012166
Peer Reviews
No public reviews on file for this paper yet. If you reviewed it on a platform where reviews are public (OpenReview, ICLR, NeurIPS, ICML), you can paste yours below so the community can read it here.
Videos
No videos yet. Explain this paper in a talk, walkthrough, or lecture? Add one.
Taxonomy
TopicsMoyamoya disease diagnosis and treatment · Neurological Complications and Syndromes · Nuclear Receptors and Signaling
Introduction
1
Moyamoya disease (MMD) is a cerebrovascular disease characterized by progressive narrowing of the end portion of the internal carotid arteries and the formation of a fragile smoke-like network at the base of the brain (1). There are clear geographical differences in the incidence of MMD, which is more common in Japan, China, Korea and southeastern Asian countries (2). The prevailing trigger in the pathogenesis of MMD was thought to be genetic susceptibility (3). The discovery of RNF213 as a major susceptibility gene for MMD in East Asian populations opened new avenues for studying disease mechanisms and potential therapeutic targets (4–6). In addition, several traditional modifiable risk factors have been shown to be associated with MMD in our previous study (7) The exact pathogenesis of MMD is still unclear but it is more likely to be a multifactorial disease related to genetic, inflammation, immunne, and other factors (4, 8). However, not all cases can be explained by traditional risk factors, so it is essential to investigate the pathogenesis of MMD and identify new risk factors involved in its progression.
Phenylalanine (Phe) plays important roles in many physiological and pathological processes of the nervous system and other systemic diseases (9, 10). Tyrosine is an important metabolite of phenylalanine and a precursor for the synthesis of catecholamines and neurotransmitters. Fluctuating levels of Phe and Tyr in many disease states lead to changes in the Phe/Tyr ratio. Previous studies have shown that impaired conversion of phenylalanine to tyrosine is associated with chronic renal failure (11). Phe/Tyr ratio is also effective and applicable in predicting premotor Parkinson’s disease (12). Phe/Tyr is significantly elevated in the acute phase of acute ischemic stroke and is considered a potential biomarker (13). The aim of this study was to clarify the association between Phe/Tyr ratio and the risk of MMD and to help identify new potential biomarkers.
Materials and methods
2
Study participants
2.1
This prospective study continuously recruited 500 patients with MMD who were treated at Beijing Tiantan Hospital from September 2020 to December 2021. All patients must complete digital subtraction angiography (DSA) and be in compliance with the diagnostic criteria of the Japanese guidelines released in 2012 for the diagnosis of MMD. Pediatric patients and elderly patients over 60 years old were excluded. 47 patients were excluded due to lack of Phe and Tyr laboratory data. The flow chart for the inclusion of all study participants is shown in Figure 1. Finally, 360 cases of adult MMD patients were included, including 259 cases of ischemic MMD and 101 cases of hemorrhagic MMD. Eighty-nine age-matched healthy (HCs) people were included in the control group. These healthy participants and their family members have no history of MMD, heart disease or other cerebrovascular diseases. Informed consent to participate in this study was obtained from all participants.
Flow chart of the study participants. HCs, healthy controls; MMD, moyamoya disease.
Data collection
2.2
We collected the clinical characteristics of all participants on admission, including age, gender, body mass index (BMI), heart rate, and blood pressure, as well as past medical history (hypertension, diabetes, hyperlipidemia, smoking, and alcohol consumption). After a 15-min rest, the participants’ right arm systolic blood pressure (SBP) and diastolic blood pressure (DBP) were measured using a traditional mercury manometer, and heart rate data were recorded using an electrocardiograph. Fasting peripheral blood samples were collected from all participants for routine and biochemical blood tests, and blood samples were collected for Phe and Tyr determination. Serum samples are separated by centrifugation within 1 h and stored in a central laboratory fridge at −80°C until further analysis. Liquid chromatography-mass spectrometry (LC–MS) analysis was used for the quantification of Phe and Tyr. The laboratory technicians were unaware of the baseline characteristics of all patients. Genomic DNA was extracted from 350 patients using the QIA amp blood kit (QIAGEN, Hilden, Germany). We used primers named RNF213-4810F (rs112735431) 5’-GCCCTCCATTTCTAGCACAC-3’ and RNF213-4810R 5’-AGCTGTGGCGAAAGCTTCTA-3’ to detect the RNF213 p.R4810K variant. In total, 64 patients with the RNF213 rare variant p.R4810 k (rs112735431) were found in the 350 sequenced patients. We used the modified Rankin Scale (mRS) to evaluate neurological function status on admission. Suzuki staging was categorized based on the higher grade observed bilaterally. Baseline of all study participants are shown in Table 1.
Statistical analysis
2.3
Continuous variables were expressed as mean standard deviation (SD) and categorical variables as frequencies. Continuous variables were compared between the two groups using T-test or Mann–Whitney U test, and categorical variables were compared using Pearson chi-squared test and Fisher exact test. Kruskal-Wallis test or one-way ANOVA was used to compare groups. Three logistic regression models were used to examine the association between Phe/Tyr and the risk of MMD and its subtypes. The crude model is an unadjusted Phe/Tyr regression model. Model 1 was adjusted for sex, age, HR, SBP, DBP, BMI. Model 2 was further adjusted for white blood cell count (WBC), lymphocyte count (LY), neutrophil count (NEUT), monocyte count (MONO), platelet count (PLT), alanine aminotransferase (ALT), aspartate aminotransferase (AST), albumin (ALB), glucose (Glu), urea, uric acid (UA), creatinine (Cr), triglyceride (TG), total cholesterol (TC), high-density lipoprotein cholesterol (HDL-C), low-density lipoprotein cholesterol (LDL-C), apolipoprotein A (APOA), apolipoprotein B (APOB) and homocysteine (Hcy).
In addition, we evaluated the predictive performance of the model by constructing receptor operating characteristic (ROC) curves and the area under the curve (AUC). At the same time, the net reclassification index (NRI) and integrated discrimination improvement (IDI) were introduced to assess the improvement in model performance. One traditional model (including only the traditional risk factors in model 2) and two new models (including the risk factors in model 2 and either the Phe/Tyr continuous variable or the Phe/Tyr quartile variable) were created by using the logistic regression. SPSS software (version 26.0) and Project R (version 3.6.3) were used for all statistical analyses. p < 0.05 was considered statistically significant.
Results
3
Study participants and baseline characteristics
3.1
This study included a total of 360 cases of patients with MMD (259 ischemic MMD and 101 hemorrhagic MMD) and 89 cases of HCs. Table 1 shows the baseline comparisons of MMD patients and their subtypes with HCs. Patients with MMD and HCs have no statistical differences in age and sex (p > 0.05 for all). MMD patients have higher SBP, DBP, BMI, WBC, NEUT, Glu, ALT, TG and Hcy (p < 0.05 for all), while the levels of urea, TC, HDL-C, LDL-C and APOA were lower (p < 0.05 for all). MMD patients appear to have more risk factors as they have a higher incidence of hypertension, diabetes, hyperlipidemia, smoking and alcohol consumptions than HCs (p < 0.05 for all). The ischemic MMD also showed higher LY and MONO levels than HCs, in addition to the overall trend of differences between MMD and HC. The hemorrhagic MMD maintained the same trend as total MMD only for SBP, WBC, NEUT, Urea, HDL-C and apoA, while apoB was significantly higher than HCs. The serum Phe/Tyr ratio in MMD patients and its subtypes was significantly higher than in HCs (p < 0.05 for all) (Figure 2). Phe levels maintained the same trend (p < 0.05 for all), while Tyr levels were not different (p > 0.05 for all). At the same time, there was no difference in the sum of Phe and Tyr levels in MMD and its subtypes and HCs (p > 0.05 for all).
*Phe/Tyr ratio between MMD patients and HCs: (A) comparison of Phe/Tyr ratio between MMD patients and HCs (B) comparison of Phe/Tyr ratio between MMD subtypes and HCs. −p > 0.05, **p ≤ 0.001.
The Phe/Tyr ratio was assessed as quartiles, and the baseline characteristics of MMD patients are shown in Table 2. We found that the serum Phe level increased significantly with higher of Phe/Tyr quartile (the lowest quartile, Q1:86.58 ± 14.18 μmol/L; the highest quartile, Q4:103.97 ± 18.48 μmol/L) (p < 0.001). The serum Tyr level was significantly decreased (the lowest quartile, Q1:82.77 ± 14.14 μmol/L; the highest quartile, Q4:65.37 ± 12.90 μmol/L) (p < 0.001). Interestingly, the sum of serum Phe and Tyr levels did not differ between quartiles (p = 0.763).
Clinical features of the RNF213 p.R4810K variant
3.2
The enrolled patients were stratified into mutation and no mutation groups based on the presence of the RNF213 p.R4810K variant. Analysis of the Phe/Tyr ratio revealed no significant differences between the mutation (1.30 ± 0.24) and no mutation (1.33 ± 0.23) groups when treated as a continuous variable (p = 0.379). Similarly, categorization into quartiles (Q1–Q4) showed no association with mutation status (p = 0.17). Functional status at admission, assessed using the modified Rankin Scale (mRS), also demonstrated no significant disparity between groups when dichotomized as high (mRS 0–2) versus low (mRS 3–5) (p = 0.133). In contrast, a significant association was observed between the p.R4810K variant and advanced Suzuki stages (p = 0.023). Mutation patients exhibited a higher proportion of advanced-stage disease (Suzuki 3–4: 11.1%; Suzuki 5–6: 4.6%) compared to the no mutation group (Suzuki 3–4: 39.7%; Suzuki 5–6: 16.6%) (Supplementary Table S2).
Association of Phe/Tyr with the risk of MMD
3.3
Table 3 presents the association between the serum Phe/Tyr ratio and the risk of MMD. We found that Phe/Tyr was positively correlated with the risk of MMD in the crude model (OR: 8.938, 95%CI:2.715–29.421, p < 0.001). After model adjustment, the risk of MMD also increased with Phe/Tyr in model 1(OR: 10.698, 95%CI: 2.947–38.839, p < 0.001) and model 2 (OR: 14.035, 95%CI: 2.784–70.748, p = 0.001). In addition, The ROC curves showed that model 2 (AUC = 0.874) had significantly better predictive accuracy than the crude model (AUC = 0.619) and model 1 (AUC = 0.737) (Figure 3A).
Comparison of ROC curves of Phe/Tyr ratio for the risk of MMD and its subtypes in different models: (A) MMD overall; (B) ischemic MMD; and (C) hemorrhagic MMD; Comparison of ROC curves of Phe/Tyr ratio quartiles for the risk of MMD and its subtypes in different models. (D) MMD overall; (E) Ischemic MMD; (F) Hemorrhagic MMD.
When Phe/Tyr ratio was assessed as quartiles, we found that the proportion of total MMD events increased with increasing quartile of Phe/Tyr ratio. Phe/Tyr had higher risk of MMD in third (Q3) and fourth quartile (Q4) in the crude model compared to first quartile (Q1) (Q3, OR: 2.019, 95%CI:1.066–3.824, p = 0.031; Q4, OR: 2.887, 95%CI:1.446–5.765, p = 0.003). The risk of MMD increased with increasing Phe/Tyr quartile in model 1 (Q3, OR: 2.37, 95%CI:1.197–4.692, p = 0.013; Q4, OR: 3.214, 95%CI:1.539–6.714, p = 0.002). Model 2 also follows the same trend (Q3, OR: 2.789, 95%CI:1.208–6.436, p = 0.016; Q4, OR: 3.531, 95%CI:1.468–8.494, p = 0.005) (Figure 4A). Similarly, the ROC curve shows that Model 2 (AUC = 0.872) has significantly higher predictive power than the crude model (AUC = 0.606) and model 1(AUC = 0.731) (Figure 3D).
Forest plots of Phe/Tyr association with risk of MMD and its subtypes: (A) MMD overall; (B) ischemic MMD; and (C) hemorrhagic MMD.
Association of Phe/Tyr with the risk of MMD subtypes
3.4
The MMD subtypes also followed the same trend as the overall. The risk of ischemic MMD increased as the ratio of Phe/Tyr increased in the crude model (OR: 7.735, 95%CI: 2.248–26.616, p = 0.001), model 1 (OR: 7.194, 95%CI: 1.801–28.726, p = 0.005) and model 2 (OR: 18.658, 95%CI: 2.502–139.108, p = 0.004). The AUC of the ROC curve increased with the adjustment of the model (crude model, AUC = 0.609; model 1, AUC = 0.757; model 2, AUC = 0.903, Figure 3B). When Phe/Tyr was evaluated as quartiles, the risk of ischemic MMD was significantly higher in the higher quartile in the crude model (Q4, OR:2.711, 95%CI:1.327–5.538, p = 0.006), model 1 (Q4, OR:2.577, 95%CI:1.186–5.600, p = 0.017) and model 2 (Q4, OR: 4.635, 95%CI,1.602–13.408, p = 0.005) (Figure 4B). The ROC curve shows that model 2 (AUC = 0.908) has better predictive power than the crude model (AUC = 0.598) and model 1 (AUC = 0.758) (Figure 3E).
The risk of hemorrhagic MMD increased as the ratio of Phe/Tyr increased in the crude model (OR: 15.87, 95%CI: 3.474–72.493, p < 0.001), model 1 (OR: 27.418, 95%CI: 5.099–148.3, p < 0.001) and model 2 (OR: 23.028, 95%CI: 2.859–185.479, p = 0.003). The AUC value of the ROC curve increased with model development (crude model, AUC = 0.642; for model 1, AUC = 0.724; model 2, AUC = 0.855) (Figure 3C). When Phe/Tyr was evaluated as quartiles, the risk of hemorrhagic MMD was significantly higher in the higher quartile in the crude model (Q4, OR:3.418, 95%CI: 1.467–7.963, p = 0.004), model 1 (Q4, OR = 4.309, 95%CI: 1.726,10.758, p = 0.002) and model 2 [3.834 (1.261,11.659)] (Figure 4C). The AUC curve shows that model 2 (AUC = 0.851) has a better predictive power than the crude model (AUC = 0.626) and model 1 (AUC = 0.708) (Figure 3F).
Clinical correlations between Phe/Tyr and MMD
3.5
We investigated the association between imaging findings and the Phe/Tyr ratio in all patients. Suzuki staging was categorized based on the higher grade observed bilaterally: grade 1 (Suzuki stage 1–2), grade 2 (Suzuki stage 3–4), and grade 3 (Suzuki stage 5–6). No significant differences in Phe/Tyr levels were observed across Suzuki stages (p = 0.686). Additionally, preoperative mRS scores were used to stratify patients into two groups: a high-functioning group (mRS ≤ 2) and a low-functioning group (3 ≤ mRS ≤ 5). The Phe/Tyr ratio did not differ significantly between these groups (1.32 ± 0.23 vs. 1.35 ± 0.27, p = 0.552) (Supplementary Table S3).
Incremental predictive value of Phe/Tyr for the risk of MMD
3.6
We investigated whether the ability to predict the risk of overall MMD and its subtypes could be improved by adding Phe/Tyr to the base model (including all risk factors in model 2). The risk reclassification was significantly improved with the addition of Phe/Tyr to the conventional risk factors for overall MMD (NRI: 39.3%, p < 0.001; IDI: 2.5%, p = 0.012), ischemic MMD (NRI: 39.6%, p = 0.001; IDI: 2.0%, p = 0.039) and hemorrhagic MMD (NRI: 50.0%, p < 0.001: IDI: 4.3%, p = 0.003). The risk reclassification was also significantly improved with the addition of Phe/Tyr quartiles to the conventional risk factors overall MMD (NRI: 38.6%, p < 0.001; IDI: 0.2%, p = 0.025), ischemic MMD (NRI: 36.4%, p = 0.003) and hemorrhagic MMD (NRI: 48.9%, p < 0.001: IDI: 3.0%, p = 0.013) (Table 4).
Discussion
4
In this study, we found that Phe/Tyr levels were significantly higher in MMD patients than HCs. Meanwhile, we further studied the relationship between Phe/Tyr and the risk of MMD by using regression models, and found that high Phe/Tyr could increase the risk of MMD. Both ischemic MMD and hemorrhagic MMD showed good fit to the model. After adjusting the baseline characteristics and laboratory detection indicators, the clinical regression model further confirmed that Phe/Tyr was an independent risk factor for MMD, and the ROC curve was used to verify the accuracy of the model prediction. The inclusion of Phe/Tyr in the model provided significant improvements in risk reclassification and identification of MMD and its subtypes. These findings validate the value of Phe/Tyr as a novel biomarker for MMD, and to our knowledge, this is the largest and first study to assess the association of Phe/Tyr with the risk of MMD.
Phe is an essential amino acid that plays a crucial role in the biosynthesis of a wide range of cells and tissues. Its main metabolic enzymes are phenylalanine hydroxylase (PAH), converting it into Tyr, and glutamate oxaloacetate transaminase 1(GOT 1), converting it into phenylpyruvic acid (14, 15). Tyr is an important precursor substance for the synthesis of a number of neurotransmitters and hormones, including dopamine, epinephrine and norepinephrine (catecholamine), and also plays an important role in regulating mood and protecting the nervous system (16). In recent years, many studies have demonstrated that the overexpression of Phe was present in several central nervous system disorders, such as Alzheimer’s disease (10) and stroke (13). Serum phenylpyruvic acid levels have been shown to be reduced in patients with MMD. However, it is worth noting that N-acetyl-l-tyrosine, a key intermediate in catecholamine synthesis, showed a significant increase in MMD (17). Our study showed that Phe/Tyr levels were significantly higher in MMD patients than in HCs. Additionally, we observed a positive correlation between Phe/Tyr levels and the risk of MMD.
Phe/Tyr was considered a biomarker for some inflammatory responses, and Phe/Tyr showed numerical differences in different disease conditions, such as 1.24 in the study of patients with trauma and sepsis (18), 1.47 in patients with ovarian cancer (19), 1.75 in acute ischemic stroke (13), and 1.33 in this study. While the elevation of the Phe/Tyr ratio may not be specific to MMD, the significantly higher levels observed in MMD patients compared to HCs likely reflect unique metabolic dysregulation mechanisms. Chronic cerebral ischemia in MMD could result in diminished phenylalanine hydroxylase activity, thereby disrupting phenylalanine metabolism and contributing to the observed biomarker profile. In ovarian carcinoma, tumor inflammation and immune activation can interfere with the conversion of phenylalanine by attenuating PAH activity, leading to an increase in phenylalanine concentration (19). Furthermore, higher Phe/Tyr ratio associated with immune activation and inflammation in cardiovascular disease patients (20). Although he reasons for the elevated Phe/Tyr in patients with MMD are speculative, we have reason to suspect that this phenomenon is also present in MMD. Multiple studies have suggested that the progression of MMD is associated with inflammation (21). Tetrahydrobiopterin (BH4), a cofactor for PAH, was susceptible to significant depletion in the inflammatory response, leading to inhibition of Phe metabolism (22). Therefore, higher Phe/Tyr levels indicate that the pathway by which PAH converts Phe to Tyr may be impaired. Our study also confirmed this: with increasing Phe/Tyr quartile, serum Phe concentration gradually increased and Tyr gradually decreased. As a precursor of catecholamines, Tyr is mainly converted in the adrenal medulla. The reason for the decrease in serum Tyr concentration may be that Tyr is actively converted to catecholamine. In addition, inflammatory response in acute ischemic stroke could lead to increased oxidation of Tyr (23). Cerebrovascular diseases were thought to trigger pronounced catecholamine surges through diverse ways (24) It has been reported that increased catecholamine secretion may play a key role in the onset and progression of MMD (17, 25).
Elevated Phe/Tyr levels increase the risk of MMD. Although no significant association was observed between Phe/Tyr levels and Suzuki staging, this does not preclude its potential involvement in pathological vascular proliferation or disease progression in MMD. Phe/Tyr elevation may still play a role in endothelial dysfunction or collateral vessel formation, independent of the angiographic stage. Simultaneously, accumulating and metabolizing phenylalanine in the brain following a brain injury can lead to more severe brain damage and accelerate disease progression (16). Therefore, the metabolism of Phe after MMD is being analyzed in order to find reasonable methods improve the accumulation of Phe. In the current background of revascularization as the main basic treatment, it provides a new treatment plan. A study revealed a significant increase in Phe levels in the para-infarct cortex of experimental ischemic stroke mice, and hydroxysafflor yellow A could show a strong brain protective effect on ischemic stroke by reducing the change of Phe level induced by ischemic stress (26). MMD is a chronic hypoxic–ischemic cerebrovascular disease. Our study has confirmed that there is a significant increase in Phe levels in MMD. Another study found that the accumulation of Phe caused by exogenous addition could promote endothelial cell apoptosis. Meanwhile, Medioresinol (MDN) promoted Phe metabolism by increasing the expression of GOT1 and PAH after cerebral ischemia, and inhibited the apoptosis of cerebral microvascular endothelial cells (16). Abnormalities in apoptosis are widespread in vascular endothelial cells in MMD and apoptosis may play an important role in the development of MMD (27). It is reasonable to assume that the progression of inflammation and cerebral ischemia during MMD episodes affects PAH activity thus leading to inhibition of Phe metabolism. BH4 has been approved for the treatment of phenylketonuria due to congenital PAH deficiency (28). Although BH4 was not measured in this study, previous studies have demonstrated the plausibility of promoting the conversion of Phe through exogenous supplementation of BH4 after MMD to attenuate brain damage. Meanwhile, cerebral ischemic state promotes the synthesis and secretion of catecholamines in vivo, depleting tyrosine in the process and contributing to the elevated Phe/Tyr ratio in MMD patients. However, amino acid metabolism is systemic and multifactorial. Although our study confirmed the plausibility of Phe/Tyr as an independent risk factor for MMD. The lack of association with Suzuki staging or mRS scores may reflect the complexity of MMD progression, where metabolic disturbances and vascular remodeling operate through divergent pathways. Additionally, combining Phe/Tyr with other inflammatory or hemodynamic markers may enhance its predictive value for identifying high-risk subgroups or monitoring therapeutic responses.
This study still has some limitations. Firstly, the patients included in this study were all from one neurosurgery center, which may require a large multicenter prospective study to reduce bias; secondly, the study subjects were all Chinese adults, and it is uncertain whether children or other ethnic groups would have the same result; thirdly, the patients’ dietary intake could not be followed up. Different dietary habits may also cause differences in the distribution of amino acids. Fourthly, this is a cross-sectional study and it is not possible to analyze behavior over time or to establish long-term trends, making it difficult to establish a causal relationship between Phe/Tyr and MMD. Fifthly, the current investigation was not designed to evaluate potential associations between the Phe/Tyr and postoperative disease progression or longitudinal clinical outcomes. Prospective, longitudinal studies incorporating comprehensive clinical follow-up data are warranted to rigorously assess the prognostic significance of this biochemical parameter in postoperative monitoring paradigms.
Conclusion
5
Serum Phe/Tyr ratio is associated with the risk of MMD and its subtypes, showing its potential as a potential biomarker for MMD.
The reference list from the paper itself. Each links out to its DOI / PubMed record.
- 1Kuroda S Houkin K. Moyamoya disease: current concepts and future perspectives. Lancet Neurol. (2008) 7:1056–66. doi: 10.1016/S 1474-4422(08)70240-0, PMID: 18940695 · doi ↗ · pubmed ↗
- 2Huang S Guo ZN Shi M Yang Y Rao M. Etiology and pathogenesis of Moyamoya disease: an update on disease prevalence. Int J Stroke. (2017) 12:246–53. doi: 10.1177/1747493017694393, PMID: 28381201 · doi ↗ · pubmed ↗
- 3Ahn HS Kazmi SZ Kang T Kim DS Kim HJ. Familial risk for Moyamoya disease among first-degree relatives, based on a population-based aggregation study in Korea. Stroke. (2020) 51:2752–60. doi: 10.1161/STROKEAHA.120.029251, PMID: 32811391 · doi ↗ · pubmed ↗
- 4Ihara M Yamamoto Y Hattori Y Liu W Kobayashi H Ishiyama H. Moyamoya disease: diagnosis and interventions. Lancet Neurol. (2022) 21:747–58. doi: 10.1016/s 1474-4422(22)00165-X, PMID: 35605621 · doi ↗ · pubmed ↗
- 5Kamada F Aoki Y Narisawa A Abe Y Komatsuzaki S Kikuchi A. A genome-wide association study identifies RNF 213 as the first Moyamoya disease gene. J Hum Genet. (2011) 56:34–40. doi: 10.1038/jhg.2010.132, PMID: 21048783 · doi ↗ · pubmed ↗
- 6Liu W Morito D Takashima S Mineharu Y Kobayashi H Hitomi T. Identification of RNF 213 as a susceptibility gene for moyamoya disease and its possible role in vascular development. P Lo S One. (2011) 6:e 22542. doi: 10.1371/journal.pone.0022542, PMID: 21799892 PMC 3140517 · doi ↗ · pubmed ↗
- 7Ge P Zhang Q Ye X Liu X Deng X Wang J. Modifiable risk factors associated with Moyamoya disease: a case-control study. Stroke. (2020) 51:2472–9. doi: 10.1161/STROKEAHA.120.030027, PMID: 32640948 · doi ↗ · pubmed ↗
- 8Mertens R Graupera G-M Mi Gerhardt H Bersano A Tournier-Lasserve E Mensah M. The genetic basis of Moyamoya disease. Transl Stroke Res. (2022) 13:25–45. doi: 10.1007/s 12975-021-00940-2, PMID: 34529262 PMC 8766392 · doi ↗ · pubmed ↗