Author Correction: O-ring-induced transverse aortic constriction (OTAC) is a new simple method to develop cardiac hypertrophy and heart failure in mice
Yasuhisa Nakao, Jun Aono, Mika Hamaguchi, Kayo Takahashi, Tomohisa Sakaue, Katsuji Inoue, Shuntaro Ikeda, Osamu Yamaguchi

Abstract
Genes, proteins, chemicals, diseases, species, mutations and cell lines named across the full text — each resolved to its canonical identifier and authoritative record.
Click any figure to enlarge with its caption.
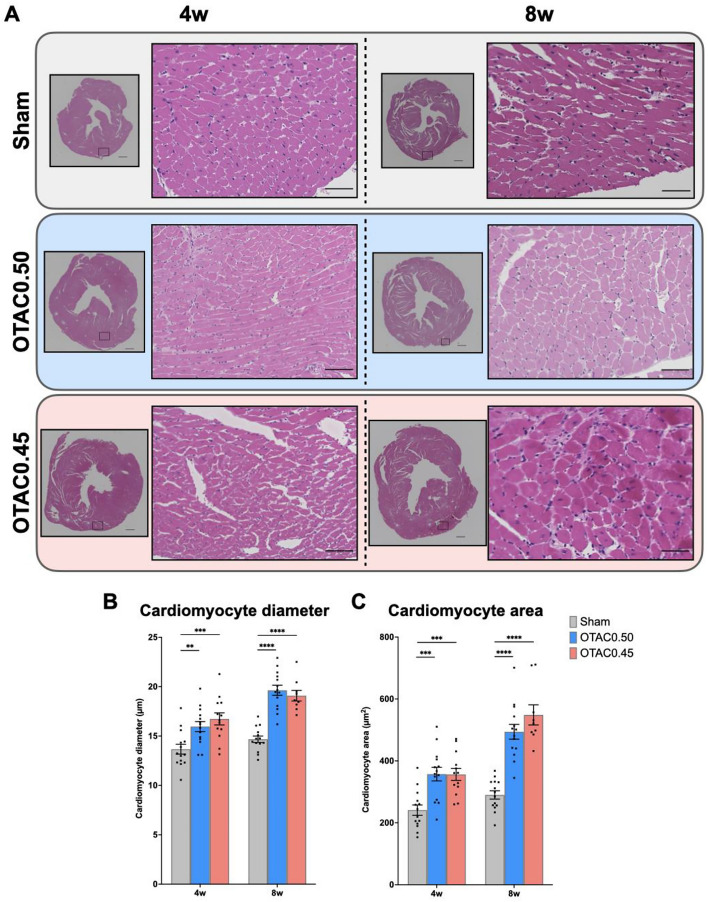 Figure 5
Peer Reviews
No public reviews on file for this paper yet. If you reviewed it on a platform where reviews are public (OpenReview, ICLR, NeurIPS, ICML), you can paste yours below so the community can read it here.
Videos
No videos yet. Explain this paper in a talk, walkthrough, or lecture? Add one.
Taxonomy
TopicsEicosanoids and Hypertension Pharmacology · Peroxisome Proliferator-Activated Receptors · Adipose Tissue and Metabolism
Correction to: Scientific Reports 10.1038/s41598-021-04096-9, published online 07 January 2022
This Article contains errors in Figure 5, panel (A) where both high-magnification images corresponding to OTAC 0.45 and OTAC 0.50 at 4 weeks (4w) are accidentally swapped between different samples. Additionally, the regions shown in the low-magnification images for OTAC 0.50 at 8 weeks (8w) do not correctly correspond to the high-magnification images. The correct Figure 5 and accompanying legend appears below.Figure 5. Cardiac histology at 4 and 8 weeks post-procedure. (A) Representative images of short-axis cardiac sections with hematoxylin and eosin staining in Sham and OTAC. Left: 4 × magnification of left ventricular at mid-ventricular sections. Scale = 500 µm. Right: 40 × magnification of a representative area. Scale = 100 µm. (B) Quantification of cardiomyocyte diameter of the short axis. (C) Quantification of cardiomyocyte area. Comparison among groups was performed by one-way ANOVA with Tukey’s post hoc tests; n = 9–14. **P < 0.01; ***P < 0.001; ****P < 0.0001.