Expression profiling of primary and metastatic oral squamous cell carcinoma identifies progression‐associated transcriptome changes and therapeutic vulnerabilities
Jonas Pyko, Markus Glaß, Julia Rosemann, Matthias Kappler, Jana Macho, Sarah Qasem, Stefan Hüttelmaier, Alexander W. Eckert, Monika Haemmerle, Tony Gutschner

Abstract
Genes, proteins, chemicals, diseases, species, mutations and cell lines named across the full text — each resolved to its canonical identifier and authoritative record.
Click any figure to enlarge with its caption.
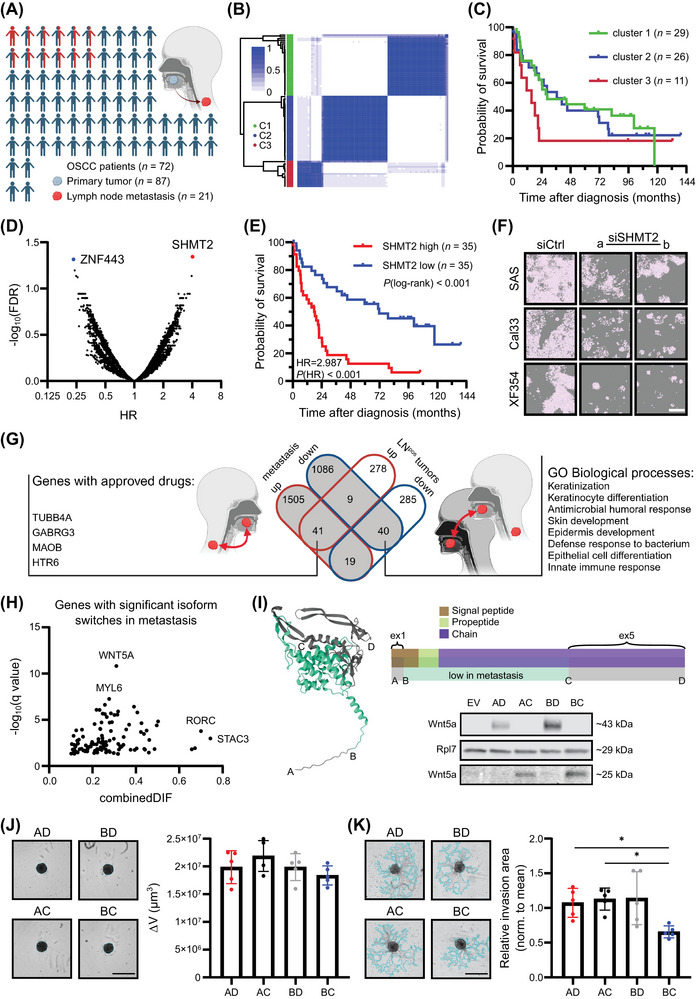 FIGURE 1
Peer Reviews
No public reviews on file for this paper yet. If you reviewed it on a platform where reviews are public (OpenReview, ICLR, NeurIPS, ICML), you can paste yours below so the community can read it here.
Videos
No videos yet. Explain this paper in a talk, walkthrough, or lecture? Add one.
Taxonomy
TopicsHead and Neck Cancer Studies · RNA modifications and cancer · Cancer-related gene regulation
1
Oral squamous cell carcinoma (OSCC), a major subgroup of head and neck squamous cell carcinoma (HNSCC), is an aggressive disease that preferentially spreads to cervical lymph nodes. Positive lymph node status is an important predictor of survival in OSCC [1, 2, 3]. Hence, a better understanding of the molecular mechanisms underlying oral cancer metastasis and the identification of therapeutic vulnerabilities are needed to prevent and treat metastatic disease.
We collected 87 primary tumors and 21 lymph node metastasis (LNM) from 72 OSCC patients to conduct comprehensive transcriptome‐wide expression and correlation analyses (Figure 1A). First, we performed expression‐based clustering with all primary tumors and observed the best subdivision with k = 3 using protein‐coding and non‐coding genes (Figure 1B). Of note, we observed transcriptional heterogeneity among multiregional tumor samples in about 30% of the cases, leading to the assignment of these patients and their respective tumors to different clusters. Intriguingly, Kaplan‐Meier analysis of patients whose tumors were unambiguously assigned to only one cluster revealed that cluster 3 (C3) had the worst outcome, with a median survival of 15.6 months compared to 28.57 and 36.53 months for clusters 1 (C1) and 2 (C2), respectively (Figure 1C). Importantly, prognostic factors known to negatively affect survival, such as high T, N, and G status, were not enriched in C3 tumors (Supplementary Figure S1A‐C). However, gene expression analysis identified 244 genes that were significantly changed in C3 compared to C1/2 tumors (Supplementary Figure S1D, Supplementary Table S1). Of note, cell cycle‐related gene sets, including Early region 2 binding factor (E2F) and Myelocytomatosis oncogene (MYC) target genes, along with other oncogenic signaling pathways, showed a positive normalized enrichment score (NES), potentially explaining the poor outcomes of C3 tumors (Supplementary Figure S1E).
*Deep transcriptome and isoform analysis reveals survival and metastasis biomarkers and targeting options for oral squamous cell carcinoma.(A) Overview of the Oral Squamous Cell Carcinoma (OSCC) patient and tissue cohort. The scheme was created in BioRender. Gutschner, T. (2025) https://BioRender.com/q66a024.(B) Consensus matrix of the primary tumor samples obtained via consensus clustering. Consensus values indicate the frequency with which samples clustered together (0 ‐ never to 1 ‐ always) during distinct permutations of the algorithm.(C) Kaplan‐Meier overall survival (OS) analysis of patients with tumors unambiguously assigned to one of three clusters. Patients with cluster 3 tumors tend to have worse OS.(D) Hazard ratio (HR) values plotted against False Discovery Rate (FDR)‐adjusted log‐rank test‐derived P‐values of all protein‐coding and non‐coding genes. Samples were divided by tertile separation, and the gene list was filtered for at least 10 samples per group (genes with FDR ≤ 0.05 are highlighted).(E) Kaplan‐Meier analysis of OS in the OSCC cohort (n = 70 patients) stratified by SHMT2 mRNA abundance. Samples were divided by median separation.(F) Representative images of OSCC cell lines after transfection with two independent SHMT2‐targeting small interfering RNAs (siSHMT2a/b). Two‐dimensional growth was strongly impaired after depletion of SHMT2 in all three cell lines. The white scale bar indicates 400 µm.(G) Venn diagram of significantly deregulated genes in metastases and LNMpos‐ tumors. Genes upregulated in both datasets and targeted by an approved drug, as well as gene ontology (GO) biological processes significantly overrepresented in downregulated genes found in both datasets, are indicated. The scheme was created in BioRender. Gutschner, T. (2025) https://BioRender.com/k79r687.(H) Plot of genes with significant isoform switches (q ≤ 0.05) in metastases, as obtained by the R package IsoformAnalyzeR. Genes with the highest combined differences in isoform fraction values (DIFs) and lowest q‐values are highlighted.(I) Three‐dimensional protein structure of the canonical WNT5A protein according to AlphaFold. The turquoise area marks the WNT5A‐203 isoform, which is decreased in lymph node metastases. Letter codes indicate primer binding sites for the cloned overexpression constructs used for functional assays. Representative Western blot (n = 3) shows the overexpression of different WNT5A protein isoforms in SAS cells. Ribosomal Protein L7 (RPL7) was used as a loading control.(J‐K) Representative pictures depicting spheroid growth (J) and matrigel‐based invasion (K) upon overexpression of the respective WNT5A isoforms in SAS cells (scale bars = 800 µm). Bar graphs show the mean and standard deviation (n = 5). One‐way ANOVA (Holm‐Sidak corrected) was performed for statistical testing, with P ≤ 0.05.Abbreviations: C1/2/3, cluster 1/2/3; DIF, differences in isoform fraction; GABRG3, Gamma‐Aminobutyric Acid Type A Receptor Subunit Gamma 3; GO, gene ontology; FDR, False Discovery Rate; HR, Hazard ratio; HTR6, 5‐Hydroxytryptamine Receptor 6; LNMpos, lymph node metastasis‐positive; MAOB, Monoamine Oxidase B; MYL6, Myosin Light Chain 6; OS, overall survival; OSCC, oral squamous cell carcinoma; RORC, RAR Related Orphan Receptor C; Rpl7, Ribosomal Protein L7; SHMT2, Serine Hydroxymethyltransferase 2; siSHMT2a/b, small interfering RNAs a/b targeting SHMT2; STAC3, SH3 And Cysteine Rich Domain 3; TUBB4A, Tubulin Beta 4A Class Iva; WNT5A, Wnt family member 5A; ZNF443, Zinc Finger Protein 443.
SHMT2 is a biomarker and therapeutic target in OSCC
2
Next, we performed a gene expression‐based overall survival (OS) analysis and identified two significant genes, namely Zinc Finger Protein 443 (ZNF443) and Serine Hydroxymethyltransferase 2 (SHMT2) (Figure 1D, Supplementary Table S2). Specifically, ZNF443 expression was associated with a reduced risk (Hazard ratio [HR] = 0.238), whereas expression of SHMT2 (HR = 4.028) suggested a higher risk of mortality. Thus, we further tested their prognostic relevance for OS and recurrence/disease‐free survival (RFS/DFS) in our patient cohort (Figure 1E, Supplementary Figure S2A‐C) as well as in The Cancer Genome Atlas (TCGA) HNSCC dataset (Supplementary Figure S2D‐E) [4]. These analyses indicated that SHMT2, but not ZNF443, might serve as an OSCC‐specific biomarker for OS. In line with this, SHMT2 expression was higher in HNSCC tissues compared to normal tissues, as well as in T4 versus T1 tumors of the OSCC subtype, and its expression level increased with higher tumor grade (Supplementary Figure S3). Furthermore, univariate Cox regression analysis demonstrated a significant association of age, T‐stage, N‐stage, and SHMT2 expression (Relative Risk [RR] = 1.548, P = 0.049; 95% confidence interval [CI] = 1.000‐2.396]) with OS in OSCC patients. Multivariate analysis further confirmed the association of SHMT2 (RR = 1.616, P = 0.041; 95% CI = 1.020‐2.559]) (Supplementary Table S3). Intriguingly, downregulating SHMT2 in SAS, Cal33, and XF354 cells or blocking its activity using an inhibitor [5] reduced proliferation and viability while inducing apoptosis (Figure 1F, Supplementary Figure S4). These data confirmed previous studies and underscored the therapeutic potential of SHMT2 in OSCC [6, 7].
Identification of metastasis‐associated genes as potential therapeutic targets
3
Next, we aimed to characterize the metastasis‐associated transcriptome in our OSCC cohort. First, we compared the transcriptome of primary tumors and matched LNM from each patient. This analysis identified 1,710 deregulated protein‐coding and 990 long non‐coding RNA (lncRNA) genes (false discovery rate [FDR] ≤ 0.05; | log2(Fold change) | ≥ 1). Subsequent gene set enrichment analysis revealed 32 gene sets, including Kirsten Rat Sarcoma Viral Oncogene Homology (KRAS) signaling and epithelial‐to‐mesenchymal transition (EMT)‐promoting gene sets, among others, which showed positive enrichment in metastasis (Supplementary Figure S5A‐C, Supplementary Tables S4‐S5). In order to narrow down the list of putative metastasis‐associated genes, we compared gene expression patterns between primary tumors with (n = 43) and without (n = 24) LNM. This complementary approach uncovered 482 deregulated protein‐coding and 190 lncRNA genes (Supplementary Figure S5D‐E, Supplementary Tables S6‐S7). Intriguingly, a total of 31 gene sets were significantly enriched in LNM‐positive (LNM^pos^) tumors, but only EMT‐promoting genes showed consistent positive enrichment in both differential gene expression analysis (Supplementary Figure S5F). To identify individual genes driving and maintaining metastases, we intersected the lists of differentially expressed genes from both analyses (Supplementary Table S8). This revealed a common set of 41 upregulated and 40 downregulated genes. Gene ontology analysis suggested that differentiation‐associated processes were impaired in both LNM and LNM‐positive tumors (Figure 1G). Importantly, a database search using the canSAR knowledgebase [8] identified four consistently upregulated genes that are targetable with approved clinical drugs. However, their cellular and molecular functions as well as their contribution to OSCC metastasis needs to be established using appropriate in vitro and in vivo models.
Analysis of metastasis‐associated isoform usage
4
Finally, we extended our gene‐level expression analysis and characterized gene isoform usage in primary tumors and their matched metastasis. We identified hundreds of alternative transcription events that were either enriched or diminished in metastasis (Supplementary Figure S6A). At the individual gene level, this analysis yielded a list of 114 genes with significant isoform switches (Figure 1H, Supplementary Table S9). The most significant isoform switches were observed for Wnt Family Member 5A (WNT5A) and Myosin Light Chain 6 (MYL6), whereas SH3 And Cysteine Rich Domain 3 (STAC3), and RAR Related Orphan Receptor C (RORC) showed the highest combined differences in isoform fraction (dIF) values (Figure 1H). We decided to investigate the isoform switch in WNT5A in greater detail. In metastases, the canonical isoform (WNT5‐201) was more abundant, while the fractions of WNT5A‐202 (encoding the same WNT5A protein) and WNT5‐203 (encoding a shorter protein variant) were significantly reduced (Supplementary Figure S6B). We generated overexpression constructs, transduced SAS cells with these variants, and successfully detected all WNT5A proteins at their expected size (Figure 1I). Intriguingly, overexpression of the canonical WNT5A protein only slightly enhanced spheroid growth in SAS cells but strongly increased their invasive capacity (Supplementary Figure S6C‐D). Moreover, comparison of the different WNT5A isoforms revealed no significant differences in growth (Figure 1J). However, cells overexpressing the WNT5A‐203 (BC construct) isoform exhibited markedly reduced invasive potential in Matrigel compared to cells expressing other WNT5A protein variants (Figure 1K). These findings suggest that inhibiting the canonical WNT5A isoform may represent a therapeutic strategy to prevent metastasis in OSCC, consistent with previous reports [9].
In summary, our study contributes to OSCC profiling and target identification efforts [4, 10] in a unique manner. Our carefully selected sample collection included LNM‐negative and LNM^pos^ primary tumors as well as their matched metastases. Furthermore, RNA isolated in this study was subjected to total RNA sequencing upon ribosomal RNA depletion, providing a more unbiased view of the primary and metastatic oral cancer transcriptome. This approach enabled the identification of coding and non‐coding genes, as well as isoforms, associated with OSCC metastasis. However, additional studies are needed (see Supplementary Discussion) to confirm the described associations and validate the clinical relevance of individual candidates in vitro and in vivo.
AUTHOR CONTRIBUTIONS
The study was conceptualized by Jonas Pyko, Markus Glaß, and Tony Gutschner with input from Monika Hämmerle and Stefan Hüttelmaier. Experiments were performed by Jonas Pyko, Julia Rosemann, Jana Macho, and Sarah Qasem. Patient tumor samples were collected by Matthias Kappler and Alexander W. Eckert. Pathological sample evaluation was performed by Monika Hämmerle. Computational analysis was performed by Markus Glaß and Stefan Hüttelmaier. Analysis of experimental data was done by Jonas Pyko, Markus Glaß, and Tony Gutschner. The manuscript was written by Jonas Pyko, Markus Glaß, and Tony Gutschner with input from all authors. Figures were prepared by Jonas Pyko, Markus Glaß, and Tony Gutschner. All authors have read and agreed to the final version of the manuscript.
COMPETING INTERESTS
The authors declare that they have no competing interests.
FUNDING INFORMATION
This study was supported by intramural funding from the Medical Faculty (Wilhelm‐Roux program, FKZ32/19).
ETHICS APPROVAL AND CONSENT TO PARTICIPATE
Ethical registry 210/19.08.09/10 was obtained from the Ethics Committee of the Medical Faculty of the University Halle. All patients gave written informed consent (Department of Oral and Maxillofacial Plastic Surgery, University of Halle‐Wittenberg, Germany).
Supporting information
Supporting Information
Supporting Information
The reference list from the paper itself. Each links out to its DOI / PubMed record.
- 1Lee H , Roh JL , Cho KJ , Choi SH , Nam SY , Kim SY . Number of positive lymph nodes better predicts survival for oral cavity cancer. J Surg Oncol. 2019;119(6):675‐682.30672597 10.1002/jso.25386 · doi ↗ · pubmed ↗
- 2Shah JP . Cervical lymph node metastases–diagnostic, therapeutic, and prognostic implications. Oncology (Williston Park). 1990;4(10):61‐69; discussion 72, 6.2149826 · pubmed ↗
- 3Zanoni DK , Montero PH , Migliacci JC , Shah JP , Wong RJ , Ganly I , et al. Survival outcomes after treatment of cancer of the oral cavity (1985‐2015). Oral Oncol. 2019;90:115‐521.30846169 10.1016/j.oraloncology.2019.02.001PMC 6417804 · doi ↗ · pubmed ↗
- 4Cancer Genome Atlas N. Comprehensive genomic characterization of head and neck squamous cell carcinomas. Nature. 2015;517(7536):576‐582.25631445 10.1038/nature 14129 PMC 4311405 · doi ↗ · pubmed ↗
- 5Ducker GS , Ghergurovich JM , Mainolfi N , Suri V , Jeong SK , Hsin‐Jung Li S , et al. Human SHMT inhibitors reveal defective glycine import as a targetable metabolic vulnerability of diffuse large B‐cell lymphoma. Proc Natl Acad Sci U S A. 2017;114(43):11404‐11409.29073064 10.1073/pnas.1706617114 PMC 5664509 · doi ↗ · pubmed ↗
- 6Liao Y , Wang F , Zhang Y , Cai H , Song F , Hou J. Silencing SHMT 2 inhibits the progression of tongue squamous cell carcinoma through cell cycle regulation. Cancer Cell Int. 2021;21(1):220.33863325 10.1186/s 12935-021-01880-5PMC 8052717 · doi ↗ · pubmed ↗
- 7Zhang H , Che Y , Xuan B , Wu X , Li H . Serine hydroxymethyltransferase 2 (SHMT 2) potentiates the aggressive process of oral squamous cell carcinoma by binding to interleukin enhancer‐binding factor 2 (ILF 2). Bioengineered. 2022;13(4):8785‐8797.35333683 10.1080/21655979.2022.2051886 PMC 9161932 · doi ↗ · pubmed ↗
- 8di Micco P , Antolin AA , Mitsopoulos C , Villasclaras‐Fernandez E , Sanfelice D , Dolciami D , et al. can SAR: update to the cancer translational research and drug discovery knowledgebase. Nucleic Acids Res. 2023;51(D 1):D 1212‐D 1219.36624665 10.1093/nar/gkac 1004 PMC 9825411 · doi ↗ · pubmed ↗