Sexually dimorphic gene expression responses of bovine embryos to the maternal microenvironment on day 13 of gestation
Dessie Salilew-Wondim, Ernst Tholen, Christine Große-Brinkhaus, Eva Held-Hoelker, Dennis Miskel, Franca Rings, Karl Schellander, Urban Besenfelder, Vitezslav Havlicek, Dawit Tesfaye, Michael Hoelker

TL;DR
This study shows that male and female bovine embryos respond differently to their mother's environment during early development, with distinct gene expression patterns linked to sex and maternal conditions.
Contribution
The study identifies novel sexually dimorphic gene expression patterns in bovine embryos at the initiation of elongation in response to maternal reproductive tract environments.
Findings
Male and female embryos developed in lactating cows showed differential expression of genes related to steroid biosynthesis and gastrulation.
Embryos in heifers exhibited sexually dimorphic gene expression linked to placental development and transmembrane transport.
A significant proportion of differentially expressed genes were located on the X chromosome, with most upregulated in female embryos.
Abstract
Various studies have highlighted significant differences in developmental kinetics and sensitivity to developmental conditions between male and female bovine embryos. These differences are thought to be caused in part by the sexually dimorphic expression of genes located on the sex or autosomal chromosomes. However, little is known about the dimorphic gene expression patterns of bovine embryos at the initiation of elongation, which is one of the critical stages of development. Furthermore, to the best of our knowledge, there is little or no data available on the sexually dimorphic gene expression patterns in bovine embryos in relation to maternal environmental conditions during the initiation of elongation. Therefore, the main objective of this study was to investigate the sexually dimorphic gene expression responses of embryos to the maternal environment at the initiation of elongation…
Genes, proteins, chemicals, diseases, species, mutations and cell lines named across the full text — each resolved to its canonical identifier and authoritative record.
Click any figure to enlarge with its caption.
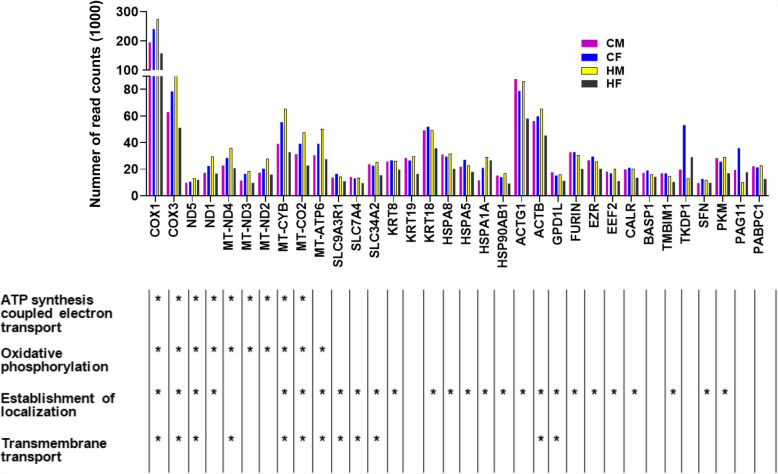 Figure 1
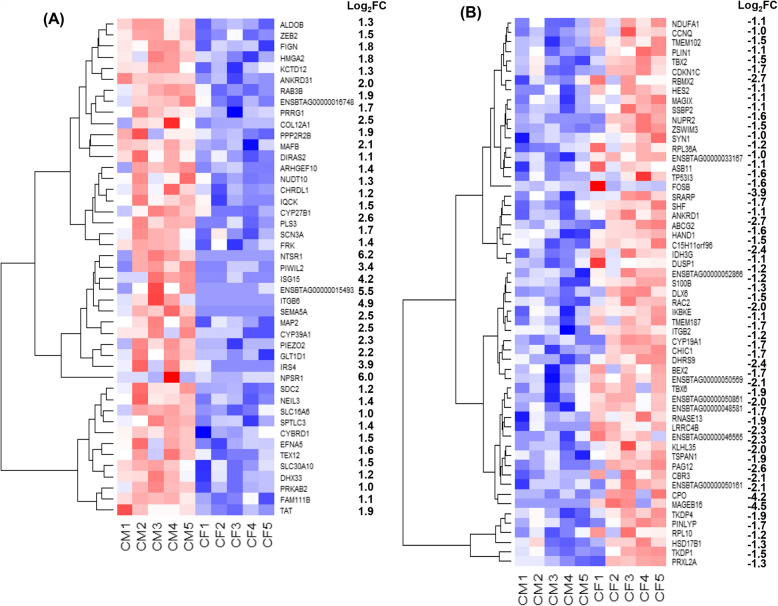 Figure 2
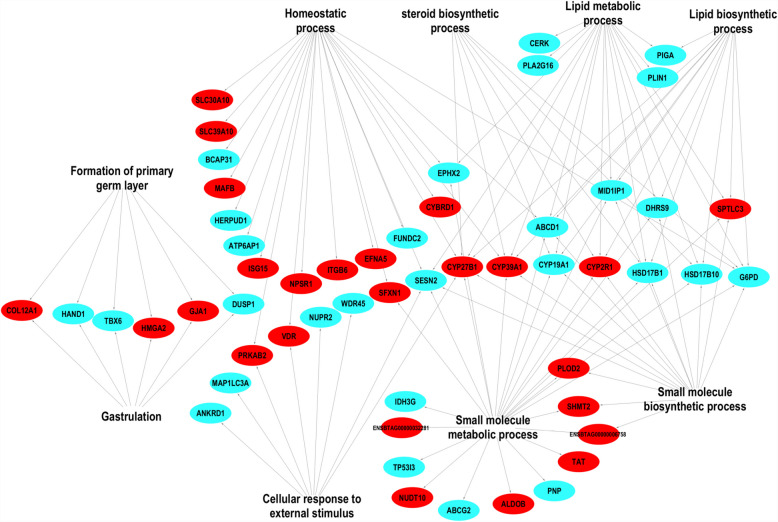 Figure 3
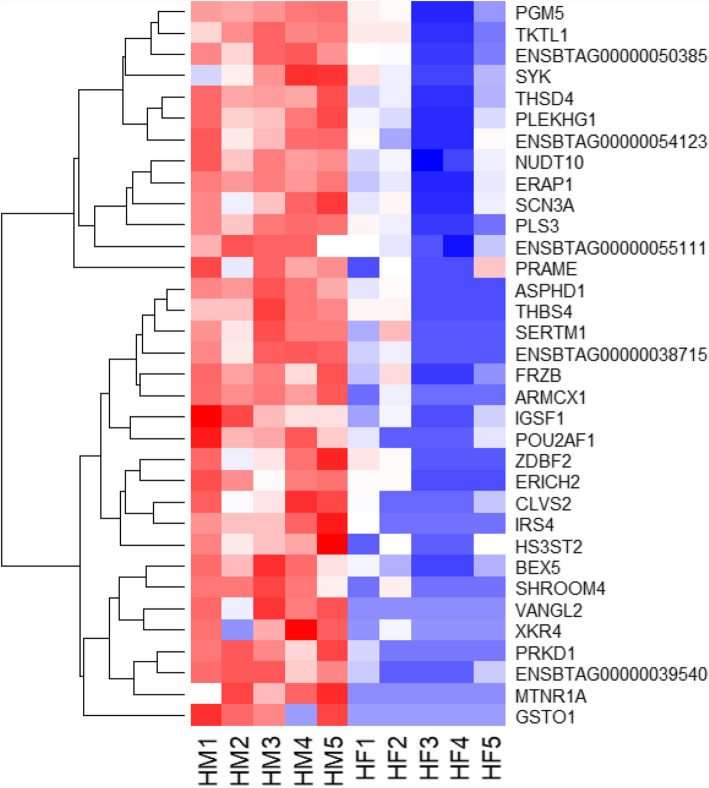 Figure 4
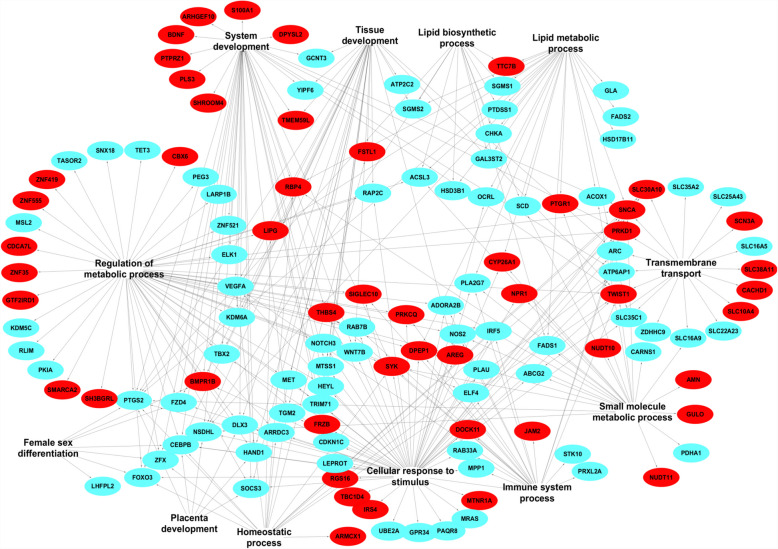 Figure 5
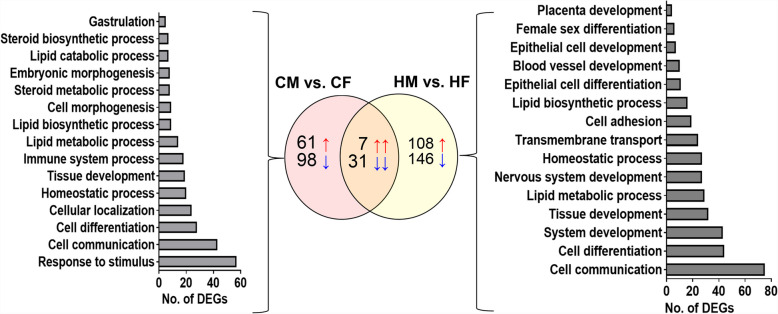 Figure 6
- —Rheinische Friedrich-Wilhelms-Universität Bonn (1040)
Peer Reviews
No public reviews on file for this paper yet. If you reviewed it on a platform where reviews are public (OpenReview, ICLR, NeurIPS, ICML), you can paste yours below so the community can read it here.
Videos
No videos yet. Explain this paper in a talk, walkthrough, or lecture? Add one.
Taxonomy
TopicsReproductive Physiology in Livestock · Reproductive Biology and Fertility · Genetic and phenotypic traits in livestock
Introduction
Although most sexual dimorphisms in embryos are expected to appear after gonadal differentiation, differences between male and female bovine embryos in their developmental kinetics and responses to environmental conditions [1–4] occur at the early stage of development prior to gonadal differentiation. For instance, sex specific difference in glucose metabolism was observed in day 7 embryos [5], and the supplementation of glucose in culture media promoted male embryos to cleave faster than female ones [6] and more male morula embryos to progress to advanced stages at a higher rate than the female ones [7, 8]. On the other hand, oxidative culture conditions reduced cell numbers and increased apoptotic cells in female blastocysts [9, 10]
Although tracing and identifying the relevant factors that contribute to the differences in the developmental kinetics and sensitivity to culture conditions of the male and female embryos is a focus of reproduction research, the sexually dimorphic expression of genes located on sex chromosomes or autosomes is believed to be one of the factors that contribute to these phenomena [4, 11–15]. For instance, the upregulation of glucose- 6-phosphate dehydrogenase (G6PDH) [8, 16, 17] and X inactive specific transcript (Xist) [17] has been shown in in vitro produced female blastocysts. Moreover, Forde et al. [18] have also indicated sexually dimorphic expression of several genes including those involved in cell cycle progression, DNA methylation and transcriptional repression signaling, and the mTOR signaling pathway in day 19 bovine embryos. Findings from that study were generated after analyzing fully in vivo derived bovine embryos at the initiation of implantation in one developmental environment (heifers). However, a comparison of in vitro produced day 2 embryos transferred into animals in different physiological conditions, in terms of their sexually dimorphic gene expression at the early elongation has not been performed.
In bovine embryos, the transformation of blastocysts from a spherical to a filamentous structure occurs around day 13 of gestation [19–21] and this period is crucial for in bovine embryonic developmental process [22] as it marks the initiation of embryo elongation [23]. Several genes associated with the transition from a spherical blastocyst to an ovoid conceptus or genes associated with the initiation of embryo elongation were expressed in day 13 embryos [23]. Around this period, the elongating embryo modulates the endometrium transcriptional activities in an embryo sex-specific manner [21]. However, information on sexually dimorphic gene expression patterns in day 13 embryos, which coincides with the initiation of elongation, is lacking. Thus, further study is needed to gain a better understanding of the sexually dimorphic gene expression patterns during this critical period. To the best of our knowledge, currently, there is little or no data available on the gene expression profiles of male and female embryos in relation to developmental conditions during the initiation of embryo elongation, particularly on day 13 of gestation. It is also unclear whether male and female embryos share common gene expression patterns during the initiation of elongation when they develop under different conditions. Moreover, embryo losses are more frequent in lactating postpartum cows than in nonlactating nulliparous heifers [24, 25]. Since the maternal reproductive tract environments are major players in determining developmental kinetics and embryo survival [26], the question arises whether the reproductive tract environment of a cow and heifer could differentially modulate the expression of genes in male and female embryos. Indeed, during development, the embryos are believed to respond to environmental stresses by modulating critical events including X chromosome inactivation [27] and switching off/on sex specific expression of transcriptional factors [10]. Therefore, these and other findings highlighted the need for further studies to understand whether the contrasting maternal environmental conditions can cause the male and female embryos to respond differently. This could be explained by analyzing the sexually dimorphic gene expression during the early elongation of embryos. Therefore, taking all these factors into account, we hypothesized that during the critical period of development, male and female embryos respond differently to the maternal environment through sex-specific modulation of their transcriptional activity. Therefore, the main objective of this study was to investigate the sexually dimorphic gene expression responses of bovine embryos to the maternal environment during the initiation of elongation. To achieve the objective of this study, we used two groups of embryos (male and female), and two groups of recipients: lactating Holstein Friesian dairy cows which are assumed to provide a less ideal or metabolically demanding maternal environment, and heifers which are thought to provide a nearly ideal developmental environment. Accordingly, we first identified the genes expressed in day 13 male and female embryos developed in lactating postpartum cows and nulliparous heifers. Secondly, we investigated the sexually dimorphic gene expression patterns in day 13 embryos developed in cows and heifers. Finally, we identified genes that showed sexually dimorphic expression patterns in day 13 embryos irrespective of the maternal reproductive tract microenvironment.
Materials and methods
Animal handling and management
Experimental animals (Holstein Frisian lactating cows and Holstein Frisian nulliparous heifers) were kept at the Frankenforst research station of the University of Bonn. Handling and management of experimental animals adhered to the rules and regulations of the German law of animal protection. The experiment involving animals was approved by the Animal Welfare (ethics) committee of the University of Bonn and the Federal Ministry of Food and Agriculture of Germany, with preposition number 84–02.04.20.2015.A083. For embryo sample collection, animals were slaughtered at a local slaughterhouse under the supervision of the responsible local veterinary office. Animals were first stunned with a bolt stunner prior to final slaughter.
In vitro production of male and female embryos, endoscopic tubal transfer of embryos, and recovery of day 13 embryos
In vitro maturation, in vitro fertilization, in vitro culture, tubal embryo transfer of day 2 embryos, recovery and classification of day 13 embryos have been described in detail in our previous publication [28]. Briefly, cumulus-oocyte complexes (COCs) were collected from slaughterhouse ovaries. After in vitro maturation, oocytes were divided into two groups and in vitro fertilized with X—or Y-chromosome-bearing sperm from the Holstein Frisian bull. In vitro fertilization was performed in Fert-TALP medium supplemented with 20 μM penicillamine, 10 μl PHE (Hypotaurine-Epinephrin-solution), 6 mg/ml BSA-FFA, 50 μg/ml gentamycin, and 10 μg/ml heparin. The final sperm concentration in fertilization droplets was adjusted to 2 × 10^6^ sperm/ml. After co-incubation of COCs with sperm cells for 18 h, the cumulus and sperm cells were removed. The two zygote groups (male and female) were then in vitro cultured in groups of 50 in 400 μl of synthetic oviductal fluid (SOF) supplemented with 0.6% fatty acid-free bovine serum albumin (BSA) under 5% O_2_, 5% CO_2_ and 39 °C until day 2. Afterwards, day 2 embryos were transferred to oestrus synchronized cows and heifers. For this purpose, Holstein Friesian heifers (n = 11) with no history of calving and lactating Holstein Friesian cows at 50–120 days postpartum (n = 10) in parity 1–2 were oestrus synchronized by two intramuscular administration of 500 mg of cloprostenol (Estrumate; Munich, Germany) at 11 days interval. Gonadotropin releasing hormone (GnRH) (Receptal; Intervet, Boxmeer, The Netherlands) was administered after each cloprostenol injection. Following this, lactating cows (n = 6) and heifers (n = 6) each received 20 female embryos, while other cows (n = 4) and heifers (n = 5) each received 20 male embryos using endoscopic embryo tubal transfer on day 2 of the oestrous cycle. Embryos were transferred unilaterally ipsilateral to the corpus luteum after careful observation using ultrasonography. Embryos were then recovered on day 13 of the gestation after slaughtering. The recovered embryos were then classified into four groups. Male and female embryos developed in lactating cows were classified as CM and CF groups, respectively, and male and female embryos developed in heifers were classified as HM and HF groups, respectively. All samples (CM, CF, HM, and HF) were initially snap frozen in liquid nitrogen and stored at − 80 ^O^C until further analysis.
RNA isolation from male and female embryos
Since this study is a continuation of our previous work, the RNA extraction method used for CM, CF, HM and HF samples has been described in our previous publication [28]. Briefly, the AllPrep DNA/RNA/miRNA universal kit was used to isolate total RNA from individual embryos. Each embryo was lysed in lysis buffer containing β-mercaptoethanol (1%) and passed through the QIAshredder (Qiagen) by centrifugation at maximum speed for 2 min. DNA was removed using the DNA spin column and protein was removed by incubating the flowthrough containing RNA with 50 μl proteinase K. The sample was then transferred to an RNeasy® Spin Column fitted with a 2 ml collection tube and centrifuged for 15 s. After sequential washes in 500 μl Buffer RPE and 500 μl of 96–100% ethanol, any remaining DNA was removed by performing on-column DNA digestion. After subsequent steps, total RNA was eluted in 35 μl RNase-free water. RNA quality was evaluated using Agilent 2100 bioanalyzer integrated with the RNA 6000 Nano LabChip® Kit (Agilent Technologies Inc, CA, USA). The amount of RNA was determined using a Nanodrop 8000 spectrophotometer (Thermo Fisher Scientific Inc, DE, USA). A total of 20 RNA samples (5 RNA samples per experimental group) with RNA integrity number (RIN) ≥ 6, A260/A280 = 1.8—2.2 and a total concentration of ≥ 500 ng were used for RNA sequencing.
Library preparation with polyA selection and Sequencing
RNA library preparation and sequencing were performed by Azenta Life Sciences (South Plainfield, NJ, USA). Briefly, prior to library preparation, sample RNA concentrations were quantified using the Qubit 2.0 Fluorometer (Life Technologies, Carlsbad, CA, USA), and RNA integrity was evaluated using the Agilent TapeStation 4200 (Agilent Technologies, Palo Alto, CA, USA). NEBNext Ultra II RNA Library Prep (NEB, Ipswich, MA, USA) was used to prepare the sequencing libraries. Briefly, the mRNAs were enriched with Oligod(T) beads, fragmented at 94 °C for 15 min, and then first- and second-strand cDNAs were synthesized. After end repair, the cDNA fragments were adenylated at the 3’ end, followed by universal adapter ligation, index addition and library enrichment by PCR. The library from each sample was then validated using the Agilent TapeStation (Agilent Technologies, Palo Alto, CA, USA) and quantified using the Qubit 2.0 Fluorometer (Invitrogen, Carlsbad, CA) and quantitative PCR (KAPA Biosystems, Wilmington, MA, USA). Libraries were clustered on the flowCell and loaded on the Illumina instrument (4000 or equivalent) following the manufacturer’s instructions. Sequencing was done in a paired-end (PE) configuration. Raw sequence data (.bcl files) were converted to fastq files and de-multiplexed using Illumina's bcl2fastq software (version 2.17). Raw and processed data RNA seq data are available in the NCBI repository: https://www.ncbi.nlm.nih.gov/geo/query/acc.cgi?acc=GSE276275.
Adapter trimming and sequence mapping to the bovine reference genome
The quality of the raw data was evaluated using FastQC, a freely available sequence analysis tool, (http://www.bioinformatics.babraham.ac.uk/publications.html). Adapters, PCR primers and non-informative sequences were removed from downstream analysis using trim galore software (Babraham Bioinformatics). Prior to mapping the reads, the bovine reference genome (Bos_taurus.ARS-UCD1.2) was indexed using bowtie2-build. Sequences were then mapped to the reference genome using the bowtie2 tool by setting paired-end and end-to-end read alignment parameters. The sequence alignment map (SAM) files from the read alignments were then converted to the binary alignment map (BAM) files and sorted using the Samtools command [29]. Sorted BAM files were used for downstream analysis.
Identification of expressed and differentially expressed genes
Sorted BAM files were imported into the Seqmonk tool (version 1.48.0, Babraham Bioinformatics). Reads with primary alignments and mapping quality ≥ 20 were imported. Quantitation was performed using the RNA-Seq pipeline option of Seqmonk. Following quantification, expressed genes in each sample were identified and annotated. Genes with read counts of 9500 or more were considered to be highly expressed genes.
Differential gene expression analysis was done using the edgeR Bioconductor package [30]. Briefly, library sizes were normalized between samples by applying a set of scaling factors using a trimmed mean of M values (TMM). Quantile-adjusted conditional maximum likelihood common dispersion and tagwise dispersion were estimated using the estimateDisp function. Finally, the mean expression differences between samples were tested using the exatTest function. Differentially expressed genes were screened based on absolute fold change ≥ 1.5, p-value < 0.05 and the false discovery rate (FDR) < 0.1.
Gene ontology enrichment analysis
Gene ontology enrichment analysis was performed using g:profiler tool [31], a web-based tool for functional enrichment analysis. Gene set enrichment analysis was performed by considering all known bovine genes. Significant gene set enrichments were filtered based on the Benjamini–Hochberg false discovery rate (FDR).
Cytoscape (version 3.10.0), a general-purpose modelling environment for integrating biomolecular interaction networks and states [32] was used to build a network between differentially expressed genes and biological processes. For this, a file containing biological processes and gene lists with their respective fold changes was prepared and imported into Cytoscape (version v3.10.0). Biological processes were designated as the sources. The height, width and transparency of the nodes were set to 100, 200, and 250, respectively. The fill colour of the upregulated and downregulated genes was set to red and sky, respectively. The networks were exported as images.
Results
Genes expressed in day 13 embryos
Embryo recovery rates including degenerated embryos on day 13 of gestation were 58.8%, 46.7%, 59.0%, and 59.2%, in the CM, CF, HM, and HF groups, respectively. Excluding degenerated embryos, the recovery rates were 42.5%, 15.0%, 28.0% and 26.7%, in CM, CF, HM and HF groups, respectively (Table 1). Table 1. The number of day 2 embryos transferred and day 13 embryo recovery ratesEmbryo groupRecipientNumber of embryos transferredTotal embryorecovery rate (%)Viable embryo recovery rate (%) MaleCow8058.842.5FemaleCow12046.715.020051.526.0MaleHeifer10059.028.0FemaleHeifer12059.226.722059.127.2Modified from Salilew-Wondim et al. [28]
A gene expression study was then performed in CM, CF, HM and HF groups disregarding the degenerated embryos. Accordingly, 40 RNA sequence data (20 reverse and 20 forward sequence data) with 150 bp paired-end sequences were generated from 20 libraries. Regarding read counts, on average, 22.3, 21.5, 22.5, and 22.1 million paired-end reads with 6.7, 6.5, 6.7, and 6.6 Giga bases of sequences with 51% GC content were generated in each biological replicate sample of CM, CF, HM, and HF, respectively. After adapter and non-informative sequence trimming, on average 6.2, 5.9, 6.2, and 6.2 Giga base sequences in CM, CF, HM and HF samples, respectively remained for downstream analysis. The average mapping rates in the CM, CF, HM, and HF groups were 72.1, 72.8, 73.2 and 73.2%, respectively.
Gene detection analysis indicated that 12,167, 12,021, 12,180, and 11,465 genes showed ≥ 5 read counts in the CM, CF, HM and HF groups, respectively. Including the mitochondrial genes (MT-ND4, MT-ND3, MT-ND2, MT-CYB, MT-CO2, MT-ATP6, COX3, COX1), keratins (KRT8, KRT18, KRT19), heat shock proteins (HSPA8, HSPA5, HSPA1 A, HSP90 AB1), 34 annotated genes showed relatively higher read counts (9500—274,090) in all embryo groups. Based on their read counts, these genes were considered to be the most highly expressed genes in the day 13 bovine embryos (Fig. 1). The highly expressed genes were involved in ATP synthesis coupled electron transport, oxidative phosphorylation, establishment of localization and transmembrane transport biological process (Fig. 1).Fig. 1. Expression patterns of the highly expressed genes and their functional characterization in day 13 male and female embryos developed in cows or heifers
Sexually dimorphic gene expression patterns in embryos developed in lactating postpartum cows
To explore the sexually dimorphic gene expression patterns in embryos developed in lactating cows, we compared the transcriptome profiles of the male (CM) and female (CF) embryos. The results showed that 197 genes were differentially expressed between these embryo groups, of which 68 DEGs showed increased expression, while 129 DEGs showed decreased expression in CM compared to CF (Figure S1). Among the DEGs, the expression levels of NTSR1, NPSR1, ITGB6, SEMA5 A, IRS4, ISG15, DIRAS2 and PIWIL2 were increased, whereas the expression levels of MAGEB16, CPO and FOSB were decreased by at least by 4 folds in CM compared to CF (Fig. 2). Moreover, the family of genes including cytochrome P450 (CYP2R1, CYP27B1, CYP39 A1) and solute carriers (SLC10 A4, SLC16 A1, SLC16 A6, SLC30 A10, SLC39 A10) were upregulated, while ribosomal proteins (RPL10, RPL36 A, RPL39) were downregulated in the CM compared to the CF embryo groups (Table 2). Gene enrichment analysis showed that genes differentially expressed between CM and CF were involved in gastrulation, steroid biosynthesis and metabolism, lipid metabolism, and homeostasis (Fig. 3).Fig. 2. Heatmap indicating the expression patterns of genes upregulated with a log_2_FC of ≥ 1 (A) or downregulated with a log_2_FC of ≤ − 1 (B) in the CM compared to the CF embryo group. The Red and blue colours indicate increased and decreased gene expression, respectively, in the CM compared to the CF group. CM1, CM2, CM3, CM4, and CM5 represent biological replicates in the CM embryo group and CF1, CF2, CF3, CF4, and CF5 represent biological replicates in the CF embryo group. Log_2_FC: log_2_ fold changeTable 2Differentially expressed gene families between CM and CF embryosGene symbolEnsembl gene idLog_2_ FCP valueFDRSLC10 A4ENSBTAG000000048880.74.98E- 050.015SLC16 A1ENSBTAG000000151070.65.12E- 040.072SLC16 A6ENSBTAG000000030741.07.69E- 050.019SLC30 A10ENSBTAG000000044141.54.41E- 050.014SLC39 A10ENSBTAG000000167820.77.73E- 040.090CYP19 A1ENSBTAG00000014890− 1.71.45E- 040.029CYP27B1ENSBTAG000000169061.54.15E- 040.064CYP2R1ENSBTAG000000104190.98.60E- 040.097CYP39 A1ENSBTAG000000036322.47.01E- 040.085RPL10ENSBTAG00000007454− 1.28.39E- 060.005RPL36 AENSBTAG00000019253− 1.02.67E- 040.049RPL39ENSBTAG00000049833− 0.95.45E- 050.016Log2* FC, log_2_ fold changes*Fig. 3. Biological processes enriched by differentially expressed genes between the CM and CF groups. Red and sky colors indicate increased and decreased gene expression, respectively
Sexually dimorphic gene expression patterns in day 13 embryos developed in heifers
To investigate the sexually dimorphic expression of genes in male and female embryos at the initiation of elongation in relation to the reproductive tract microenvironment of heifers, we analyzed the gene expression profiles of male (HM) and female (HF) embryos developed in heifers. The results showed that 115 and 177 genes were upregulated and downregulated, respectively in HM compared to the HF embryos (Figure S2). Among these, 34 DEGs including GSTO1, VANGL2, MTNR1 A, PRKD1, and ARMCX1 showed at least fourfold higher expression (Fig. 4), and 26 DEGs including NOS2, ARC, DHRS9, and PTGS2 showed at least fourfold lower expression in the HM compared to the HF group (Table 3). Moreover, gene families including glucosaminyl (N-acetyl) transferases, hydroxysteroids*,* solute carriers, ATPases, and zinc finger proteins were differentially expressed between the two embryo groups (Table 4). Gene enrichment analysis revealed that genes differentially expressed between these two groups of embryos were involved in tissue development, system development, female sex differentiation, placenta development, regulation of metabolic processes, and cellular response to stimulus (Fig. 5).Fig. 4. The expression patterns of genes significantly upregulated with a log_2_FC of ≥ 2 in HM compared to the HF embryo group. HM1, HM2, HM3, HM4, and HM5 represent biological replicates in the HM embryo groups and HF1, HF2, HF3, HF4, and HF5 represent biological replicates in the HF embryo group. Red and blue colours indicate increased and decreased gene expression, respectivelyTable 3List of genes downregulated by ≥ fourfold changes in HM compared to HFGene symbolEnsembl gene idLog_2_ FCP valueFDRHSD3B1ENSBTAG00000006769− 2.22.32E- 120.0000GPR34ENSBTAG00000020144− 2.02.25E- 120.0000SERPINE1ENSBTAG00000014465− 2.61.67E- 090.0000TKDP4ENSBTAG00000013950− 2.51.60E- 080.0000TBX2ENSBTAG00000014278− 2.78.58E- 080.0002PKD2L1ENSBTAG00000010742− 3.01.01E- 070.0002PTGS2ENSBTAG00000014127− 3.41.19E- 060.0011LARP1BENSBTAG00000012135− 2.02.03E- 060.0018ENSBTAG00000049445ENSBTAG00000049445− 2.12.23E- 060.0018PINLYPENSBTAG00000001260− 3.03.79E- 060.0025PAQR8ENSBTAG00000025494− 2.66.26E- 060.0033ENSBTAG00000039337ENSBTAG00000039337− 2.56.18E- 060.0033CDKN1 CENSBTAG00000031184− 2.36.92E- 060.0034RAB7BENSBTAG00000012774− 2.11.36E- 050.0058CAND2ENSBTAG00000015273− 2.22.85E- 050.0105STK10ENSBTAG00000017457− 2.63.48E- 050.0116DHRS9ENSBTAG00000004557− 3.73.92E- 050.0126NOS2ENSBTAG00000006894− 5.56.95E- 050.0183CNR2ENSBTAG00000019371− 2.58.44E- 050.0210C15H11orf96ENSBTAG00000045822− 2.29.72E- 050.0225ARCENSBTAG00000021639− 3.91.30E- 040.0261TCHHL1ENSBTAG00000015854− 2.61.96E- 040.0343ABCG2ENSBTAG00000017704− 2.02.25E- 040.0372ENSBTAG00000053661ENSBTAG00000053661− 6.64.79E- 040.0599PLA2G7ENSBTAG00000019315− 2.48.85E- 040.0807ENSBTAG00000052396ENSBTAG00000052396− 3.19.38E- 040.0837Log2* FC, log_2_ fold changesTable 4. Differentially expressed gene families between HM and HF embryosGene symbolEnsembl gene idLog_2_ FCP valueFDRZNF555ENSBTAG000000083971.61.14E- 030.095ZNF521ENSBTAG00000007383− 1.61.07E- 040.023ZNF419ENSBTAG000000176130.96.62E- 040.072ZNF35ENSBTAG000000340051.07.22E- 040.073SLC48 A1ENSBTAG00000032331− 0.92.10E- 040.035SLC38 A11ENSBTAG000000076501.53.74E- 060.003SLC35 C1ENSBTAG00000003199− 1.39.91E- 060.005SLC35 A2ENSBTAG00000002768− 0.71.05E- 030.090SLC30 A10ENSBTAG000000044141.61.22E- 030.097SLC2 A4ENSBTAG000000091901.03.22E- 040.047SLC25 A43ENSBTAG00000001007− 0.82.31E- 040.037SLC22 A23ENSBTAG00000010943− 1.05.77E- 040.066SLC16 A9ENSBTAG00000019792− 1.25.62E- 040.065SLC16 A5ENSBTAG00000001110− 1.33.70E- 040.050SLC10 A4ENSBTAG000000048881.41.09E- 040.024SLC10 A3ENSBTAG00000014333− 1.03.40E- 050.012SLC10 A1ENSBTAG00000001881− 1.58.27E- 070.001RAB9 AENSBTAG00000010923− 0.73.65E- 040.049RAB7BENSBTAG00000012774− 2.11.36E- 050.006RAB33 AENSBTAG00000034712− 1.33.26E- 060.002NUDT11ENSBTAG000000052521.64.96E- 040.060NUDT10ENSBTAG000000543832.28.83E- 070.001MYO1BENSBTAG00000011256− 0.74.56E- 040.058MYH14ENSBTAG000000025801.01.11E- 030.093KDM6 AENSBTAG00000003740− 1.01.16E- 060.001KDM5 CENSBTAG00000014943− 0.61.21E- 040.025HSD3B1ENSBTAG00000006769− 2.22.32E- 120.000HSD17B12ENSBTAG00000000087− 0.97.05E- 040.073HSD17B11ENSBTAG00000006307− 0.71.51E- 040.029GCNT4ENSBTAG00000050091− 1.21.12E- 040.024GCNT3ENSBTAG00000009443− 1.41.72E- 060.002FADS2ENSBTAG00000015505− 1.13.51E- 060.002FADS1ENSBTAG00000022294− 1.06.83E- 040.073COL4 A5ENSBTAG000000145751.72.76E- 040.041COL18 A1ENSBTAG000000239070.87.15E- 040.073ATP6 AP2ENSBTAG00000017801− 0.76.80E- 040.073ATP6 AP1ENSBTAG00000012117− 0.62.86E- 040.042ATP2 C2ENSBTAG00000000945− 1.14.95E- 040.060ATP13 A4ENSBTAG000000163050.98.97E- 040.081ARMCX2ENSBTAG000000194171.98.53E- 050.021ARMCX1ENSBTAG000000261393.78.45E- 070.001Log_2_ FC, log_2_ fold changes*Fig. 5. Biological processes enriched by differentially expressed genes between HM and HF. Red and sky colors indicate the upregulated and downregulated genes, respectively, in HM compared to HF
Sexually dimorphic gene expression in day 13 embryos due to the reproductive tract environment of lactating cows
After analyzing sexually dimorphic gene expression in embryos developed in cows or heifers, we identified genes that showed sexually dimorphic expression exclusively in embryos developed in cows using Venny 2.1 software, which compares various lists with Venn diagrams (https://bioinfogp.cnb.csic.es/tools/venny/). The result showed that 159 genes were differentially expressed exclusively between CM and CF, but not between HM and HF (Fig. 6, Table S1). Of these, 61 genes including CYP39 A1, CYP2R1 and CYP27B1 were upregulated, whereas 98 genes including HSD17B1, HSD17B10 and aromatase (CYP19 A1) were downregulated in CM embryo groups (Table S1). Moreover, 31.2% of those DEGs (Figure S3 A) including glucose- 6-phosphate dehydrogenase (G6PD) were located on the X chromosome (Table S1) and, except two genes, all DEGs located on the X chromosome were downregulated in the CM group compared to the CF group, or, upregulated in the CF group compared to the CM group. In silico functional characterization showed that genes that showed sexually dimorphic expression exclusively between male and female embryos developed in cows CM and CF were involved in steroid biosynthesis and metabolism, gastrulation, homeostasis, immune system, and lipid biosynthesis and metabolism (Fig. 6).Fig. 6. Exclusively differentially expressed genes in CM vs. CF or HM vs. HF comparisons, and genes differentially expressed in both comparisons. The numbers in the circles indicate the number of differentially expressed genes and the upward arrow (↑) and downward arrow (↓) next to each number indicate the upregulation and downregulation of genes, respectively, in CM vs. CF or HM vs. HF. DEGs: Differentially expressed genes
Sexually dimorphic gene expression in day 13 embryos due to the reproductive tract environment of heifers
Using a similar approach to that used in embryos developed in cows, genes that exhibited sexually dimorphic expression solely due to the reproductive tract environment of heifers were identified. The result showed that 254 genes were differentially expressed exclusively between HM and HF (Fig. 6). Among these, 108 genes (57.8% of DEGs) including SLC2 A4, SLC38 A11, HSD17B11, HSD17B12, and HSD3B1 were upregulated and 146 genes (42.2% of DEGs) including SLC10 A1, SLC10 A3, SLC16 A5, SLC16 A9, SLC22 A23, SLC25 A43, SLC35 A2, SLC35 C1 and SLC48 A1 were downregulated in HM embryos (Table S2). Interestingly, including 33 downregulated genes in HM, (or conversely upregulated in HF embryos), 17.3% of the DEGs were located on the X chromosome (Figure S3B). Gene enrichment analysis revealed that genes that showed sexually dimorphic expression exclusively in embryos developed in heifers were involved in various biological processes, including female sex differentiation, developmental processes (in placenta development, nervous system development, blood vessel development, epithelium development and differentiation), and cell adhesion (Fig. 6).
Sexually dimorphic gene expression patterns in day 13 embryos irrespective of the maternal reproductive tract environment
Genes that showed sexually dimorphic expression in embryos irrespective of the maternal environment were identified by filtering those that exhibited sexually dimorphic expression in both cow and heifer embryos using Venny 2.1 software. Accordingly, only 38 genes were commonly differentially expressed in CM vs. CF as well as in HM vs. HF (Fig. 6). Of these, 7 genes (IRS4, PLS3, SCN3 A, NUDT10, SLC30 A10, SLC10 A4 and ARHGEF10) were upregulated and 31 genes including DHRS9, TKDP4, TKDP1, CDKN1 C, SRARP and TBX2, were downregulated in CM compared to CF as well as in HM compared to HF embryos (Table 5). Furthermore, the chromosomal analysis revealed that 18 of the 38 DEGs were located on the X chromosome, and 16 DEGs located on the X chromosome were upregulated in female embryos. Table 5. The upregulated (↑) or downregulated (↓) genes in both CM vs. CF and HM vs. HF comparisonsCM vs. CFHM vs. HFGene symbolEnsembl gene idChrP valueFDRExpression patternsP valueFDRExpression patternsIRS4ENSBTAG00000006535X < 0.0010.025↑ < 0.0010.021↑PLS3ENSBTAG00000011613X < 0.0010.000↑ < 0.0010.000↑SCN3 AENSBTAG0000001938520.0010.094↑ < 0.0010.003↑SLC30 A10ENSBTAG0000000441416 < 0.0010.014↑0.0010.097↑NUDT10ENSBTAG00000054383X < 0.0010.060↑ < 0.0010.001↑ARHGEF10ENSBTAG0000000858527 < 0.0010.068↑0.0010.093↑SLC10 A4ENSBTAG000000048886 < 0.0010.015↑ < 0.0010.024↑TIMM8 AENSBTAG00000022292X < 0.0010.018↓0.0010.091↓ATP6 AP1ENSBTAG00000012117X < 0.0010.013↓ < 0.0010.042↓KDM5 CENSBTAG00000014943X < 0.0010.003↓ < 0.0010.025↓DNASE1L1ENSBTAG00000007455X < 0.0010.061↓ < 0.0010.012↓ENSBTAG00000022275ENSBTAG000000222751 < 0.0010.001↓ < 0.0010.008↓MOSPD2ENSBTAG00000018292X < 0.0010.087↓ < 0.0010.024↓RAB9 AENSBTAG00000010923X < 0.0010.001↓ < 0.0010.049↓ENSBTAG00000005239ENSBTAG000000052392 < 0.0010.001↓ < 0.0010.049↓TRAPPC2ENSBTAG00000010922X < 0.0010.010↓ < 0.0010.001↓ATP2 C2ENSBTAG00000000945180.0010.081↓ < 0.0010.060↓RAB33 AENSBTAG00000034712X < 0.0010.058↓ < 0.0010.002↓IKBKGENSBTAG00000006268X < 0.0010.000↓ < 0.0010.014↓RNF113 AENSBTAG00000006034X < 0.0010.014↓ < 0.0010.016↓ABHD4ENSBTAG0000001665810 < 0.0010.007↓ < 0.0010.035↓LAS1LENSBTAG00000002210X < 0.0010.000↓0.0010.065↓MPP1ENSBTAG00000013046X < 0.0010.000↓0.0010.073↓PIGAENSBTAG00000007646X < 0.0010.082↓0.0010.073↓ENSBTAG00000052866ENSBTAG000000528663 < 0.0010.044↓0.0010.087↓SYN1ENSBTAG00000005042X < 0.0010.020↓ < 0.0010.029↓PRXL2 AENSBTAG0000002141628 < 0.0010.057↓0.0010.075↓HAND1ENSBTAG000000023357 < 0.0010.016↓ < 0.0010.000↓TKDP1ENSBTAG0000001812213 < 0.0010.022↓ < 0.0010.009↓TBX2ENSBTAG0000001427819 < 0.0010.010↓ < 0.0010.000↓TMEM102ENSBTAG0000003173719 < 0.0010.000↓ < 0.0010.000↓ABCG2ENSBTAG000000177046 < 0.0010.027↓ < 0.0010.037↓SRARPENSBTAG000000109382 < 0.0010.003↓ < 0.0010.006↓PINLYPENSBTAG0000000126018 < 0.0010.018↓ < 0.0010.003↓CDKN1 CENSBTAG0000003118429 < 0.0010.013↓0.0000.003↓TKDP4ENSBTAG0000001395013 < 0.0010.003↓0.0000.000↓C15H11orf96ENSBTAG0000004582215 < 0.0010.001↓0.0000.023↓DHRS9ENSBTAG000000045572 < 0.0010.002↓0.0000.013↓
Discussion
Sexually dimorphic gene expression in day 13 embryos was influenced by the maternal environment
In the current study, the sexually dimorphic gene expression in embryos developed in lactating cows and nonlactating nulliparous heifers on day 13 of gestation was investigated. Although the metabolic status of these animals was not explicitly examined, it is reasonable to assume that these groups of animals differed at least in their metabolic status. Nonlactating heifers represent nearly an ideal reproductive tract environment for embryo development, whereas lactating cows serve as a model of an unfavourable and metabolically demanding maternal environment. Thus, a detailed understanding of the molecular responses of male and female embryos to the reproductive tract microenvironment of lactating cows and nonlactating nulliparous heifers provides insights into sex-specific developmental programming that occurs due to differences in developmental conditions. Accordingly, in the current study, while 159 and 254 genes showed sexually dimorphic expression exclusively in embryos developed in lactating cows and nonlactating nulliparous heifers, respectively, only 38 genes showed sexually dimorphic expression patterns in both embryo groups (Fig. 6). These results suggest that the sexually dimorphic gene expression in day 13 embryos may be influenced more by the maternal environment (developmental conditions) than by intrinsic gender differences. However, further study may be needed to confirm this claim.
It may be possible to speculate that genes that showed sexually dimorphic expression exclusively in embryos developed in heifers represent a set of genes that normally show differential expression patterns between male and female embryos when development occurs in a favourable environment. Meanwhile, those genes that showed sexually dimorphic expression patterns exclusively in embryos developed in cows may represent a set of genes whose expression in male and female embryos is influenced by suboptimal developmental conditions. Consistent with these findings, a previous study also identified sexually dimorphic expression of 254, 54 and 37 genes in embryos developed in vivo, serum-containing media, and serum-free in vitro culture media, respectively [15]. This may also indicate that sexually dimorphic gene expression in embryos may be regulated more by developmental (culture) conditions than by the sex of the embryo. Moreover, a comparative analysis of our results, specifically those obtained from embryos developed in heifers, with the results reported by Forde et al. [18], who investigated the sexually dimorphic expression in day 19 conceptuses developed in crossbred beef heifers, indicated that both studies had 21 genes in common. Among these, 4 genes including ADAMTS19 were upregulated and 8 genes including DLX3, SLC10 A3, and SLC35 C1 were downregulated in male embryos (Table 6), suggesting that the sexually dimorphic expression trend of these genes may remain similar both in day 13 and day 19 bovine embryos. Table 6. Upregulated or downregulated genes in male compared to female embryos in both day 13 and day 19 embryosEnsembl gene idGene symbolGene descriptionChrMale vs. Female embryosCurrentstudyForde et al*.* [18]ENSBTAG00000011613PLS3Plastin 3X↑↑ENSBTAG00000054383NUDT10Nudix (nucleoside diphosphate linked moiety X)-type motif 10X↑↑ENSBTAG00000033803FABP7fatty acid binding protein 79↑↑ENSBTAG00000016145ADAMTS19ADAM metallopeptidase with thrombospondin type 1 motif 197↑↑ENSBTAG00000010587SH3BGRLSH3 domain binding glutamate rich protein likeX↑↑ENSBTAG00000023652PROS1protein S1↑↑ENSBTAG00000017409DLX3Distal-less homeobox 319↓↓ENSBTAG00000016085IRAK1Interleukin 1 receptor associated kinase 1X↓↓ENSBTAG00000012117ATP6 AP1ATPase H + transporting accessory protein 1X↓↓ENSBTAG00000019061ELF4E74 like ETS transcription factor 4X↓↓ENSBTAG00000014333SLC10 A3Solute carrier family 10 member 3X↓↓ENSBTAG00000005042SYN1Synapsin IX↓↓ENSBTAG00000048365WNT7BWnt family member 7B5↓↓ENSBTAG00000003199SLC35 C1Solute carrier family 35 member C115↓↓ENSBTAG00000031737TMEM102Transmembrane protein 10219↓↓ENSBTAG00000017690CARNS1Carnosine synthase 129↓↓ENSBTAG00000015273CAND2Cullin associated and neddylation dissociated 2 (putative)22↓↓ENSBTAG00000045989CDC42EP5CDC42 effector protein 518↑↓ENSBTAG00000002683PFKPPhosphofructokinase, platelet13↑↓ENSBTAG00000015630RLIMRing finger protein, LIM domain interactingX↓↑ENSBTAG00000017258ACSL3Acyl-CoA synthetase long chain family member 32↓↑ENSBTAG00000022292TIMM8 ATranslocase of inner mitochondrial membrane 8 AX↓↑ENSBTAG00000006307HSD17B11Hydroxysteroid 17-beta dehydrogenase 116↓↑ENSBTAG00000013957GALNT3Polypeptide N- acetylgalactosaminyltransferase 32↓↑ENSBTAG00000021751RASEFRAS and EF-hand domain containing8↓↑ENSBTAG00000007646PIGAPhosphatidylinositol glycan anchor biosynthesis class AX↓↑ENSBTAG00000050091GCNT4Glucosaminyl (N-acetyl) transferase 410↓↑ENSBTAG00000016805SGMS2Sphingomyelin synthase 26↓↑Symbols ↑ and ↓ indicate increased and decreased gene expression levels in male compared to female embryos, respectively
Interestingly, in the current study, 31.2% and 17.3% of the genes that showed sexually dimorphic expression exclusively in embryos developed in cows and heifers respectively, were located on the X chromosome (Figure S3 A & Figure S3B), and when all genes that showed sexually dimorphic expression in embryos of cow and heifers were considered, these proportions increased to 36% and 21%, respectively. Previous studies also reported that 2.7% (n = 139) of genes that showed sexually dimorphic expression in day 19 of bovine embryos [18] and 7.1% (n = 163) of genes that showed sexually dimorphic expression in the blastocysts developed in SOF media supplemented with 5% FCS [11] were located on the X chromosome. In our study, 96% and 75% of the genes on the X chromosome which showed sexually dimorphic expression in cow and heifer embryos, respectively, were upregulated in female embryos (Table S1, Table S2). This phenomenon may be partly related to incomplete X chromosome inactivation in female embryos. The presence of a double X chromosome in females could lead to sexual dimorphism by affecting the transcriptional levels of genes encoded by sex chromosomes and/or autosomal chromosomes [11]. Thus, based on the results of the current study, it could be speculated that X chromosome inactivation was not yet fully completed at the initiation of elongation around day 13 in bovine embryos. Moreover, the results of the present study may suggest that X chromosome inactivation might differ depending on the developmental environment. Considering the higher proportion of genes that exhibited sexually dimorphic expression on the X chromosome in embryos developed in lactating cows compared to those developed in heifers, it can be suggested that X chromosome inactivation in embryos developed in cows may be less effective compared to those developed in heifers. The effect of environmental conditions on the dosage compensation of X-linked genes as evidenced in bovine female preimplantation embryos [16] and the impaired X-chromosome inactivation due to suboptimal developmental conditions may affect the embryo viability leading to skewed sex ratios [33].
Genes that showed sexually dimorphic expression patterns in day 13 embryos due to reproductive tract environment lactating cows were involved in steroid biosynthesis and metabolism
In addition to examining the genes that showed sexually dimorphic expression patterns in day 13 embryos, we also investigated the function of those genes by performing gene ontology enrichment analysis and literature mining. Accordingly, we identified key functional differences in embryos developed in cows or developed in heifers. For instance, steroid biosynthesis and metabolism was one of the biological processes enriched by genes that showed sexually dimorphic expression exclusively in embryos developed in lactating cows (Figs. 3 and 6). These genes include the aromatases (CYP19 A1), HSD17B1, HSD17B10, CYP39 A1, CYP2R1 and CYP27B1 (Fig. 3). Previous studies indicated that aromatase (CYP19 A1), which is involved in the conversion of androgens to estradiol [34], showed female-specific expression patterns during bovine pregnancy [35] and this gene is required for sex differentiation during embryonic development [36]. Similarly, HSD17B1 is involved in the conversion of estrone and estradiol or androstenedione and testosterone or vice-versa [37–39]. In fact, steroids are involved in embryo growth, embryo-maternal signalling and communication [40] and successful pregnancy establishment, see review [41]. The amount and availability of steroid hormones during pregnancy can be modulated by factors such as stress, which can ultimately lead to a reduction in various hormones during pregnancy [42]. This may be more relevant in lactating postpartum cows, as many high-yielding dairy cows may experience metabolic stress during early lactation. During the early stages of lactation, the majority of high yielding dairy cows enter to negative energy balance (NEB) and during this period, various metabolites including ketone bodies, ß-hydroxybutyrate and non-esterified fatty acids (NEFA) can be released into the circulation of the cow [43]. Higher concentrations of these metabolites may ultimately disturb the microenvironment of the reproductive tract and greatly affect the expression of steroidogenesis genes in embryos. Therefore, sexually dimorphic expression of key genes which were involved in steroidogenesis only in embryos developed in cows may provide a clue about the presence of sexual dimorphism in the steroidogenesis activity of cow embryos.
Genes that showed sexually dimorphic expression patterns in day 13 embryos due to the lactating reproductive tract environment of cows were involved in the gastrulation
Gastrulation is believed to be a key step in the process of embryo development. In bovine, the embryonic ectoderm appears around day 13 of gestation followed by the formation of two additional layers (mesoderm and endoderm) by days 14–15 [44]. In line with this, in the current study genes that were involved in gastrulation, namely TBX6, DUSP1, GJA, HMGA2, and COL12 A1 showed sexually dimorphic expression patterns only in embryos developed in cows but not in embryos developed in heifers (Fig. 3, Table S1). The first two genes were upregulated in the male embryos and the latter three were upregulated in the female embryos. Apart from gene enrichment analysis, results from previous studies have also highlighted the role of these genes in gastrulation processes. For instance, the importance of T-box transcription factor 6 (TBX6) in mesoderm specification and function [45–47], DUSP1 in germ layer specification [48], and gap junction protein alpha 1 (GJA1), also known as connexin 43 (CX43), in gastrulation processes [49] have been described. Thus, sexually dimorphic expression of these genes exclusively in embryos developed in cows may suggest the presence of sex specific gastrulation activities by male and female embryos in a cow’s reproductive tract environments. Indeed, earlier studies in mice have reported that the duration of in vitro culture strongly affected X chromosome inactivation in the primitive endoderm of mice [50]. Although caution should be taken, this may also indicate the existence of a direct link between developmental environment conditions and the successful germ layer establishment during the gastrulation processes.
Genes that showed sexually dimorphic expression patterns in day 13 embryos due to the reproductive tract environment of heifers were associated with female sex differentiation
Sexual differentiation is one of the fundamental developmental processes that lead to the development of male or female phenotypes from undifferentiated embryonic structures [51]. This process is governed by sex-specific actions of gene networks, ultimately resulting in the conversion of the bipotential gonads of the growing fetus into either testis or ovaries [52]. In the current study, some genes associated with female sex differentiation, namely, FZD4, FOXO3, BMPR1B, CEBPB, PTGS2 and LHFPL2 showed sexually dimorphic expression patterns only in embryos developed in heifers (Fig. 5, Table S2). These genes except BMPR1B were downregulated in male embryos. Previous studies also indicated the role of frizzled class receptor 4 (FZD4) in gonad differentiation [53], forkhead box O3 (FOXO3) in ovarian development [54], bone morphogenetic protein receptor type 1B (BMPR1B) in germ-cell differentiation [55], and LHFPL tetraspan subfamily member 2 (LHFPL2) in distal reproductive tract development [56]. Thus, the sexually dimorphic expression of genes associated with female sex differentiation in the embryos of heifers may indicate normal gonadal differentiation programming in developing embryos. In fact, these genes did not show sexually dimorphic expression patterns in embryos developed in cows, which may be affected by lactation and metabolic stress. However, we cannot rule out the presence of normal sexual gonadal differentiation in embryos developed in cows, as we have no experimental evidence to support the critical role of these genes on sex differentiation in bovine. Since the current study was limited to day 13 of gestation, further studies may be necessary to investigate the crucial role of these genes in gonadal differentiation and embryo development beyond day 13 of gestation.
Genes that showed sexually dimorphic expression patterns in day 13 embryos due to the reproductive tract environment of heifers were involved in transmembrane transport
Several genes associated with transmembrane transport, such as GLUT4 (SLC2 A4) and ten solute carrier gene families (SLC16 A9, SLC10 A1, SLC10 A3, SLC16 A5, SLC22 A23, SLC25 A43, SLC35 A2, SLC35 C1, SLC38 A11 and SLC48 A1) showed sexually dimorphic expression patterns exclusively in embryos developed in heifers (Fig. 5, Table S2). Indeed, the amount and type of solutes that enter and leave a cell are regulated by the complex interactions between the membrane and macromolecules such as carbohydrates, proteins, and lipids [57]. For instance, SLC2 A4 (GLUT4) is involved in glucose transport [58], glucose uptake, and glucose homeostasis [59]. Malfunctioning of GLUT4 is believed to impair embryo implantation [60].
Apart from GLUT4, solute carriers involved in monocarboxylate cotransporter (SLC16 A9) [61], sodium bile salt cotransport (SLC10 A1 & SLC10 A3) [62], monocarboxylate transport (SLC16 A5) [61], molecule transport across the mitochondria membrane (SLC22 A23 & SLC25 A43) [63], nucleotide sugars transport (SLC35 A2, SLC35 C1) [64], sodium-coupled neutral amino acids transport (SLC38 A11) [65], and heme transport (SLC48 A1) [65, 66]], showed sexually dimorphic expression patterns only in embryos developed in heifers. Interestingly, with the exception of two genes (SLC2 A4 and SLC38 A11), all those solute carriers were downregulated in male embryos suggesting that male and female embryos seem to respond to the reproductive tract environment by expressing genes associated with memebrane transport in a sex specific manner.
Similarly, gene set enrichment analysis indicated that genes that exhibited sexually dimorphic expression patterns exclusively in embryos developed in heifers, namely CCAAT/enhancer-binding protein beta (CEBPB), prostaglandin-endoperoxide synthase (PTGS2), distal-less homeobox 3 (DLX3), and NAD(P) dependent steroid dehydrogenase-like (NSDHL), were involved in placenta development. Literature mining also indicated that CEBPB, one of the key genes expressed in trophoblasts, is involved in extravillous trophoblasts function [67] and DLX3, a homeodomain-containing transcription factor, is involved in normal placental morphogenesis [68] and regulation of villous cytotrophoblast differentiation [69]. Similarly, the X-linked genes, NSDHL and COX- 2 (PTGS2), are also associated with normal placental development [70, 71].
Genes that showed sex specific expression patterns in day 13 embryos irrespective of the maternal environment
In addition to genes that showed sexually dimorphic expression patterns exclusively in embryos developed in cows and heifers, we have also sought to identify genes that showed sexually dimorphic expression patterns due to the sex of the embryos. In theory, it appears challenging to identify genes that are inherently regulated by the sex of the embryo or by the developmental conditions. Since the present study contrasted two maternal environments and two sexes, the experimental design feasibly identifies genes that exhibit sexually dimorphic expression patterns either due to the maternal environment or embryo sex. In fact, in the absence of the influence of the maternal environment, one could expect the same genes to show sexually dimorphic expression patterns in both embryos developed in cows and embryos developed in heifers. However, the current study found only 38 genes that showed sexually dimorphic expression patterns in embryos of cows and heifers (Fig. 6, Table 5). These genes represented only 19% and 13% of all genes that exhibited sexually dimorphic expression patterns in embryos of cows and heifers, respectively. These genes may represent a set of highly conserved sexually dimorphic genes whose expression in embryos is not affected by the maternal environment. We speculate that the expression patterns of these genes in embryos depend on the sex of the embryo rather than on the maternal environment. Besides, the expression trends of these genes showed that 31 out of genes including IRS4, PIGA, TRAPPC2 and KDM5 C were upregulated in the female embryos of cows and heifers and 16 out of 38 genes (42.1%) were located on the X-chromosome.
Conclusion
In the current, while 159 and 254 genes showed sexually dimorphic expression patterns exclusively in embryos developed in cows and heifers, respectively, only 38 genes showed sexually dimorphic expression patterns in both cow and heifer embryos. Genes that showed sexually dimorphic expression patterns in both cow and heifer embryos may represent genes regulated by the sex of the embryos not by the maternal reproductive tract microenvironment. Genes that showed sexually dimorphic expression patterns exclusively in embryos developed in lactating cows may represent those genes whose expression may be altered in male or female embryos due to a suboptimal maternal environment. These genes were involved in various functions including steroid biosynthesis and gastrulation. On the other hand, genes that showed sexually dimorphic expression patterns only in embryos developed in heifers may represent gene sets that can be expressed differently in male and female embryos only when development takes place in a favourable environment. These genes were involved in various functions including female sex differentiation, placental development and transmembrane transport. In addition, a higher proportion of genes that showed sexually dimorphic expression patterns in cow embryos were located on the X chromosome and the majority of these were upregulated in female embryos. Overall, the current study identified several genes that exhibit sexually dimorphic expression patterns in day 13 bovine embryos as a result of the maternal reproductive tract microenvironment or solely due to the embryo sex.
Supplementary Information
Supplementary Material 1.
The reference list from the paper itself. Each links out to its DOI / PubMed record.
- 1Heras S, De Coninck, Dieter I M, van Poucke M, Goossens K, Bogado Pascottini O, van Nieuwerburgh F, Deforce D, Sutter P de, Leroy, Jo L M R, Gutierrez-Adan A, Peelman L, van Soom A. Suboptimal culture conditions induce more deviations in gene expression in male than female bovine blastocysts. BMC Genomics. 2016;17:72. 10.1186/s 12864-016-2393-z.10.1186/s 12864-016-2393-z PMC 472412626801242 · doi ↗ · pubmed ↗
- 2Danecek P, Bonfield JK, Liddle J, Marshall J, Ohan V, Pollard MO, Whitwham A, Keane T, Mc Carthy SA, Davies RM, Li H. Twelve years of SA Mtools and BC Ftools. Giga Science. 2021;10:giab 008. 10.1093/gigascience/giab 008.10.1093/gigascience/giab 008PMC 793181933590861 · doi ↗ · pubmed ↗
- 3Aatsha PA, Arbor TC, Krishan K. Embryology, Sexual Development in Stat Pearls. Treasure Island (FL): Stat Pearls; 2023. https://www.ncbi.nlm.nih.gov/books/NBK 557601/.32491533 · pubmed ↗