Correction: LncRNA HAGLR silencing inhibits IL‑1β‑induced chondrocytes inflammatory injury via miR‑130a‑3p/JAK1 axis
Yunzhou Zuo, Changjun Xiong, Xuewen Gan, Wei Xie, Xiaokang Yan, Yanzhao Chen, Xugui Li

Abstract
Genes, proteins, chemicals, diseases, species, mutations and cell lines named across the full text — each resolved to its canonical identifier and authoritative record.
Click any figure to enlarge with its caption.
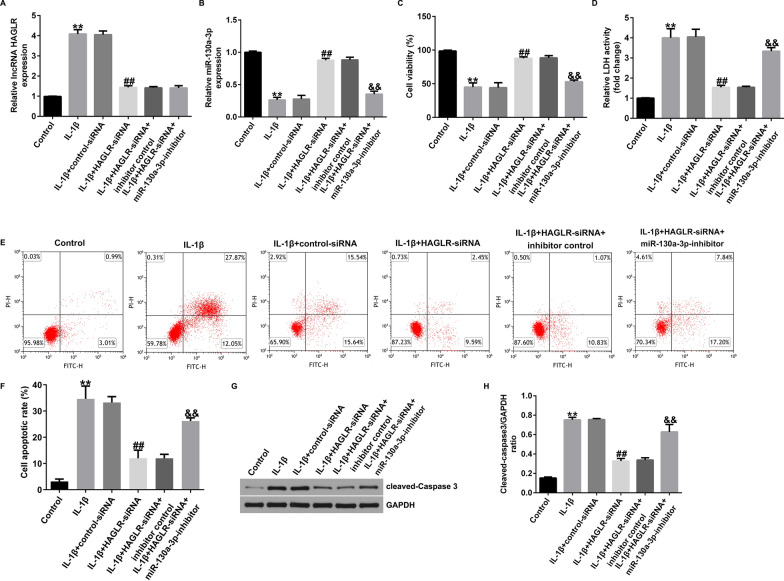 Figure 4
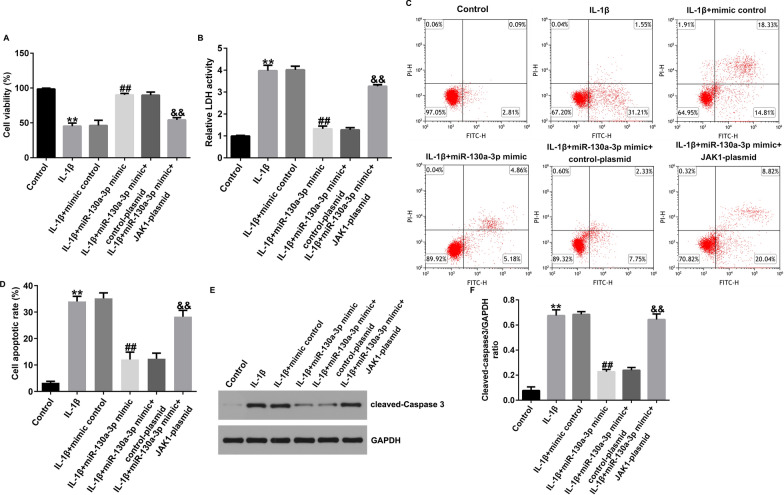 Figure 8
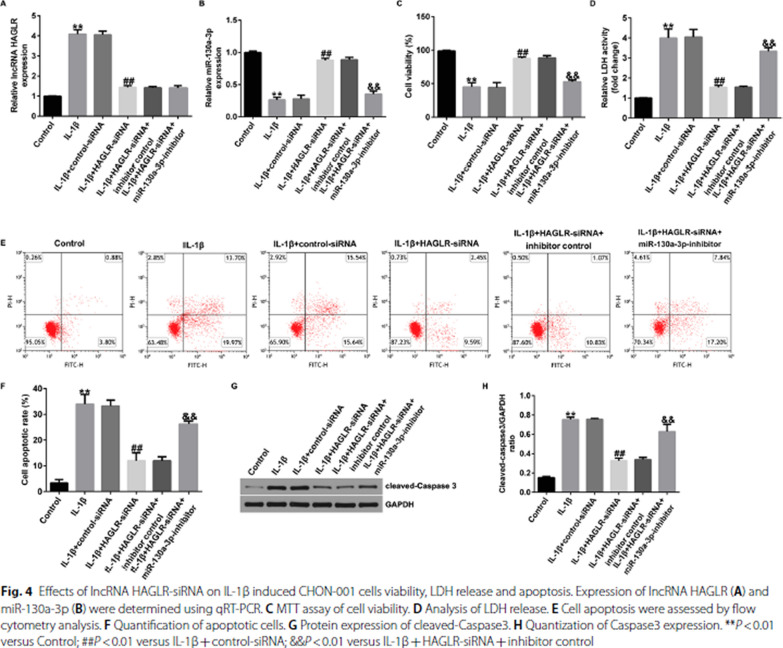 Figure 3
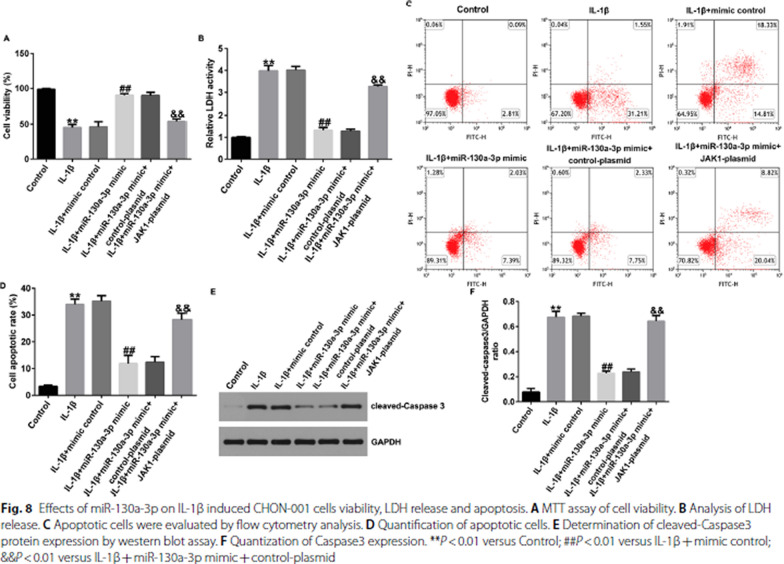 Figure 4
Peer Reviews
No public reviews on file for this paper yet. If you reviewed it on a platform where reviews are public (OpenReview, ICLR, NeurIPS, ICML), you can paste yours below so the community can read it here.
Videos
No videos yet. Explain this paper in a talk, walkthrough, or lecture? Add one.
Taxonomy
TopicsCancer-related molecular mechanisms research · Circular RNAs in diseases
Correction : Journal of Orthopaedic Surgery and Research (2023) 18:203 10.1186/s13018-023-03661-4.
In this article, Figs. 4 and 8 appeared incorrectly and have now been corrected in the original publication. For completeness and transparency, the incorrect and correct versions of Figs. 4 and 8 are displayed below.
Incorrect Fig. 4
Correct Fig. 4Fig. 4. Effects of lncRNA HAGLR-siRNA on IL-1β induced CHON-001 cells viability, LDH release and apoptosis. Expression of lncRNA HAGLR (A) and miR-130a-3p (B) were determined using qRT-PCR. C MTT assay of cell viability. D Analysis of LDH release. E Cell apoptosis were assessed by flow cytometry analysis. F Quantification of apoptotic cells. G Protein expression of cleaved-Caspase3. H Quantization of Caspase3 expression. **P < 0.01 versus Control; ##P < 0.01 versus IL-1β + control-siRNA; &&P < 0.01 versus IL-1β + HAGLR-siRNA + inhibitor control
Incorrect Fig. 8
Correct Fig. 8Fig. 8. Effects of miR-130a-3p on IL-1β induced CHON-001 cells viability, LDH release and apoptosis. A MTT assay of cell viability. B Analysis of LDH release. C Apoptotic cells were evaluated by flow cytometry analysis. D Quantification of apoptotic cells. E Determination of cleaved-Caspase3 protein expression by western blot assay. F Quantization of Caspase3 expression. **P < 0.01 versus Control; ##P < 0.01 versus IL-1β + mimic control; &&P < 0.01 versus IL-1β + miR-130a-3p mimic + control-plasmid
The original article has been corrected.