Serum proteomics of adults with acute liver failure provides mechanistic insights and attractive prognostic biomarkers
Katharina Remih, Franziska-Maria Hufnagel, Anna Sophie Karl, Valerie Durkalski-Mauldin, William Martens Lee, Constantine J. Karvellas, Zemin Su, Jody A. Rule, Petra Tomanová, Laura Krieg, Isabel Karkossa, Kristin Schubert, Martin von Bergen, Frank Tacke, Sonja Luckhardt

TL;DR
This study uses serum proteomics to identify biomarkers that distinguish acetaminophen-related from non-acetaminophen-related acute liver failure and predict patient survival.
Contribution
The study identifies novel, reproducible proteomic biomarkers that improve prognostication and understanding of ALF etiology.
Findings
Three hepatocellular proteins (ALDOB, CAT, and PIGR) reliably distinguish APAP-related from non-APAP-related ALF.
SERPINA1 and LRG1 are strong predictors of 21-day transplant-free survival.
Proteomic models outperformed existing prognostic scores for ALF outcomes.
Abstract
Acute liver failure (ALF) is defined as rapid onset coagulopathy and encephalopathy in patients without a prior history of liver disease. We performed untargeted and targeted serum proteomics to delineate processes occurring in adult patients with ALF and to identify potential biomarkers. Sera of 319 adult patients with ALF (∼50% acetaminophen [APAP]-related cases) were randomly selected from admission samples of the multicenter USA Acute Liver Failure Study Group consortium and subdivided into discovery/validation cohorts. They were analyzed using untargeted proteomics with mass spectroscopy and a serum cytokine profiling and compared with 30 healthy controls. The primary clinical outcome was 21-day transplant-free survival. Single-cell RNAseq data mapped biomarkers to cells of origin; functional enrichment analysis provided mechanistic insights. Novel prognostic scores were compared…
Genes, proteins, chemicals, diseases, species, mutations and cell lines named across the full text — each resolved to its canonical identifier and authoritative record.
Click any figure to enlarge with its caption.
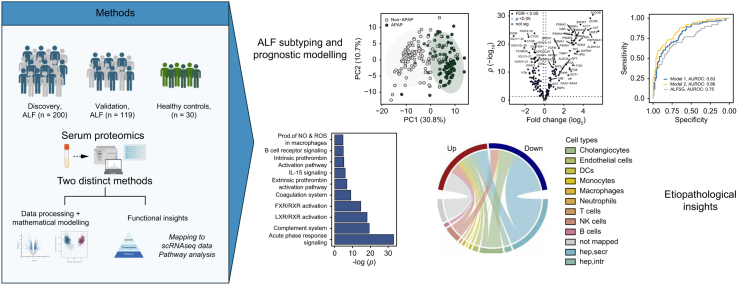 Figure 1
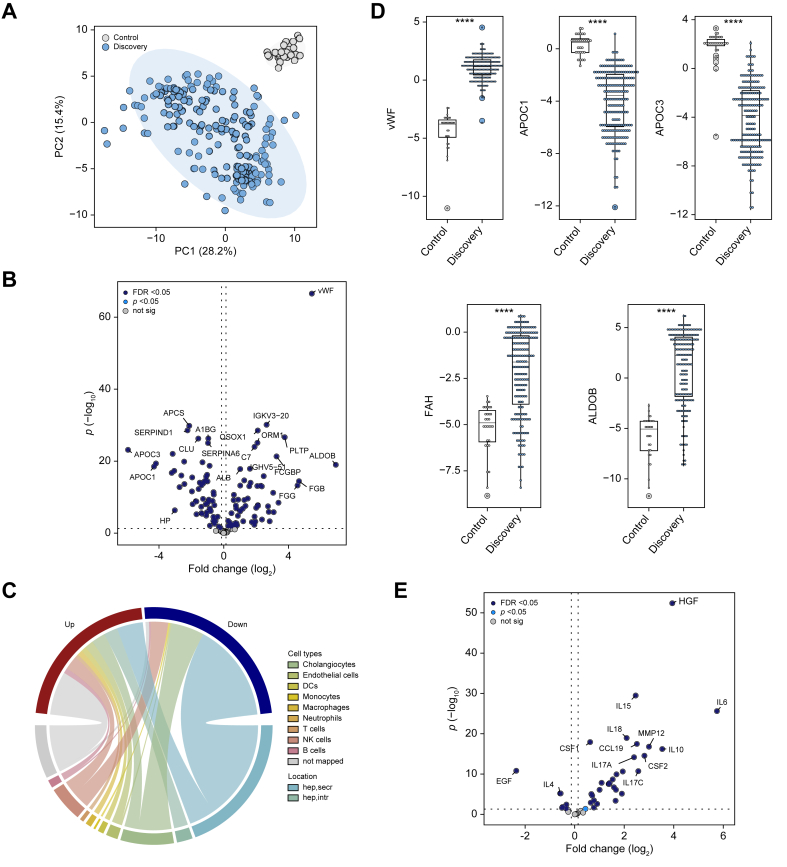 Figure 2
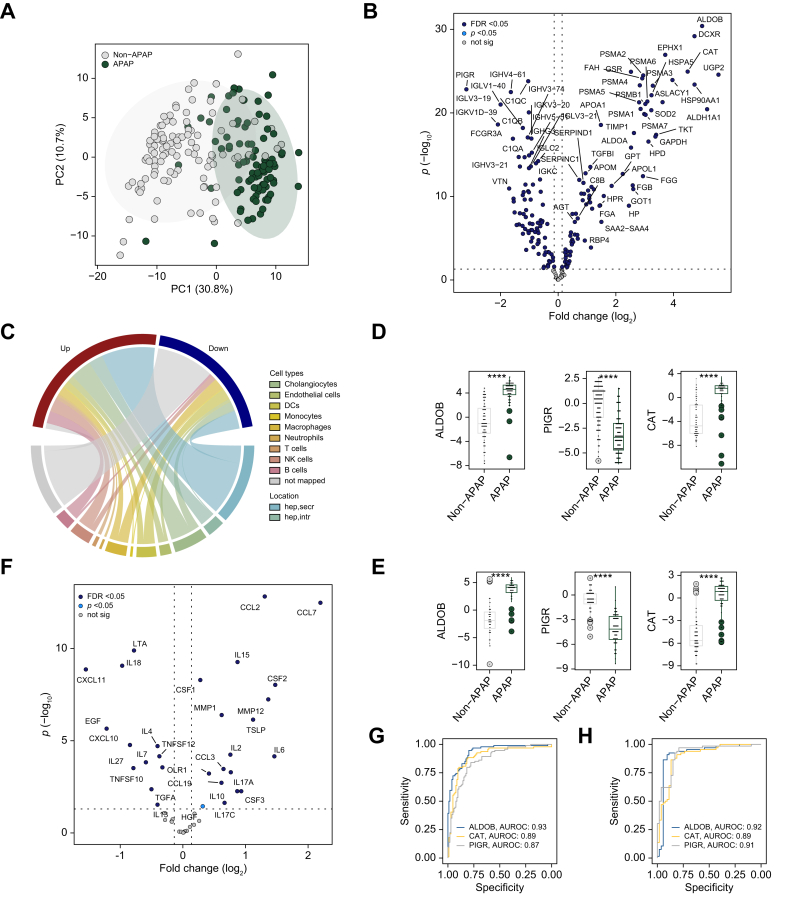 Figure 3
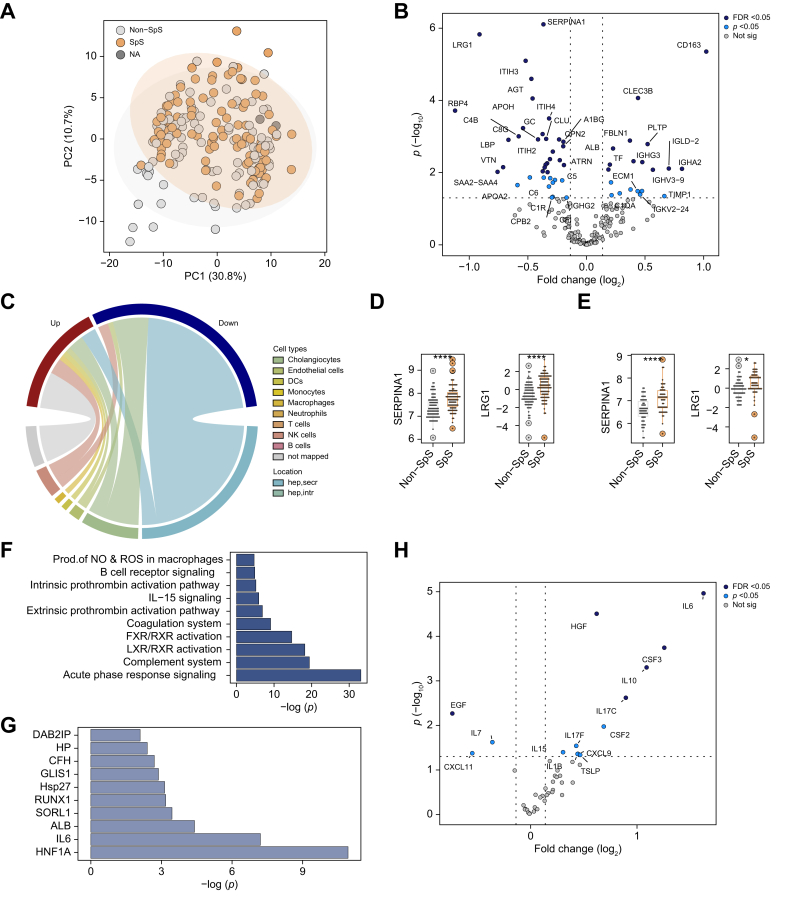 Figure 4
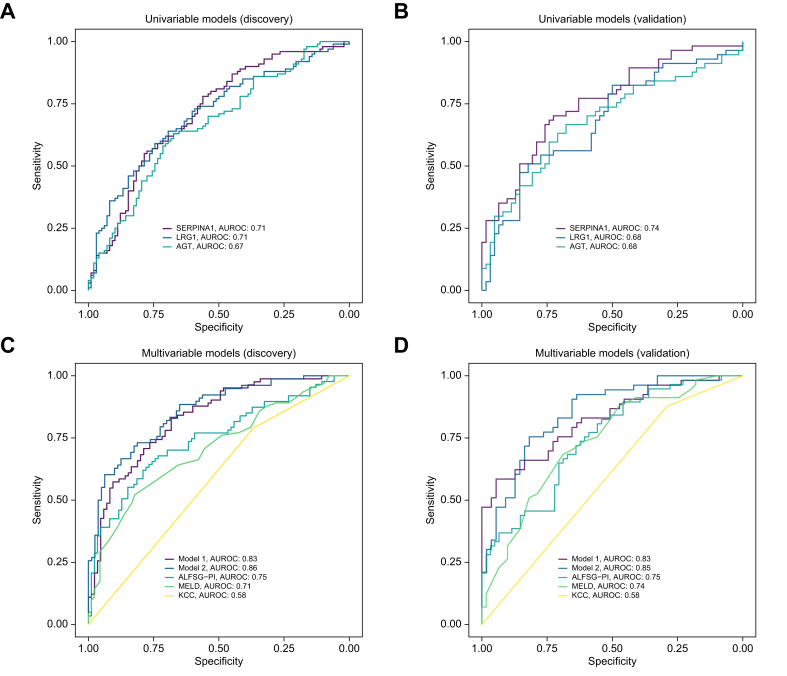 Figure 5
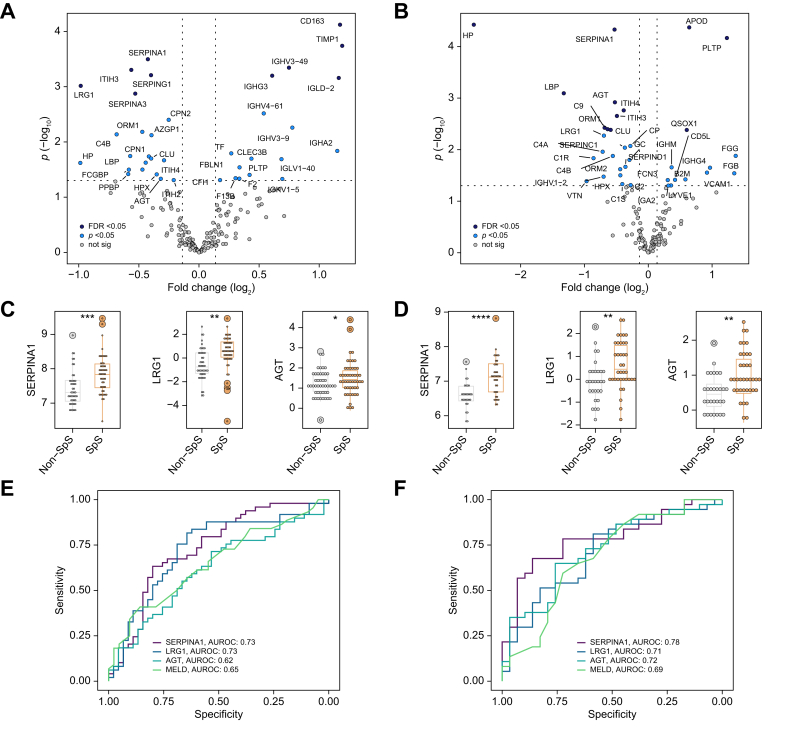 Figure 6
Peer Reviews
No public reviews on file for this paper yet. If you reviewed it on a platform where reviews are public (OpenReview, ICLR, NeurIPS, ICML), you can paste yours below so the community can read it here.
Videos
No videos yet. Explain this paper in a talk, walkthrough, or lecture? Add one.
Taxonomy
TopicsLiver Disease Diagnosis and Treatment · Liver Disease and Transplantation · Mitochondrial Function and Pathology
Introduction
Acute liver failure (ALF) is a rare condition defined by a rapid loss of liver function within 26 weeks in the absence of pre-existing liver disease.1 In the USA, acetaminophen (APAP) toxicity is responsible for ∼50% of patients with ALF, whereas viral infection, other drug-induced liver injuries, autoimmune hepatitis, and indeterminate etiologies are other established causes.1 ALF is characterized by severe acute injury that can rapidly evolve into multi-organ failure. It is a common indication for urgent liver transplantation (LTX), but a decision for/against liver LTX is challenging because of its rapid development, scarcity of organs, and the need for life-long immunosuppression.2
To facilitate the clinical management of patients with ALF, several prognostic scores have been evaluated such as the model for end-stage liver disease (MELD) and the Acute Liver Failure Study Group Prognostic Index (ALFSG-PI). However, the former showed only a moderate ability to detect a potentially lethal ALF,3 whereas the ALFSG-PI performed less well in patients with favorable etiology and higher coma grades.4 Although there is a constant search for novel biomarkers, a better understanding of the complex changes occurring during ALF is essential for both prediction and treatment. Therefore, large-scale assessments such as the recently published miRNA panel5 are attractive approaches to improving the understanding of ALF pathogenesis and uncovering novel prognostic biomarkers. Serum proteomic analyses are equally promising since hepatocytes are responsible for the synthesis of the majority of serum proteins.6 In addition to changes in secreted proteins, hepatocyte injury is characterized by an increased release of various intracellular proteins such as aspartate/alanine aminotransferases (AST/ALT) that serve as liver injury markers.6 Moreover, the synthesis of liver-derived proteins is orchestrated by various liver-enriched transcription factors and adjusted to organismal needs. For example, the body responds to inflammation via the so-called acute-phase response (APR) that leads to increased production of acute-phase proteins (APPs) and diminished synthesis of anti-APP.7
Although several studies demonstrated that proteins indicative of hepatocellular injury such as cytokeratin 18 – M30 (M30)8 or hepatic synthesis of serum proteins such as factor V or hepcidin1^,^9 constitute attractive ALF prognostic markers, a large-scale analysis of proteomic changes occurring during ALF is currently lacking. Therefore, we performed untargeted serum proteomics of admission samples from a large, multicenter cohort of patients with ALF who had been prospectively enrolled in the ALFSG registry study. To account for the presence of inflammation and the corresponding changes in protein synthesis, a targeted cytokine profiling was carried out. The performance of assessed proteins was compared with the multivariable ALFSG-PI and MELD scores. Network analyses were undertaken to provide mechanistic insights.
Materials and methods
Patient cohort
The patients were randomly selected from a pool of 2,244 adult patients prospectively identified and recruited at 28 tertiary North American centers participating in the Acute Liver Failure Study Group (ALFSG) between 1999 and 2019. In total, 319 patients were randomly selected from the ALFSG registry and were subdivided into a discovery cohort (200 individuals) and validation cohort (119 individuals) by approximating the distribution of major ALF etiologies found in the overall registry (Table 1). All samples were drawn on Days 1 or 2 after admission to the hospital.Table 1. Comparison of study cohorts and the overall ALFSG registry data.Table 1. ParametersDiscovery(n = 200)Validation(n = 119)Entire registry(N = 2,244)Age, years42 (31–53)39 (32–51)40 (24)Females, n (%)128 (64.0)88 (74.0)1,550 (69.1)Body mass index27 (24–32)27 (23–31)27.04 (6.62)Diabetes, n (%)34 (17.0)22 (18.5)372 (16.6)Caucasians, n (%)139 (69.5)94 (79.0)1,675 (74.6)Ethnicity (% Hispanic or Latino)19 (9.5)9 (7.6)209 (9.3)21-day outcome Spontaneous survival, n (%)100 (51.0)57 (47.9)1,059 (47.2) Death, n (%)51 (26.0)31 (26.0)693 (31.9) LTX, n (%)47 (24.0)32 (27.0)532 (23.8)Admission labsALT (IU/L)2,024 (656–4,507)1,865 (632–4,500)1,898.5 (629, 4,411)AST (IU/L)1,783.5 (571–4,430)1,809 (417–6,321)1,561 (452, 4,961)Alkaline phosphate (IU/L)138 (104–189)141 (107–198)134 (99, 186.5)Bilirubin (mg/dl)8.16 (4–19)7 (4–18)7.3 (3.7, 19.2)Creatinine (mg/dl)1.3 (0.80–2.65)1.40 (0.90–2.59)1.6 (0.9, 3.0)Hemoglobin (g/dl)10.85 (9.58–16.60)10.70 (9.50–12.40)10.9 (9.5, 12.7)INR3 (2.20–4.98)2.80 (2.05–4.40)2.8 (2.0, 4.1)MELD score32.5 (26–38)31 (26–37)33.27 (26, 38)Platelet count ( × 10^9^/L)136 (86–195)127 (73–198)126 (83, 190)Venous ammonia (μmol/L)110 (70–186)92 (63–129)94.5 (62, 144)Leukocyte count ( × 10^9^/L)10 (6.5–14.2)9.1 (6.5–13.9)10.25 (6.7–14.8)Clinical parameters at admission Admission HE grade 3/4, n (%)93 (48.9)58.00 (48.7)1,030 (47.3) Need for pressors, n (%)46 (23.0)19 (16.0)464 (20.7) Need for RRT, n (%)50 (25.0)24 (20.2)505 (22.5) Need for ventilator, n (%)102 (51.0)58 (48.7)1,062 (47.4)Etiology APAP, n (%)95 (47.5)66 (55.5)989 (44.1) Autoimmune, n (%)28 (14.0)17 (14.3)159 (7.1) Hepatitis B, n (%)34 (17.0)10 (8.4)166 (7.4) Indeterminate, n (%)33 (16.5)12 (10.1)276 (12.3) Other, n (%)10 (5.0)14 (11.8)654 (29.1)Data are expressed as median (25th-75th percentile) for continuous variables and n (%) for categorical variables. Admission HE grade 3/4, grade of hepatic encephalopathy at admission equal to or larger than 3.ALT, alanine aminotransferase; APAP, acetaminophen; AST, aspartate aminotransferase; DILI, drug-induced liver injury; INR, international normalized ratio; LTX, liver transplantation; MELD, model for end-stage liver disease; pressors, vasopressors; RRT, renal replacement therapy.
All individuals met the previously defined ALF criteria.1^,^8^,^9 The selection of patients was carried out by ALFSG staff not directly involved in the project. The institutional review boards of all participating centers approved the research, and the clinical investigation was conducted according to the principles of the 1975 Declaration of Helsinki. As the patients with ALF present with an altered mental status, written informed consent was obtained from their legal next of kin. Monitoring and therapeutic interventions were according to local institutional standards of care. Demographic, clinical, laboratory, radiologic, and 21-day outcome data were recorded prospectively.
Sera of healthy controls were collected at the University Hospital Aachen (Germany) as part of the Alpha1 liver initiative as described.10 All cohorts were matched by age and sex.
Pre-processing of serum proteomic datasets
Before processing the data, 716 proteins were identified in the discovery cohort, and 480 proteins in the validation cohort. All reverse and ‘only identified by site’ entries and potential contaminants were removed. The proteomic data were then log_2_-transformed and filtered for parameters reaching at least 70% valid values within at least one defined subgroup (healthy controls, APAP, or non-APAP cases of ALF). To further identify outliers, group-wise coefficients of variation were calculated and features with a coefficient of variation of maximum 0.3 within at least one defined subgroup were considered for downstream analysis (188 proteins in the discovery cohort and 137 proteins in the validation cohort). The remaining missing values were imputed column-wise with random draws from a distribution of the leftmost tail of the data (based on a quantile regression) [quantile regression imputation of left-censored data (QRILC) algorithm].11 Subsequently, the values were median-centered.
Differential abundance analysis for proteins and cytokines was performed by fitting the intensities in linear models with empirical Bayes moderation, no covariates were added. The p values were two-tailed and false discovery rate (FDR)-adjusted. Features were considered significantly differentially abundant across a given condition if the FDR was <0.05. Results are presented as volcano plots, plotting log_2_-fold changes on the x-axis and the obtained -log_10_ p values on the y-axis.
Sample size calculation
Sample size estimation was based on prior human -omics studies.[12], [13], [14] Further, using statistical power analysis principles outlined by Cohen et al.,15 we estimated that at least 34 individuals in each subgroup are required to detect small effect sizes with a 0.8 statistical power at the 0.05 significance level. To further increase statistical power and adjust for multiple testing, we decided to include 200 individuals in the discovery cohort (sizes of subgroups: 100 spontaneous survivors, 98 death/LTX, two with missing information on outcome). The 2:1 split between the discovery and validation cohort is based on published recommendations.16
Statistical analyses
All analyses were conducted using the R environment17 (R Foundation, Vienna, Austria, version 4.3.1) and R Studio18 (version 2023.06.1+524) using the following software packages: imputeLCMD,19 SummarizedExperiment,20 limma,21 ComplexHeatmap,22^,^23 circlize,24 glmnet,25^,^26 pROC,27 and corrplot.28 For the clinical data, continuous variables were displayed as median (IQR) and compared with the Wilcoxon rank-sum test, whereas categorical variables were presented as numbers (percentage), and comparison for proportion was done using the Χ^2^ test or Fisher’s exact test. Correlations between selected biomarkers were assessed in a pairwise manner using Spearman’s rank correlation test. Missing values in the clinical information were not imputed and not considered for any statistical calculations.
Principal component analysis (PCA) was carried out on the pre-processed proteomic data using the prcomp function with default parameters. Aiding the visualization, 95% CI ellipses were generated assuming a multivariate t-distribution.
Dot plots were used to display serum protein levels as determined via mass spectrometry across different conditions or etiologies. They display the median with first and third quartiles, their whiskers indicate the smallest and largest nonoutlier observations.
The ability of parameters to discriminate between APAP and non-APAP etiology or between 21-day transplant-free spontaneous survivors (SpS) vs. non-survivors (non-SpS) was assessed using the discovery cohort via univariate logistic regression models. For developing the multivariable models, all variables that differed between SpS and non-SpS were assessed, appropriate transformations were performed, and variables were analyzed for collinearity. Variables with an area under the receiver operating characteristic (AUROC) >0.55 and p value <0.05 in a univariable analysis were included. Variables with sample correlations greater than 0.7 or less than -0.7 were not included in the same model to mitigate collinearity and increase the stability and accuracy of estimated coefficients. Further, variable inflation factors were assessed for the selected models. Goodness of fit was assessed using the Hosmer–Lemeshow test. Performances of uni- and multivariable logistic regression models were evaluated using the AUROC, the DeLong test29 for correlated models, or the likelihood ratio test30 for nested models. The linearity between assessed variables and the logit of the 21-day outcome was assessed both graphically and using the Box–Tidwell test. Influential data points were assessed via Cook’s distance.
Data and results were reported using the TRIPOD reporting guidelines.31
For further methods, see the Supplementary information.
Results
Patients with ALF display substantial alterations in serum proteome
We compared the serum proteome of 200 representative patients with ALF (discovery cohort) (Table 1) with 30 liver-healthy controls (Table S1). The PCA (Fig. 1A) revealed marked differences between the groups with 117 proteins (i.e. 82% of the identified proteome) being significantly altered (FDR <0.05, Fig. 1B, Table S2). Out of those, 57 were elevated and 60 were decreased in patients with ALF vs. healthy controls (FDR <0.05). A mapping to publicly available liver single-cell sequencing data (Fig. 1C, Table S2) revealed that most of the altered proteins were hepatocyte-derived (68%). The 60 decreased proteins were primarily secreted proteins (e.g. apolipoprotein C-III [APOC3] or apolipoprotein C–I [APOC1], Fig. 1C and D), likely reflecting a loss of synthetic function. In contrast, intracellular-derived proteins (e.g. aldolase B [ALDOB] or fumarylacetoacetase [FAH], Fig. 1C and D) were uniformly elevated in ALF, likely reflecting the massive hepatocyte injury. von Willebrand factor (vWF), an endothelial-cell-derived factor, was the protein that was most significantly increased in patients with ALF vs. controls (Fig. 1B and D).Fig. 1. Serum proteomic alterations in patients with ALF vs. healthy controls.(A) The first two dimensions of the principal component analysis highlight marked differences in proteomic signatures of patients with ALF (discovery cohort) and healthy controls. (B) The corresponding volcano plot depicts the 187 differentially abundant proteins (98 elevated and 89 diminished in ALF, Bayesian linear regression). A log_2_ fold-change >0 indicates proteins elevated in patients with ALF vs. healthy controls (discovery cohort). (C) Chord diagram assigning the proteins altered between patients with ALF and healthy controls to publicly available liver single-cell RNAseq data (discovery cohort). Up/down refers to features increased/decreased in patients with ALF. (D) Serum levels of characteristic proteins that differ between patients with ALF and healthy controls, displayed via dot plots. Significance levels are as follows: ∗p <0.05, ∗∗p <0.01, ∗∗∗p <0.001 (Bayesian linear regression). (E) Volcano plot visualizing the results of the differential abundance analysis of a cytokine profiling comparing serum levels between patients with ALF and healthy controls (discovery cohort). The dotted horizontal lines in (B) and (E) depict an FDR <0.05. ALDOB, aldolase B; ALF, acute liver failure; APOC1, apolipoprotein C–I; APOC3, apolipoprotein C-III; FAH, fumarylacetoacetase, FDR, false discovery rate; NA, not available; not sig, features not reaching statistical significance in differential abundance analysis (p <0.05); vWF, von Willebrand factor.Fig. 1
Although the untargeted proteomics uncovered only a modest number of proteins related to immune cells, many were higher in patients with ALF compared with controls. A further assessment of inflammatory reaction with cytokine profiling revealed 36 elevated proteins (i.e. 80% of the 45 assessed markers) in patients with ALF (Fig. 1E). Among them, the hepatocyte growth factor (HGF), a potential surrogate of liver dysfunction,32 and the proinflammatory interleukins IL6 and IL15 were most profoundly altered (Table S3).
Patients with APAP and non-APAP ALF have unique proteomic patterns
When comparing patients with APAP vs. non-APAP as the major ALF etiologies, major differences in routine parameters (Table 2) and serum proteome (Fig. 2A) were noted. Among the 167 altered proteins, 47% were derived from hepatocytes including intracellular proteins (e.g. ALDOB or catalase [CAT]) likely reflecting the more pronounced hepatocellular injury of patients with APAP ALF (Fig. 2B–D, Table S4). In the cytokine profiling (Fig. 2E), patients with APAP ALF displayed increased levels of CC-chemokines (i.e. CCL2, CCL7), whereas tumor necrosis factor family and C-X-C family cytokines were typically diminished. Hepatocellular injury markers (ALDOB, CAT) were among the top discriminators between patients with APAP and non-APAP ALF, all reaching c-statistics of ∼0.9 in a univariable logistic regression model (Fig. 2F) thereby surpassing the abilities of routine parameters (c-statistics ≤0.86) and the assessed cytokines (c-statistics ≤0.81, Table S5). Notably, the major findings were reproducible in the validation cohort (Fig. 2D and F).Table 2. Characteristics of patients with acetaminophen- and non-APAP-induced acute liver failure.Table 2. VariablesDiscovery cohortValidation cohortnAPAP(n = 95)Non-APAP(n = 105)p valuenAPAP(n = 66)Non-APAP(n = 53)p valueAge, years20040 (31–51)44 (31–56)0.17411936 (28–42)46 (37–57)<0.001Females, n (%)20064 (67.4)64 (61.0)0.34511955 (83.0)33 (62.3)0.009Body mass index18927 (23–31)28 (24–33)0.12311925 (22–30)29 (25–31)0.037Diabetes, n (%)20013 (13.7)21 (20)0.23511910 (15.2)12 (22.6)0.296Caucasians, n (%)20074 (77.9)65 (61.9)<0.00111959 (89.3)35 (66.0)0.002Ethnicity (% Hispanic or Latino)2009 (9.5)10 (9.5)0.9901192 (3.0)7 (13.2)0.07621-day outcome, n (%)Spontaneous survival19849 (52.1)51 (49.0)0.66411937 (56.1)20 (37.7)0.047Death19823 (24.0)28 (27.0)0.69311915 (23.0)16 (30.0)0.357LTX19822 (23.0)25 (24.0)0.91711915 (23.0)17 (32.0)0.253Admission labsALT (IU/L)1933,532 (2,140–5,937)847 (352–2,251)<0.0011173,550 (2,177–6,406)632 (311–1,458)<0.001AST (IU/L)1922,901 (1,792–7,784)836 (326–1,914)<0.0011184,717 (1,663–8,560)522 (302–1,376)<0.001Alkaline phosphate (IU/L)191130 (101–183)146 (110–203)0.135118121 (104–160)177 (124–226)<0.001Bilirubin (mg/dl)1925 (3–7)18 (9–25)<0.0011184 (3–6)18 (13–25)<0.001Creatinine (mg/dl)1991.90 (1.00–3.00)1.10 (0.70–2.03)0.0021191.55 (1.00–2.90)1.02 (0.70–2.40)0.007Hemoglobin (g/dl)19610.30 (8.45–11.88)11.60 (9.95–13.08)<0.00111710.60 (9.30–12.23)11.50 (10.00–13.20)0.063INR1903.50 (2.40–5.30)2.65 (2.10–4.60)0.0501193.25 (2.30–4.95)2.50 (2.00–3.40)0.007MELD score18432 (25–40)33 (27–37)0.80711832 (26–36)30 (27–39)0.970Platelet count ( × 10^9^/L)196114 (65–166)152 (107–220)<0.00111732 (26–36)30 (27–39)0.360Venous ammonia (μmol/L)77134 (77–269)99 (61–140)0.05873103 (73–139)82 (53–124)0.113Leukocyte count ( × 10^9^/L)1969.8 (5.7–14.5)10.2 (6.9–13.8)0.741179.5 (6.5–15.0)8.9 (6.7–12.1)0.14**Clinical parameters at admission, n (%)Admission HE grade 3/419053 (56.7)40 (41.2)0.03011942 (63.6)16 (30.2)<0.001Need for pressors20032 (33.7)14 (13.3)<0.00111913 (19.7)6 (11.3)0.215Need for RRT20039 (41.1)11 (10.5)<0.00111914 (21.2)10 (18.9)0.751Need for ventilator20062 (65.3)40 (38.1)<0.00111944 (66.7)14 (26.4)<0.001Etiology, n (%)**APAP95 (100.0)0 (0)66 (100.0)0 (0)Autoimmune0 (0)28 (26.7)0 (0)17 (32.1)Hepatitis B0 (0)34 (32.4)0 (0)10 (18.9)DILI0 (0)7 (6.7)0 (0)14 (26.4)Indeterminate0 (0)33 (31.4)0 (0)12 (22.6)Other0 (0)2 (1.9)0 (0)0 (0)Data are expressed as median (25th-75th percentile) for continuous variables and n (%) for categorical variables. The p values were calculated using the Wilcoxon rank-sum test for continuous variables or Fisher’s exact test for categorical variables. Admission HE grade 3/4, grade of hepatic encephalopathy at admission equal to or larger than 3.ALT, alanine aminotransferase; APAP, acetaminophen; AST, aspartate aminotransferase; DILI, drug-induced liver injury; INR, international normalized ratio; LTX, liver transplantation; MELD, model for end-stage liver disease; RRT, renal replacement therapy.Fig. 2. Serum proteomic alterations in patients with APAP vs. non-APAP ALF.(A) The first two dimensions of the principal component analysis highlight profound differences in proteomic signatures of patients with APAP and non-APAP ALF (discovery cohort). (B) The corresponding volcano plot depicts 167 differentially abundant proteins (83 elevated and 84 diminished in APAP; Bayesian linear regression). A log_2_ fold-change >0 indicates proteins elevated in APAP vs. non-APAP (discovery cohort). (C) Chord diagram representing the mapping of features altered between patients with APAP and non-APAP ALF to publicly available liver single-cell RNAseq data (discovery cohort). Up/down refers to features increased/decreased in patients with APAP ALF. (D/E) Serum levels of the top three discriminating features (ALDOB, CAT, and PIGR) are depicted via dot plots for both the discovery (D) and the validation (E) cohort. Significance levels are indicated as follows: ∗p <0.05, ∗∗p <0.01, ∗∗∗p <0.001 (Bayesian linear regression). (F) Volcano plot representing the results of the differential abundance analysis of the cytokine profiling between patients with APAP and non-APAP ALF (discovery cohort). Dotted horizontal lines in panels (B) and (F) depict FDR <0.05 (Bayesian linear regression). (G/H): Discriminative performances for the three proteins were assessed in univariable logistic regression models, results are depicted via receiver operating curves for both the discovery (G) and validation (H) cohort. ALDOB, aldolase B; ALF, acute liver failure; APAP, acetaminophen; APOC1, apolipoprotein C–I; APOC3, apolipoprotein C-III; FAH, fumarylacetoacetase; FDR, false discovery rate; NA, not available; not sig, features not reaching statistical significance in differential abundance analysis (p <0.05); vWF, von Willebrand factor.Fig. 2
Admission levels of several serum proteins are associated with 21-day transplant-free survival
In the discovery cohort, 51 patients (26%) died and 47 (24%) received LTX within 21 days after admission (non-SpS), while 100 patients (50%) were SpS. Patients who were non-SpS displayed higher international normalized ratio (INR), ammonia levels, hepatic encephalopathy grades, and MELD scores (Table 3). Although no obvious separation was detected between the SpS group and non-SpS group in the PCA (Fig. 3A), 39 proteins significantly differed between the groups (FDR <0.05, Fig. 3B). The majority of these proteins were secreted by hepatocytes (27; 69%) that were nearly uniformly decreased in patients who were non-SpS (Fig. 3C, Table S6), for example alpha1-antitrypsin (SERPINA1) or leucine-rich alpha-2-glycoprotein (LRG1) (Fig. 3D). In contrast, immune-related proteins such as scavenger receptor cysteine-rich type 1 protein M130 (CD163) or various immunoglobulin components were often elevated in patients who were non-SpS (Fig. 3B and C, Table S6).Table 3. Characteristics of spontaneous survivors (SpS) and non-spontaneous survivors (non-SpS).Table 3. VariablesDiscovery cohortValidation cohortnSpS(n = 100)Non-SpS(n = 98)p valuenSpS(n = 57)Non-SpS(n = 62)p valueAge19842 (30–53)42 (32–56)0.58811938 (31–52)41 (32–49)0.770Sex (% female)19867 (68.4)60 (60)0.22011948 (84.2)40 (64.5)0.014Body mass index (kg/m^2^)18727 (24–32)27 (24–31)0.80511928 (23–32)26 (22–30)0.557Diabetes, n (%)19818 (18.4)16 (16.0)0.65911911 (19.3)11 (17.7)0.827Caucasian race, n (%)19867 (68.4)70 (70.0)0.86911945 (79.0)49 (79.0)0.950Hispanic/Latino ethnicity, n (%)19810 (10.2)9 (9.0)0.7741195 (8.8)4 (6.5)0.736Admission labsALT (IU/L)1911,911 (690–4,074)2,179 (637–4,507)0.9611172,333 (896–5,277)1,630 (504–3,300)0.218AST (IU/L)1901,715 (544–2,893)1,911 (594–5,515)0.3391182,043 (538–6,550)1,524 (375–4,769)0.546Alkaline phosphate (IU/L)189135 (102–203)139 (106–174)0.582118143 (105–207)136 (110–193)0.951Bilirubin (mg/dl)1908 (4–17)9 (5–22)0.0641185 (3–10)11 (6–20)<0.001Creatinine (mg/dl)1971.30 (0.70–2.65)1.40 (0.90–2.75)0.4901191.16 (0.80–2.50)1.43 (0.90–2.60)0.375Hemoglobin (g/dl)19411.15 (9.90–12.80)10.55 (9.08–12.30)0.08811710.70 (9.50–12.20)11.25 (9.48–12.40)0.766INR1882.60 (1.90–3.73)3.95 (2.60–5.80)<0.0011192.30 (1.90–4.20)3.20 (2.50–5.08)0.003MELD score18229 (24–35)35 (30–41)<0.00111827 (23–33)35 (30–39)<0.001Platelet count ( × 10^9^/L)194142 (92–204)126 (75–189)0.249117160 (104–220)92 (64–165)0.001Venous ammonia (μmol/l)7792 (57–124)144 (79–264)0.0047392 (69–114)97 (63–139)0.544Leukocyte count ( × 10^9^/L)1949.6 (5.8–14.4)10.7 (7.1–14.1)0.3211178.8 (6.5–13.7)9.5 (6.5–14.1)0.717**Clinical parameters at admission, n (%)Admission HE grade 3/418834.0 (35.8)57.0 (61.3)<0.00111938 (66.7)23. (37.1)0.001Need for pressors19816 (16.0)29 (29.6)0.0231192 (3.5)17 (27.4)<0.001Need for RRT19822 (22.0)28 (28.6)0.2871197 (12.3)17 (27.4)0.04Need for ventilator19838 (38.0)63 (64.3)<0.00111921 (36.8)37 (59.7)0.013Etiology, n (%)**APAP49 (49.0)45 (45.9)37 (64.9)29 (46.8)Autoimmune13 (13.0)15 (15.3)8 (14.0)9 (14.5)Hepatitis B17 (17.0)16 (16.3)0 (0)10 (16.1)DILI4 (4.0)2 (2.0)9 (15.8)5 (8.1)Indeterminate17 (17.0)16.0 (16.3)3 (5.3)9 (14.5)Other0 (0)3 (3.0)0 (0)0 (0)Data are expressed as median (25th-75th percentile) for continuous variables and n (%) for categorical variables. The p values were calculated using the Wilcoxon rank-sum test for continuous variables or Fisher’s exact test for categorical variables. Non-SpS and SpS refer to patients who died or required liver transplant within 21 days of enrolment and those who did not, respectively. Admission HE grade 3/4, grade of hepatic encephalopathy at admission equal to or larger than 3.ALT, alanine aminotransferase; APAP, acetaminophen; AST, aspartate aminotransferase; Autoimmune, autoimmune hepatitis; DILI, drug-induced liver injury; INR, international normalized ratio; MELD: model for end-stage liver disease.Fig. 3. Serum proteomic alterations in patients with ALF with vs. without spontaneous survival.(A/B) The first two dimensions of the principal component analysis (A) show no obvious separation between patients passing away or receiving liver transplantation within 21 days after admission (non-SpS) and spontaneous survivors (SpS). A 39-protein signature (12 elevated and 27 diminished in SpS) discriminated both groups as seen in the corresponding volcano plot (B) (FDR <0.05, Bayesian linear regression). A log_2_ fold-change >0 indicates proteins elevated in non-SpS vs. SpS (discovery cohort). (C) The signature of altered proteins was mapped to publicly available liver single-cell RNAseq data (discovery cohort). (D/E) SERPINA1 and LRG1 are robustly associated with 21-day outcome in both discovery (D) and validation (E) cohort. Significance levels are indicated as follows: ∗p <0.05, ∗∗p <0.01, ∗∗∗p <0.001 (Bayesian linear regression). (F/G) Ingenuity Pathway Core Analysis (IPA) depicts 10 pathways (F) and upstream regulator networks (G) that were most significantly altered in the 21-day outcome dataset (full results, see Tables S9 and S10) (Fisher’s exact test) (discovery cohort). (H) Results of the cytokine profiling comparing non-SpS and SpS are depicted in a volcano plot; six features were differentially abundant (FDR <0.05, Bayesian linear regression) (discovery cohort). 21-day outcome, spontaneous survival vs. liver transplantation or death during the first 21 days post study admission; FDR, false discovery rate; hep, intr, hepatocellular intracellular features; hep, secr, hepatocellular secreted features; LRG1: leucine-rich alpha-2-glycoprotein; MELD: model for end-stage liver disease; NA, not available; not sig, features not reaching statistical significance in differential abundance analysis (p <0.05); SERPINA1: alpha1-antitrypsin.Fig. 3
To account for the heterogeneity of our cohort regarding etiology, disease severity, and treatment modalities, the Bayes-corrected linear regression model was adjusted for different covariates (e.g. APAP yes/no, MELD, fulfillment of King’s College Criteria (KCC), the need for dialysis or vasopressor therapy at baseline). Notably, the adjusted models yielded comparable results and the most prominent predictors remained significant across all adjusted models (Fig. S1). To obtain further insights into the processes associated with 21-day outcome, we used Ingenuity Pathway Analysis (IPA, Qiagen, Hilden, Germany). The core analysis identified a significant (p <0.05) overlap with 36 pathways (Table S7), with the APR being the most significant (Fig. 3F). Hepatocyte nuclear factor 1A (HNF1A), a key liver-enriched transcription factor driving production of multiple secreted hepatocellular proteins and IL6, a master APR regulator were the top upstream regulators (Fig. 3G, Table S8). Notably, well-established IL6 targets include SERPINA16 and LRG1.33 Accordingly, a targeted cytokine profiling revealed, that most proinflammatory cytokines were higher in non-SpS individuals and IL6 was the most significantly altered marker (Fig. 3H, Table S9).
SERPINA1 and LRG1 displayed a moderate correlation (Rs = 0.65, p <0.0001) whereas neither one markedly correlated with other established hepatic secretory proteins such as transthyretin or transferrin or their upstream regulators (e.g. IL6) (Fig. S2). LRG1, SERPINA1, and angiotensinogen (AGT) constituted the best discriminators for 21-day transplant-free survival with c-statistics ∼0.7 in a univariable logistic regression analysis that was similar in performance to the composite MELD score and was confirmed in the validation cohort (Fig. 4A–D, Table S10). In contrast, inflammation-related parameters did not display comparable discriminative properties with c-statistics ≤0.67 in the discovery cohort and an even worse performance in the validation cohort (Table S10).Fig. 4. Ability of selected proteins and models to predict 21-day outcome in patients with ALF.(A/B) Areas under receiver operating curves (AUROCs) delineate the ability of the top three biomarkers to predict ALF outcome in the discovery (A) and validation (B) cohort (univariable logistic regression). (C/D) AUROCs for best-performing five-feature models (model 1 comprising SERPINA1, IL6, EGF, ATRN, and serum bilirubin; model 2 comprising SERPINA1, INR, the need for mechanical ventilation, EGF and serum bilirubin) are compared to the ALFSG-PI, the model for end-stage liver disease (MELD) and the King’s College Criteria (KCC) in the discovery (C) and validation (D) cohort (multivariable logistic regression). ALFSG-PI: ALFSG prognostic index; ATRN: attractin; EGF, epidermal growth factor; INR: international normalized ratio; SERPINA1: alpha1-antitrypsin.Fig. 4
As APAP is the leading etiology in both cohorts and clearly differs from patients with non-APAP ALF we investigated the behavior of the detected proteins in this more homogeneous subgroup. Although the volcano plots visualizing proteins that are significantly altered in patients who were SpS vs. non-SpS differed somewhat between the discovery and validation cohorts (Fig. 5A and B), SERPINA1 and LRG1 (Fig. 5C and D) emerged as the most robust prognostic markers reaching c-statistics 0.73/0.78 and 0.73/0.71 in the discovery and validation cohorts, respectively (Fig. 5E and F).Fig. 5. Proteins associated with spontaneous survival among patients with APAP-induced ALF.(A/B) Volcano plots depicting differential abundance analysis results in patients with APAP in the discovery (A) and validation cohort (B) (Bayesian linear regression). A log_2_ fold-change >0 indicates proteins elevated in non-SpS vs. SpS. (C/D) Dot plots visualizing protein levels of features associated with 21-day outcome (SERPINA1, LRG1, AGT) in APAP cases (discovery: C, validation: D). Significance levels are indicated as follows: ∗p <0.05, ∗∗p <0.01, ∗∗∗p <0.001 (Bayesian linear regression). (E/F) Predictive performances as determined via logistic regression (discovery: E, validation: F) of SERPINA1, LRG1, AGT, and MELD in patients with APAP. AGT, angiotensinogen; LRG1, leucine-rich alpha-2-glycoprotein; MELD, model for end-stage liver disease; not sig, features not reaching statistical significance in differential abundance analysis (p <0.05); SERPINA1, alpha1-antitrypsin.Fig. 5
To predict the ALF course, we first assessed whether the addition of a proteomics-based parameter can improve the prognostic value of ALFSG-PI, however, only minor improvements were achieved (e.g. AUROC 0.77/0.79, p <0.0001 [likelihood ratio test] for SERPINA1 and 0.78/0.77, p <0.0001 [likelihood ratio test] for AGT in the discovery and validation cohort, respectively) (Table S11).
Next, we conducted a multivariable analysis that first considered all variables significantly associated with 21-day outcome in univariable analysis and displayed an AUROC >0.55 to be included in a potential model. We used the established ALFSG-PI score as a comparator and focused on the identification of alternative five-feature combinations. For model 1, we limited the search to continuous parameters. Among them, a combination of two secreted proteins (SERPINA1, attractin [ATRN]), two cytokines (IL6, epidermal growth factor [EGF]), and bilirubin displayed a reproducible performance (AUROCs 0.83 in both cohorts) numerically surpassing the AUROC of the ALFSG-PI score (AUROCs 0.75 in both cohorts), but the difference did not reach statistical significance. Consideration of categorical parameters yielded model 2 (encompassing SERPINA1, EGF, the INR, bilirubin, and the need for ventilation), which significantly improved the prediction (AUROC 0.86 in the discovery cohort and 0.85 in the validation cohort; p = 0.008, DeLong’s test; Fig. 4C and D; Table S12, Figs S3 and S4). Both models also outperformed the MELD score (AUROC 0.71 in the discovery cohort and 0.74 in the validation cohort) and the KCC (AUROCs 0.58 in both cohorts) (Fig. 4C and D).
Discussion
In our study, we used two complementary proteomic techniques to analyze admission samples from a large multicenter observational cohort with a centralized study protocol.1^,^8^,^9 By mapping the evaluated proteins to the corresponding liver cell populations, we demonstrated an increase in several endothelial markers and a decrease in many secreted proteins. Among the former, vWF was the protein most significantly upregulated in patients with ALF vs. controls. This is in line with previous results, both in ALF34 and chronic liver disease,35 as well as the fact that its secretion is promoted by inflammation and endothelial damage.34^,^35 Regarding ALF etiologies, patients with APAP and non-APAP ALF displayed unique proteomic patterns and several hepatocellular injury markers constituted robust discriminators. This is not surprising as APAP constitutes the more acute ALF subtype displaying higher levels of routine hepatocellular damage markers.1 Among them, ALDOB was the best analyte to diagnose APAP ALF, and its usefulness was confirmed in the validation cohort. Our finding is in line with a recent proteomic study that uncovered ALDOB as a robust marker of hepatocellular drug-induced liver injury.36 Although ALT and ALDOB are both found in the cytoplasm and have a similar serum half-life,37 the latter is produced primarily in mid-lobule hepatocytes whereas ALT is more periportal.36 Because of that, ALDOB might be more sensitive to hepatocellular damage that occurs in the central area.36 Notably, a reliable detection of APAP-related ALF is of obvious clinical importance as its course can be ameliorated by timely administration of N-acetyl cysteine and the etiology might be difficult to determine because of impaired mental status or lack of cooperation.1^,^2
A combination of pathway analysis and single-cell mapping revealed a decrease in HNF1A-induced secreted proteins as a major indicator of poor prognosis. HNFs are key liver-enriched transcription factors orchestrating the synthesis of secreted hepatocellular proteins. In line with that, a defective expression of HNF4α was suggested to drive hepatocellular failure in alcoholic hepatitis,38 whereas its forced re-expression reversed experimental ALF.38 An impaired APR was the key process associated with poor prognosis. This is unsurprising as APR is believed to protect the body from stresses and is involved in microbial defense.6 For example, genetic inhibition of APR resulted in a significantly increased mortality in a mouse model of microbial infection.39 Among the assessed APPs, the levels of SERPINA1 and LRG1 were particularly good markers of a poor prognosis. The fact that serum levels of both proteins are poorly correlated with levels of their upstream regulators further suggests that the inability of the hepatocytes to adjust protein production to the organismal needs is linked to dismal outcomes.
This observation is biologically plausible as both proteins have multiple beneficial functions. For example, LRG1 promotes angiogenesis40 whereas SERPINA1 is a major protease inhibitor with anti-inflammatory and tissue-protective properties.41 Among the APR regulators, a strong overlap between the outcome dataset and IL6 signaling was revealed. This finding is in line with the important role of IL6 in liver regeneration and the demonstrated impaired regeneration of IL6-deficient mice.42^,^43
It is also consistent with a previous report that uncovered hepcidin, that is another well-established APP, as a good predictor of ALF outcome.9 In contrast to secreted proteins, cytokines and inflammatory proteins such as CD163 seem to be less robust indicators of prognosis but might be useful in disease subgroups or as adjuncts in prognostic scores.44^,^45 In our modeling effort, we obtained AUROC values comparable to or even superior to previously published models4^,^8 and in a direct comparison seemed to be even superior. In addition, model 1 relied only on continuous laboratory parameters, whereas the other score included variables such as coma grade that might be observer-dependent.
Although the mass spectrometry technique is robust and widely available, it misses less abundant proteins such as some intracellular proteins (e.g. lactate dehydrogenase or carbamoyl phosphate synthetase 1) which were previously suggested to be of prognostic relevance in ALF46^,^47 but were detected only in a subset of our patients (data not shown). Such proteins can be detected after depletion of the most abundant serum proteins,46 however, this approach is known also to introduce artifacts and is too laborious for routine use. A further limitation of our work is that we were not able to compare patients with ALF with patients who had acute liver injury without ALF, that we did not assess longitudinal samples, and were not able to fully account for temporal biases and changing treatments. Such analyses may yield important additional insights and warrant further studies.
In conclusion, our study assessed the unique ALFSG cohort to detect alterations in levels of serum proteins and cyto-/chemokines in individuals with ALF of different etiologies. These findings provide novel etiopathogenic insights and uncover attractive diagnostic biomarkers as well as predictors of disease outcome. The fact that several of the identified biomarkers (i.e. SERPINA1, IL6) are readily available in the clinical routine should facilitate their translation. Given the limited cohort size, our study was not sufficiently powered to develop and validate a novel clinically relevant score, but rather aimed at obtaining insight into the pathophysiology in ALF. Our findings will need to be validated in independent cohorts with different non-APAP ALF etiologies.
Abbreviations
APOC1, apolipoprotein C–I; APOC3, apolipoprotein C-III; APP, acute-phase protein; APR, acute-phase response; AST, aspartate aminotransferase; ATRN, attractin; AUROC, area under the receiver operating curve; CAT, catalase; CCL2, C–C motif chemokine ligand 2; CCL7, C–C motif chemokine ligand 7; CD160, scavenger receptor cysteine-rich type 1 protein; CSF, colony-stimulating factor; DILI, drug-induced liver injury; EGF, epidermal growth factor; FAH, fumarylacetoacetase; FDR, false discovery rate; HGF, hepatocyte growth factor; HNF1A, hepatocyte nuclear factor 1A; INR, international normalized ratio; IPA, Ingenuity Pathway Analysis; KCC, King’s College Criteria; LRG1, leucine-rich alpha-2-glycoprotein; LTX, liver transplantation; MELD, model for end-stage liver disease; non-SpS, non-spontaneous survivors; PCA, principal component analysis; PIGR, polymeric immunoglobulin receptor; SERPINA1, alpha1-antitrypsin; SpS, 21-day transplant-free spontaneous survivors; vWF, von Willebrand factor.
Financial support
PS is supported by the German Research Foundation (DFG) consortium SFB 1382 (ID 403224013) “Gut-liver axis” and DFG grant STR 1095/6-1 (Heisenberg professorship).
Authors’ contributions
Conceptualization (lead): RJF, PS. Conceptualization (equal): KR. Visualization (lead): KR.
Visualization (supporting): ASK. Methodology (lead): PS. Data curation (lead): KR. Data curation (supporting): JAR. Formal analysis (lead): KR. Formal analysis (supporting): F-MH, PT. Writing – original draft (lead): KR. Writing – review and editing (lead): KR. Writing – review and editing (supporting): VD-M, WML, CJK, ZS, JAR, KS, MvB, FT, NZ, PS. Resources (lead): PS. Resources (equal): LK, IK, KS, MvB, SL, NZ, AK, BE, RT, RJF. Supervision (lead): PS. Funding acquisition (lead): PS. Full access to all the data and approved the final version of this manuscript: all authors.
Data availability statement
Data are available upon reasonable request to the corresponding author.
Conflicts of interest
PS reports receiving grant support and lecture fees from Grifols and CSL Behring, grant support and advisory board fees from Arrowhead Pharmaceuticals, grant support from Vertex Pharmaceuticals, advisory board fees from Dicerna Pharmaceuticals and Ono Pharmaceuticals, and lecture fees from Alnylam Pharmaceuticals. RJF has received research support from Kezar Pharmaceuticals, Takeda Pharmaceuticals, and the NIH (ALFSG and DILIN). WML consults for Genentech, SeaGen, GSK, and Veristat and receives research support from Gilead, Alexion, Vivet, Camurus, and Lipocine, none related to the current article. BE was supported by the PRACTIS – Clinician Scientist program of Hannover Medical School, funded by the German Research Foundation (DFG, ME 3696/3). All other authors report no conflicts of interest.
Please refer to the accompanying ICMJE disclosure forms for further details.
The reference list from the paper itself. Each links out to its DOI / PubMed record.
- 1Stravitz R.T.Lee W.M.Acute liver failure Lancet 39420198698813149810110.1016/S 0140-6736(19)31894-XPMC 10836844 · doi ↗ · pubmed ↗
- 2European Association for the Study of the Liver EASL Clinical Practical Guidelines on the management of acute (fulminant) liver failure J Hepatol 662017104710812841788210.1016/j.jhep.2016.12.003 · doi ↗ · pubmed ↗
- 3Mc Phail M.J.W.Farne H.Senvar N.Ability of King’s College Criteria and model for end-stage liver disease scores to predict mortality of patients with acute liver failure: a meta-analysis Clin Gastroenterol Hepatol 142016516525.e 52649993010.1016/j.cgh.2015.10.007 · doi ↗ · pubmed ↗
- 4Koch D.G.Tillman H.Durkalski V.Development of a model to predict transplant-free survival of patients with acute liver failure Clin Gastroenterol Hepatol 1420161199206.e 22708575610.1016/j.cgh.2016.03.046PMC 6055510 · doi ↗ · pubmed ↗
- 5Tavabie O.D.Karvellas C.J.Salehi S.A novel micro RNA-based prognostic model outperforms standard prognostic models in patients with acetaminophen-induced acute liver failure J Hepatol 7520214244343385754710.1016/j.jhep.2021.03.013PMC 10668489 · doi ↗ · pubmed ↗
- 6Kuscuoglu D.Janciauskiene S.Hamesch K.Liver – master and servant of serum proteome J Hepatol 6920185125242970968010.1016/j.jhep.2018.04.018 · doi ↗ · pubmed ↗
- 7Tacke F.Luedde T.Trautwein C.Inflammatory pathways in liver homeostasis and liver injury Clin Rev Allergy Immunol 3620094121860048110.1007/s 12016-008-8091-0 · doi ↗ · pubmed ↗
- 8Rutherford A.King L.Y.Hynan L.S.Development of an accurate index for predicting outcomes of patients with acute liver failure Gastroenterology 1432012123712432288532910.1053/j.gastro.2012.07.113PMC 3480539 · doi ↗ · pubmed ↗