Infrared Imaging Combined with Machine Learning for Detection of the (Pre)Invasive Pancreatic Neoplasia
Danuta Liberda-Matyja, Kinga B. Stopa, Daria Krzysztofik, Pawel E. Ferdek, Monika A. Jakubowska, Tomasz P. Wrobel

TL;DR
This paper introduces an automated method using infrared imaging and machine learning to detect early signs of pancreatic cancer in tissue samples, improving early diagnosis and treatment timing.
Contribution
The novel combination of stain-free FT-IR imaging and machine learning for automated detection of pancreatic neoplasia in a mouse model.
Findings
The model accurately distinguishes normal, benign, and malignant pancreatic tissues at the cellular level.
A streamlined version of the model rapidly identifies pathologically altered regions, including PanINs.
The approach mirrors human PDAC progression using a reliable mouse model with mutant Kras and Trp53 genes.
Abstract
With the challenge of limited early stage detection and a resulting five-year survival rate of only 13%, pancreatic ductal adenocarcinoma (PDAC) remains one of the most lethal cancers. Replacing the high-cost and time-consuming grading of pancreatic samples by pathologists with automated diagnostic approaches can revolutionize PDAC detection and thus accelerate patient admission into the clinical setting for treatment. To address this unmet diagnostic need and facilitate the shift of tissue screening toward automated systems, we combined stain-free histologyspecifically, Fourier-transform infrared (FT-IR) imagingwith machine learning. The obtained stain-free model was trained to distinguish between normal, benign, and malignant areas in analyzed specimens using hematoxylin and eosin stained pancreatic tissues isolated from KC (KrasG12D/+; Pdx1-Cre) or KPC mice (KrasG12D/+;…
Genes, proteins, chemicals, diseases, species, mutations and cell lines named across the full text — each resolved to its canonical identifier and authoritative record.
Click any figure to enlarge with its caption.
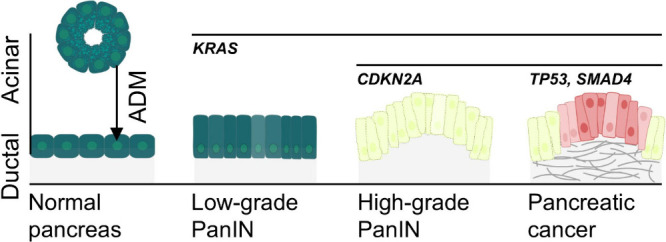 Figure 1
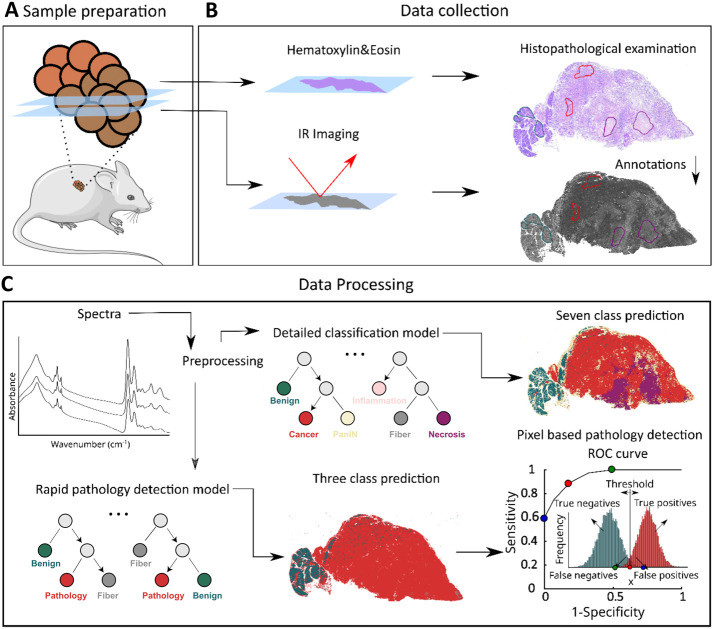 Figure 2
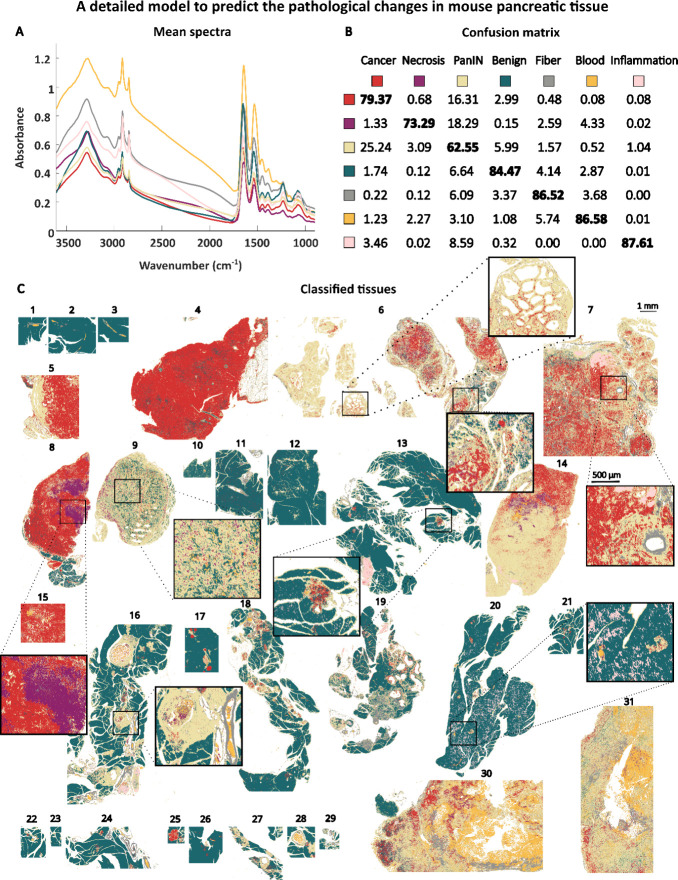 Figure 3
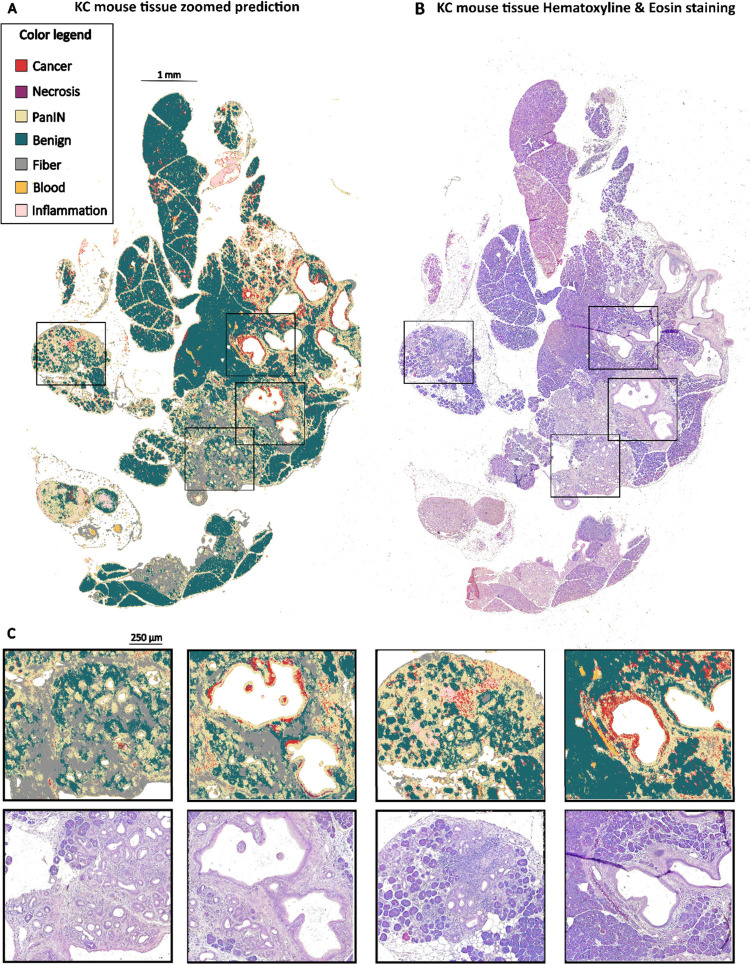 Figure 4
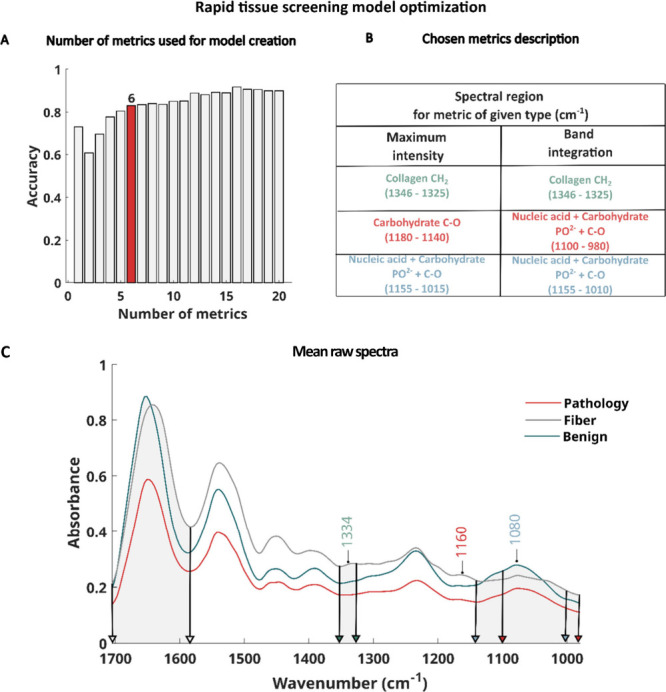 Figure 5
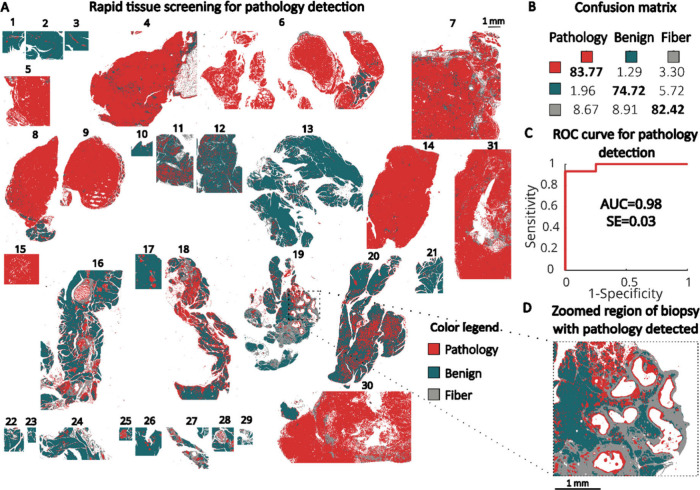 Figure 6
 Figure 7
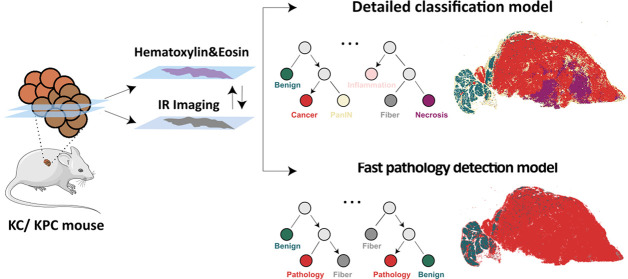 Figure 8
- —Fundacja na rzecz Nauki Polskiej10.13039/501100001870
- —Fundacja na rzecz Nauki Polskiej10.13039/501100001870
- —Narodowe Centrum Nauki10.13039/501100004281
- —Narodowe Centrum Nauki10.13039/501100004281
- —European Regional Development Fund10.13039/501100008530
Peer Reviews
No public reviews on file for this paper yet. If you reviewed it on a platform where reviews are public (OpenReview, ICLR, NeurIPS, ICML), you can paste yours below so the community can read it here.
Videos
No videos yet. Explain this paper in a talk, walkthrough, or lecture? Add one.
Taxonomy
TopicsPancreatic and Hepatic Oncology Research · AI in cancer detection · Liver Disease Diagnosis and Treatment
Pancreatic ductal adenocarcinoma (PDAC) is the most prevalent form of pancreatic cancer, accounting for over 90% of all diagnosed cases. Despite clinical advancements, PDAC remains a deadly disease, with a five-year survival rate of only 13%.? Alarmingly, it is projected to become the second most fatal cancer in the US by 2030. ?,? Detecting pancreatic cancer in its early stages is vital for predicting patient outcomes. According to information from the US cancer surveillance database covering the years 2004–2016, up to 83.7% of those diagnosed with PDAC in the very early stage 1A survive for five years. However, early stage detection is rare, and in stark contrast, the survival rate diminishes to approximately 10% for individuals diagnosed with advanced-stage PDAC.?
In both clinical settings and preclinical studies aimed at testing new therapeutic strategies, the histopathological assessment that differentiates between healthy tissue, premalignant dysplasia, and advanced PDAC – still largely depends on human evaluation. However, the sheer volume of this task, combined with the need to process a large number of samples, highlights the growing need for more automated approaches. These advancements will not only enhance diagnostic precision but also speed up treatment initiation, ultimately improving patient outcomes by ensuring timely and accurate therapeutic interventions.
In recent years, infrared (IR) imaging combined with machine learning has been extensively developed as a method for cancer detection and diagnosis in tissue samples. ?−? ? ? ? Fourier-transform infrared (FT-IR) imaging derives information about the sample’s chemical composition in the form of spectra and images while being nondestructive for the analyzed sample. Based on collected spectra of tissue, components (biomolecules) such as proteins, lipids, nucleic acids, and carbohydrates can be recognized.? Machine learning algorithms serve as a tool for the recognition of pathological changes in tissues based on collected IR data. First, the model is trained on a known and very well-defined set of data assigned to different tissue classes (e.g., benign, and cancerous tissue).? Once the model is properly fitted to the analyzed data by tuning its hyperparameters, predictions on test tissues can be done. Random Forest is a robust machine learning algorithm that is relatively resistant to overfitting. It operates by constructing multiple decision trees during training and combining their outputs to improve predictive accuracy. Additionally, the model can identify which features are the most important in the prediction process. These highly important features can then be utilized to develop a rapid cancer detection model, as demonstrated in our previous research. ?,? For rapid model creation, selected frequencies can be measured using a system equipped with Quantum Cascade Lasers (QCLs). QCLs allow for the measurement of discrete frequencies, significantly reducing measurement time and improving the feasibility of adapting conventional FT-IR technology for clinical applications. ?,?
In our previous study, devoted to human pancreatic tissue classification, we successfully developed an IR imaging-based histopathological machine learning model using 600 needle biopsies, achieving excellent performance (with Area Under the Receiver Operating Curve, AUC, values close to
- on the sample and pixel levels.? We also created a detailed model for detecting and grading premalignant dysplasia in human tissues.? Our research primarily focused on low-grade dysplasia, demonstrating the high potential of this method for detecting and grading premalignant changes in the pancreas. However, to fully understand the progression of precancerous and cancerous conditions, it is essential to utilize mouse-based models that account for specific driver mutations.
The current understanding of PDAC development suggests that it originates from noninvasive precursor lesions arising in the exocrine component of the pancreas, specifically from pancreatic duct cells and acinar cells. ?,? The most common precursor lesion, accounting for up to 90% of PDAC cases is pancreatic intraepithelial neoplasia, PanIN. ?,? PanINs develop due to the accumulation of driver mutations within the exocrine pancreatic epithelia. The most commonly mutated gene is the v-K i-ras2 Kirsten rat sarcoma viral oncogene (KRAS), which is altered in over 90% of PDAC cases. ?,?
KRAS mutation alone is usually insufficient to trigger progression to invasive disease; therefore additional mutations in genes such as in tumor protein P53 (TP53), cyclin-dependent kinase inhibitor 2A (CDKN2A), or SMAD protein family member 4 (SMAD4) are typically required for the disease to advance ?,?−? ? (Figure).
In this study, we employed the well-known mouse model of PDAC, KPC mice (Kras^G12D/+^; Trp53^R172H/+^; Pdx1-Cre), which accurately mirrors the initiation and progression of the human disease.? In this model, the Pdx1-guided Cre recombinase activates the expression of mutant Kras (Kras^G12D/+^) and Trp53 (Trp53^R172H/+^) specifically in the pancreas, leading to neoplasm formation and subsequent progression to PDAC within 2–10 months of the mouse lifespan. Additionally, we used mice bearing only the Kras mutation (Kras^G12D/+^; Pdx1-Cre), which develop various stages of PanINs without progressing to PDAC.
Using infrared imaging combined with machine learning (Figure), we have developed a detailed classification model capable of recognizing normal pancreatic tissue, PanINs, cancer, blood, necrosis, inflammation, and collagen fibers (Figures and ?). We also proposed a model for rapid pathology detection, featuring a reduced number of spectral variables, designed to differentiate between normal pancreatic tissue and pathologically altered tissue (that is PanINs alone or PanINs with invasive cancer), as well as fibrotic regions (Figures and ?).
Results and Discussion
Pancreatic tissue sections from KC or KPC mice, 2–10 months old (FigureA) were stained with hematoxylin and eosin (H&E) and subjected to histopathological examination (FigureB). Adjacent sections were imaged using IR in transflection mode (FigureB). Histopathological annotations made on the full H&E slides image were manually transferred to the IR image to define regions of interest (ROIs, FigureB). The pixels–representing spectra–within the ROIs were then preprocessed (spectral metrics creation step?) and used for Random Forest classification (FigureC).? As mentioned in the introduction, the initial detailed tissue classification model was developed based on seven tissue classes: benign (normal/non-neoplastic epithelial pancreatic tissues), cancer (PDAC cells, which may exhibit both epithelial and mesenchymal characteristics), PanIN (precursor lesions to invasive pancreatic cancer), inflammation, fiber, blood, and necrosis (FigureC). This classification was done to evaluate the performance of the complex model at the pixel level, as assessed by a confusion matrix. We also evaluated the potential of our model for future translation to a fast quantum cascade laser (QCL) system (FigureC). ?,? To this end, we created a simplified three-class model for rapid cancer detection. The model’s prediction ability was evaluated using a ROC curve, calculated based on different thresholds (FigureC). In this study, the decision criterion x, which determines the optimal threshold for classifying mouse tissue as normal or cancerous, was based on the number of pathology-class pixels identified for each mouse (represented by the red histogram in FigureC). The area under the ROC curve (AUC) metric was used to assess the model’s diagnostic accuracy, with an AUC of 1 indicating the perfect classification of all tissues.?
Detailed Classification Model
In Figure, we presented the results from a detailed, seven-class model classification, detecting pathological changes in pancreatic tissues from KC and KPC mice. FigureA displays the raw mean spectra calculated for the analyzed tissue classes, including cancer (red), necrosis (violet), PanIN (yellow), benign (green), fiber (gray), blood (orange), and inflammation (pink). Differences between the preprocessed mean spectra for the benign, cancerous, and PanIN tissue classes are provided in Figure S2. The most prominent differences in absorbance values can be observed in protein regions, Amide A+B 3600–3000 cm^–1^, Amide I 1762–1585 cm^–1^, and Amide II 1585–1473 cm^–1^ (Figure S2D).
The confusion matrix allows us to identify which classes the model finds the most challenging to differentiate, indicating that their chemical compositions are relatively similar. In the confusion matrix shown in FigureB, the cancer class was most frequently misclassified as PanIN, and vice versa. This is not particularly surprising given the high biochemical similarities between these two classes, as PanIN lesions are direct precursors to cancer. Mutated PanIN cells subsequently acquire additional mutations and gradually transform into cancer cells, which is reflected by the stochastic classification of some pixels as cancer (FigureC, tissue no. 6, left zoom). As PDAC progresses, the cancer cell compartment becomes increasingly prominent (FigureC, tissue no. 4, 5, 6 (right zoom), 7, 8, 14, 15).
Importantly, the number of pixels classified as cancer in tissue predominantly composed of PanINs could provide additional information for PanIN grading. For example, in the classification of tissue no. 6 (FigureC, left zoom) we observed pathological changes, the majority of which were classified as PanIN, with only a few pixels identified as cancer. Indeed, the histopathological annotations confirmed that this area was a low-grade PanIN, characterized by columnar morphology, mucin-filled cytoplasm, and loss of polarity.? The right zoom of tissue no. 6 shows ducts primarily predicted as cancerous, surrounded by PanINs. This area was annotated as high-grade PanIN/carcinoma in situ, characterized by complete loss of cell polarity and severe nuclear atypia.? Current medical guidelines suggest monitoring low-grade PanINs while recommending surgical removal for high-grade lesions. Therefore, rapid histological identification of high-grade PanINs could aid preventive removal of the lesion before the development of cancer. ?,?
In general, PanINs were well classified, as demonstrated in predictions for tissues no. 6, 16, 19, 27, and 29. However, as already shown in the confusion matrix, the cancer and PanIN classes were often misclassified. For example, tissues 9, 14, 30, and 31, while histologically classified as cancerous, were predicted as PanINs by the machine learning model. Since our model was trained on only 31 sections, it is possible that the data set contained an insufficient representation of tumor samples, particularly with regard to different tumor types, including a limited number of well- and poorly differentiated tumors. Incorporating a larger number of samples into the model would enhance its robustness to sources of variance unrelated to tissue chemical changes, thereby improving its predictive power and accuracy. A larger data set would strengthen the model’s ability to classify Langerhans islets, differentiate between low- and high-grade PanINs, or distinguish different tumor types. However, creating such a robust model would significantly extend the overall analysis time due to the increased measurement duration and calculational complexity. Additionally, it is important to note that the histopathological analysis and IR measurement were performed on two adjacent tissue slices, not the same one, which may have resulted in slight histological differences, hence the misclassification. Nonetheless, in the remaining tissues, the cancer class was classified correctly (PDAC tissue no. 4–8, and 15).
The healthy exocrine pancreas was correctly predicted in tissues from (i) control animals without Kras ^ G12D ^ expression (Kras^+/+^; Pdx1-Cre), tissue no. 1–3, 17; (ii) KC or KPC animals that had not developed significant pathological changes, tissues no. 10–12, 20–24, 26, and (iii) KC or KPC mice in areas surrounding low-grade PanINs, tissues no. 13, 16, 18–20.
Importantly, the seven-class model encompassed not only the presence of cancer cells but also other key features of PDAC such as necrosis, inflammation (indicated by immune cell infiltration), and the extent of fibrosis, all of which are pivotal factors in clinical assessment.
Necrosis, typically observed in poorly vascularized pancreatic tumors, was detected in tissues no. 8 and 14. Collagen fibers were accurately classified both in the pancreatic tumor microenvironment (tissue no. 7, 19, 30, 31) and in blood vessels (zoom on tissue no. 7). Immune cell infiltration, for example in tissue no. 7, was classified with the highest accuracy (87.61% in the confusion matrix, FigureB). Focal infiltration
- prominent regions of tissue identified as infiltrated by the immune cells, were detected in tissues no. 13, 16, and 19. Furthermore, we also detected other histological features of pancreatic tumors based on our previous classifications, such as hemorrhagic necrosis. Hemorrhagic necrosis, present in tissues no. 30 and 31, was characterized by the presence of blood within PanIN/cancer tissues. All the above classifications were consistent with histological annotations from H&E staining.
Importantly, we were unable to classify Langerhans islets as a separate class in our model. Langerhans islets were instead classified as cancer (for example, red areas present between exocrine lobules in tissue no. 17). It is not entirely clear why this misclassification persisted. One possible explanation could be the biochemical similarities between the two classes; alternatively, this may well be due to the low representation of Langerhans islets in the training data set used to build the model. However, the overall percentage of Langerhans islets between the lobules is relatively low (1.12 ± 0.32 [%]?) and does not influence model prediction ability on the tissue level.
In summary, our approach demonstrated significant promise, especially considering that we trained the classifier with only 31 pancreatic sections (detailed information provided in the Supporting Information). The overall pixel-level prediction accuracy reached 0.77, which is a commendable result, particularly given that the majority of analyzed classes exhibited true positive rates nearing 80%.
For example, in tissue no. 19, representing a section from a KC mouse, six out of seven classes (except necrosis) can be detected (Figure).
Our model first classified PanINs scattered throughout tissue no. 19. Historically, ductal cells were considered the primary source of PanIN lesions. However, further studies suggest that acinar cells can undergo acinar-to-ductal metaplasia (ADM), acquiring progenitor-like characteristics of the early duct cells (Figure). If malignantly transformed owing to the presence of the oncogenic Kras, these cells serve as the initial site of PanIN formation. ?,?,? Indeed, tissue no. 19 exhibited high levels of ADM. Regions with a high abundance of ADM were classified as PanINs, while areas with scattered ADM – as normal acinar tissue (FigureC in the third column of zoomed pictures).
Figure shows numerous PanINs, with some cancerous areas in the largest ducts (FigureC, second and fourth columns). This finding is particularly interesting, as the analyzed pancreas was sourced from a KC mouse, which is not typically expected to spontaneously develop pancreatic cancer.? Of course, a finite probability exists that this particular animal had developed pancreatic cancer due to the stochastic nature of genetic mutations. However, it is also known that in Kras ^G12D^-mutated cells, senescence is induced, which halts further carcinogenesis.? For cancer initiation and progression, additional mutations such as Trp53 or p16INK4A inactivation, are required.? Therefore, it is possible that in our classification we detected senescent cancer cells.
As previously described, our model successfully classified collagen fibers. Fibrosis is a widespread pathological condition that results from prolonged inflammation in organs and soft tissues. Globally, fibrosis is estimated to contribute to nearly 50% of deaths. ?,? In the pancreas, fibrosis is a hallmark not only of pancreatic cancer but also of pancreatitis. ?,? Although tissue no. 19 primarily exhibits precancerous characteristics, several fibrotic areas were also identified (FigureC, first and second columns). Since fibrosis is a consequence of prolonged inflammation, the accurate detection of inflamed regions, as demonstrated by our model (FigureC, third column), plays a significant role in both diagnostics and potential preventive strategies. This ability to identify inflammation highlights the broader applicability of our models, which could be further adapted to detect and monitor various pancreatic pathologies.
Rapid Pathology Detection Model
To create a rapid pathology detection model, we found the smallest possible number of metrics that provided high pixel level accuracy. Information about the importance of metrics for Random Forest classification was derived from the model based on fingerprint region (FigureC). We then developed classification models with an increasing number of metrics (listed in Table S3), according to their importance - starting with the most important one. Leave-one-out cross-validation? was applied for confusion matrix calculation, similar to the detailed model described above. FigureA shows accuracy values for models created with different numbers of metrics. Six metrics were identified as providing the best model performance while maintaining a low feature count of 110. The model achieved high accuracy values, and in comparison, with models using 4 and 5 metrics, the predicted images (Figure) were of very good quality. FigureB presents a table of regions used for metrics creation, also shown graphically on the spectra in FigureC, with a description of molecular content corresponding to given bands representing vibration of given functional groups. These spectral regions listed define tissue components crucial for distinguishing the three analyzed tissue classes (pathology, fiber, benign). For example, the spectral region 1346–1325 cm^–1^ corresponds to collagen content, with the 1337 cm^–1^ band linked to vibrations of prolines responsible for collagen structuring.? The 1180–1140 cm^–1^ region, with a maximum at 1160 cm-1, corresponds to C–C and C–OH vibrations. Changes in intensity in this band have been associated with glycosylation and carbohydrate accumulation during cancer progression.? The DNA/RNA spectral region (1180–980 cm^–1^) with a maximum at 1080 cm^–1^ form PO^2–^ phosphate group vibrations with contribution from glycogen (1030 cm-1) and other carbohydrates (1155 cm^–1^) also plays an important role in the classification. ?,? As reported by Kondepati et al. changes in the DNA/RNA region can be associated with structural alterations of the DNA in pancreatic cancer.? Additionally, glycogen level variations have also been linked to cancer development, as seen in cervical cancer, where lower glycogen content was observed in neoplastic tissue compared to normal tissue.?
To calculate the six selected metrics based on the analyzed regions, including Amide I for normalization, 110 frequencies must be measured using the rapid QCL system to achieve the best possible measurement performance. According to the specifications of a commercially available QCL system, measuring the fingerprint region with a QCL microscope would reduce measurement time by approximately 13-fold compared to the optimized Bruker FT-IR measurements performed in this study (a single measurement tile of 64 × 64 μm takes about 13 s), using the same objective magnification and detector size. Moreover, the QCL system allows for measurements with a broader field of view, utilizing a focal plane array (FPA) detector 300 × 300 pixels, and a 3.5× magnification objective. With these parameters, a tissue section of approximately 2 × 2 cm could be measured in just 6 min.
To accelerate calculation time in our rapid pathology detection model, we not only reduced the number of metrics but also limited the model to 25 trees. Additionally, tissues were measured on cost-effective low-e slides in transflection mode, to minimize operational expenses. The potential of this approach for clinical applications was explored in our previous study.?
The three-class rapid model presented in FigureA enables fast screening of pathologically altered tissues (e.g., no. 4, 6–9, 14–16, 18–20, 30, 31) from normal tissues (e.g., no. 1–3, 10–12). Importantly, in this model, the pathology group includes both PanINs and cancer regions (FigureD). Our model achieved True Positive Rate (TPR) values at the pixel level of 84% and 82% for the pathology and healthy classes, respectively. Performance on the tissue level was evaluated based on the ROC curve and AUC value, which is a threshold criterion based on the number of pixels classified as pathology for each sample. Samples can be classified as either healthy or pathological depending on whether they exceeded or fell below this threshold, determined using a control group of samples. After prediction image filtering using a majority filter, the model achieved an AUC value of 0.98, where a value of 1 indicates perfect classification of all tissues. The calculated standard error (SE) suggests potential reproducibility in classifying new samples.
Conclusions
This study presents two models for detecting preinvasive and invasive pancreatic neoplasias in mouse pancreatic tissue. Our detailed seven-class model distinguishes normal tissue, premalignant dysplasia (PanINs), and cancerous regions. Moreover, we were able to classify blood, infiltrated, fibrotic, and necrotic regions. The ability to classify these regions using IR opens avenues for further exploration of differences between these classes, potentially leading to the discovery of novel biomarkers or therapies, not only for pancreatic cancer but also for other cancers and fibrotic diseases. Furthermore, this model can be used as a tool to study pancreatic cancer development in mouse models. In the future, the seven-class model could be expanded even further to include additional grading of PanINs or pancreatic cancer subtypes.
The three-class “rapid” model was designed to differentiate tissues with pathological regions from normal tissues, achieving a very high AUC value close to 1, highlighting the potential of this approach. This model could accelerate diagnosis by excluding completely healthy tissues from further analysis, even before histological staining.
Our models demonstrate the potential of IR for faster and more automated diagnosis of PDAC patients.
Materials and Methods
Selected Chemicals and Consumables
Eosin with phloxine, and hematoxylin, were purchased from Sigma-Aldrich/Merck, USA; KAPA Fast Genotyping Mix was purchased from Roche Diagnostics GmbH, Germany; ExToPCR and Genomic Mini kits were purchased from A&A Biotechnology, Poland; TAE buffer was purchased from Bio-Rad, USA.
Experimental Mice
The KPC (LSL-Kras^G12D/+^; LSL-Tp53^R172H/+^; Pdx1-Cre) and KC (LSL-Kras^G12D/+^; Pdx1-Cre) breeding pairs (the generous gifts of Dr. Catherine Hogan) were transferred from Cardiff University to the institutional animal facility at Jagiellonian University in 2018 and have been bred there since. These mice were maintained in a controlled environment with a 12-h light/dark cycle, housed individually or in groups of up to five in cages equipped with environmental enrichment (nesting material, wooden gnawing sticks). They had ad libitum access to a standard rodent diet and water. All animal-related procedures adhered to the ARRIVA guidelines.? Some KPC mouse samples were collected as part of another experiment, for which approval no. 113/2020 was obtained from the II Local Ethics Committee for Animal Experimentation in Kraków, Poland.
Pancreatic tissues and tumors were collected from 19 mice up to 14 months of age, including both males and females (former breeders included), with various combinations of Kras^G12D/+^ and Tp53^R172H/+^ mutations. Mice were humanely euthanized via cervical dislocation or CO_2_ overdose. Mouse ID, genotype, and age are available in the table in Figure S1.
Mouse Genotyping
Mice were genotyped within the first month of life using the standard genotyping protocol, as previously published.? Briefly, DNA was extracted from tail tips using ExToPCR or Genomic Mini kits (A&A Biotechnology, Poland), following the manufacturer’s instructions. PCR reactions were performed using KAPA Fast Genotyping Mix (Roche Diagnostics GmbH, Germany) and specific primers.?
Histology
The normal pancreatic and tumor tissues were fixed in formalin for 48 h at room temperature, then, dehydrated and embedded in paraffin. The tissues were cut into 4 μm sections and stained with hematoxylin and eosin (H&E) using our standard staining protocol. ?,? Tile scans of the whole tissue sections were obtained using a Leica DMi8 light microscope (Leica, Germany) and are presented in the Figure S1. Histopathological assessment was conducted based on the tile scans and previously published criteria. ?,?
Fourier Transform Infrared Imaging
Fourier Transform Infrared Imaging was performed using a Bruker Vertex 70v spectrometer, coupled with a Hyperion 3000 microscope and a 64 × 64 Focal Plane Array (FPA). Tissue sections were placed on low-e slides and measured in transfection mode over the 3850–900 cm^–1^ range, with 8 cm^–1^ spectral resolution and zero filling factor of 1. The sample and background were measured with 4 and 64 coaveraged scans, respectively. A 15× objective was utilized with a numerical aperture equal to 0.4, giving a projected pixel size of 2.7 μm. The IR image of measured tissues is presented in Figure S4.
Data Preprocessing
Raw spectra were denoised using the Minimum Noise Fraction (MNF) algorithm, with 20 bands identified as optimal for reconstruction.? Given the absence of a scattering correction for transflection data, there is a slight risk that edge effects could impact classification predictions near tissue borders. However, these edge pixels were excluded from model training and validation. In the next step, 42 spectral regions (listed in Table S1) were selected for local baseline correction, 42 spectral regions (Table S1) were chosen, and the Rubber band Band method was applied locally. For each chosen selected region, three spectral metrics were calculated, spectral band’s: maximum, center of gravity, and integration. Those values were in the next step normalized to corresponding metrics of the Amide I band for size effect removal. The final number of features called further metrics, was equal to 123.
Random Forest Classification
Pixels were chosen for model creation and validation based on histopathological annotations–regions of interest (ROIs) were annotated on IR images. The model was validated on pixel and mouse levels. On the mouse level, we applied cross-validation to leave one mouse out, it gave us a number of folds equal to the number of mice–19. On the pixel level, pixels from mice assigned to the model test were randomly chosen from ROIs for Random Forest classifier training. All pixels coming from the test set were used for model prediction power assessment–confusion matrix calculation. Two models were created: a detailed model for PanIN classification (based on 50 trees), and a rapid model for rapid pathology detection (based on 25 trees). To establish the importance metrics for the rapid pathology model, a model with 100 trees was first trained (Supporting Information, Figure S7). For the final rapid pathology detection model, the six metrics with the highest importance were selected for model creation (Table S3). The predictive power of the models was evaluated with confusion matrixes, and for the rapid model, additionally, the Receiver Operating Characteristic (ROC) curve and the area under the curve (AUC) value were used. The standard deviation from AUC (SE) was calculated based on the formulas provided in the Supporting Information. The predicted image from the rapid model was filtered with a majority filter with a window size of 5.
Supplementary Material
The reference list from the paper itself. Each links out to its DOI / PubMed record.
- 1Siegel R. L.Giaquinto A. N.Jemal A.Cancer statistics, 2024 CA Cancer J. Clin.202474124910.3322/caac.2182038230766 · doi ↗ · pubmed ↗
- 2Siegel R. L.Miller K. D.Wagle N. S.Jemal A.Cancer statistics, 2023 CA Cancer J. Clin.202373174810.3322/caac.2176336633525 · doi ↗ · pubmed ↗
- 3Rahib L.Smith B. D.Aizenberg R.Rosenzweig A. B.Fleshman J. M.Matrisian L. M.Projecting cancer incidence and deaths to 2030: the unexpected burden of thyroid, liver, and pancreas cancers in the United States Cancer Res.20147429132110.1158/0008-5472.CAN-14-015524840647 · doi ↗ · pubmed ↗
- 4Blackford A. L.Canto M. I.Klein A. P.Hruban R. H.Goggins M.Recent Trends in the Incidence and Survival of Stage 1A Pancreatic Cancer: A Surveillance, Epidemiology, and End Results Analysis J. Natl. Cancer Inst.20201121162116910.1093/jnci/djaa 00431958122 PMC 7669234 · doi ↗ · pubmed ↗
- 5Diem M.Ergin A.Mu X.Spectral histopathology of the lung: A review of two large studies J. Biophotonics.201912 e 20190006110.1002/jbio.20190006131177622 · doi ↗ · pubmed ↗
- 6Wrobel, T. P. ; Kwak, J. T. ; Kadjacsy-Balla, A. ; Bhargava, R. High-definition Fourier transform infrared spectroscopic imaging of prostate tissue; Gurcan, M. N. , Madabhushi, A. , Eds.; SPIE Medical Imaging, 2016; pp 97911 D.10.1117/12.2217341. · doi ↗
- 7Liberda D.Hermes M.Koziol P.Stone N.Wrobel T. P.Translation of an esophagus histopathological FT-IR imaging model to a fast quantum cascade laser modality J. Biophotonics.202010.1002/jbio.20200012232406973 · doi ↗ · pubmed ↗
- 8Mittal S.Wrobel T. P.Walsh M.Kajdacsy-Balla A.Bhargava R.Breast cancer histopathology using infrared spectroscopic imaging: The impact of instrumental configurations Clinical Spectroscopy.2021310000610.1016/j.clispe.2021.100006 · doi ↗