Understanding local determinants of dengue: a geographically weighted panel regression approach in Yogyakarta, Indonesia
Marko Ferdian Salim, Tri Baskoro Tunggul Satoto, Danardono

TL;DR
This study uses a geographically weighted regression model to understand how local factors affect dengue outbreaks in Yogyakarta, Indonesia, from 2017 to 2022.
Contribution
The study introduces a GWPR approach to evaluate spatial variability in dengue determinants, revealing localized predictors for targeted prevention.
Findings
The GWPR model showed strong overall explanatory power (Adjusted R2 = 0.516) with significant spatial heterogeneity in predictor influence.
High-dengue-burden sub-districts like Kasihan and Banguntapan had stronger associations between dengue and key predictors such as rainfall and land use.
Sub-districts like Sedayu and Kalibawang showed lower model performance, suggesting the need for additional factors like sanitation and vector control.
Abstract
Dengue remains a major public health concern in tropical regions, including Yogyakarta, Indonesia. Understanding its spatiotemporal patterns and determinants is crucial for effective prevention strategies. This study explores the spatiotemporal determinants of dengue incidence and evaluates the spatial variability of predictors using a geographically weighted panel regression (GWPR) approach. This ecological study applied a spatiotemporal approach, analyzing dengue incidence across 78 sub-districts in Yogyakarta from 2017 to 2022. The dataset included meteorological variables (rainfall, temperature, humidity, wind speed, and atmospheric pressure), sociodemographic data (population density), and land-use characteristics (built-up areas, crops, trees, water bodies, and flooded vegetation). A GWPR model with a Fixed Exponential kernel was used to assess local variations in predictor…
Genes, proteins, chemicals, diseases, species, mutations and cell lines named across the full text — each resolved to its canonical identifier and authoritative record.
Click any figure to enlarge with its caption.
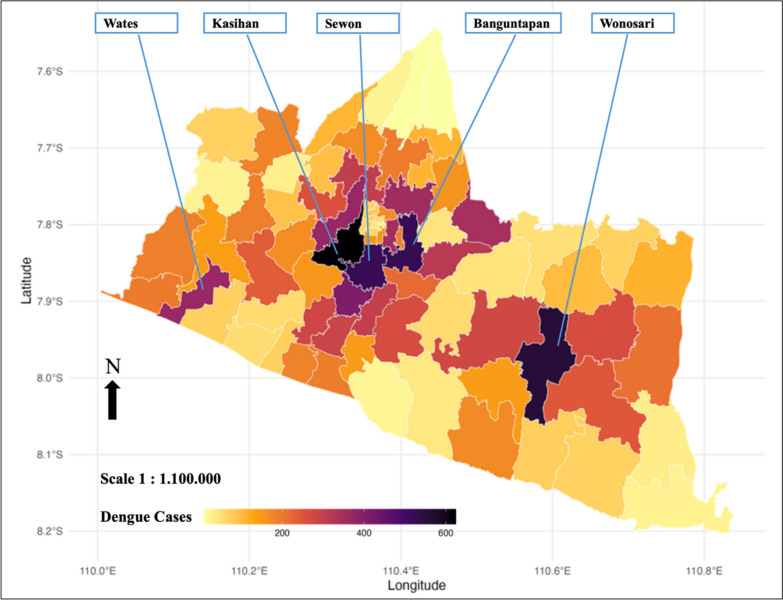 Figure 1
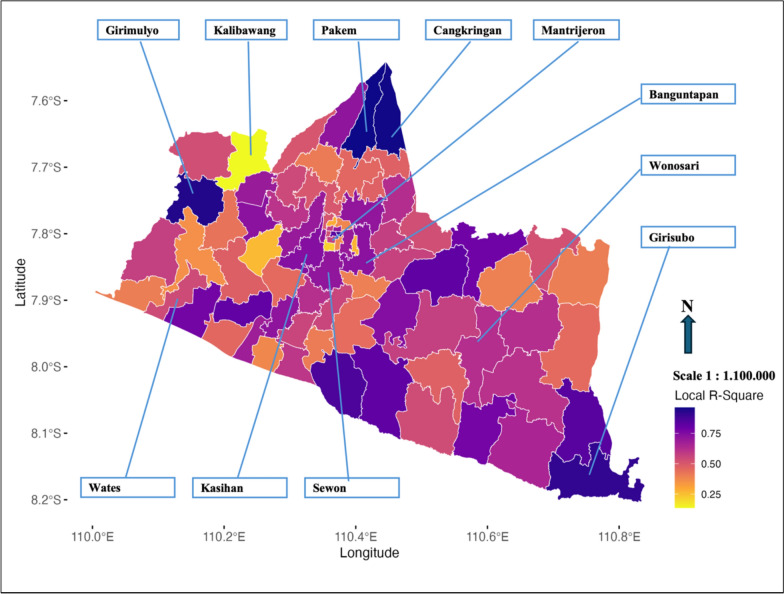 Figure 2
Peer Reviews
No public reviews on file for this paper yet. If you reviewed it on a platform where reviews are public (OpenReview, ICLR, NeurIPS, ICML), you can paste yours below so the community can read it here.
Videos
No videos yet. Explain this paper in a talk, walkthrough, or lecture? Add one.
Taxonomy
TopicsMosquito-borne diseases and control · Dengue and Mosquito Control Research · COVID-19 epidemiological studies
Introduction
Dengue fever is an infectious disease that poses a significant public health challenge in tropical and subtropical regions, particularly in Indonesia [1]. The transmission of the dengue virus by Aedes aegypti and Aedes albopictus mosquitoes has led to a global surge in cases, with an estimated 390 million infections per year, of which approximately 96 million cases exhibit clinical manifestations [2]. Southeast Asia, including Indonesia, is the region with the highest dengue burden, where environmental factors, population density, and climate change contribute to the increased transmission of the dengue virus [2–5].
In Indonesia, dengue fever has been reported since 1968 and remains a public health concern, with fluctuating transmission patterns observed annually. The Special Region of Yogyakarta is classified as an endemic area, with an incidence rate (IR) of 29.9 per 100,000 population, exceeding the national standard [6]. Over the past five years, dengue cases in the Special Region of Yogyakarta have shown significant fluctuations, peaking in 2019 and 2020, with more than 3000 cases per year [7]. Various environmental, climatic, and sociodemographic factors have been linked to the rising incidence of dengue fever; however, studies that simultaneously account for spatiotemporal dynamics remain limited [8, 9]. Most predictive models, such as ARIMA, SARIMA, support vector machines (SVM), artificial neural networks (ANN), and generalized additive models (GAM), primarily focus on temporal trends, neglecting spatial heterogeneity [10–12]. However, dengue cases tend to cluster in both space and time, making spatial analysis crucial for understanding disease transmission patterns [8].
Despite increasing evidence of the impact of environmental and climatic factors on dengue transmission, existing models often fail to account for localized variations [13, 14]. Many studies have predominantly relied on global or temporal models, resulting in generalized predictions that may not be effective for region-specific interventions [15, 16]. Since dengue transmission is shaped by complex interactions between climate, environment, and human activity, there is an urgent need for adaptive approaches that incorporate these dynamic factors [17–23]. In Indonesia, where climate variability continues to rise and dengue outbreaks remain unpredictable, spatially informed risk assessments could enhance early detection and facilitate targeted control measures [24].
The GWPR approach addresses spatial and temporal heterogeneity by allowing regression coefficients to vary across geographic locations, enabling localized analysis of relationships between predictors and dengue incidence [9]. Unlike global models, GWPR provides adaptive estimations and accommodates hierarchical structures, recognizing the influence of both temporal and region-specific factors [8]. This study applies GWPR to explore the spatiotemporal determinants of dengue fever incidence and evaluate the spatial variability of predictors in the Special Region of Yogyakarta. Specifically, the model analyzes the influence of weather factors (rainfall, temperature, humidity, atmospheric pressure, wind speed), sociodemographic factors (population density), and environmental factors (built area, crops area, trees area, water area, and flooded vegetation area) on dengue transmission dynamics. The objective of this study is to gain a deeper understanding of the spatial and temporal patterns of dengue cases, providing insights into localized variability and supporting data-driven prevention and control strategies. By utilizing a GWPR-based approach, this research aims to enhance early detection of dengue risk, enabling more effective and targeted interventions to reduce morbidity and mortality in the region.
Methods
This study was conducted in the Special Region of Yogyakarta, Indonesia, situated between 110°00′–110°50′E longitude and 7°33′–8°12′S latitude, covering an area of 3186 km^2^. This region consists of four districts (Bantul, Gunung Kidul, Kulon Progo, and Sleman) and one municipality (Yogyakarta City). With a tropical monsoon climate, the area experiences distinct wet and dry seasons, which significantly influence dengue transmission dynamics. The region’s heterogeneous landscape, comprising densely populated urban centers and geographically diverse rural areas, makes it an ideal setting for a spatiotemporal analysis of dengue incidence.
This study employed a retrospective observational analytic design within an ecological spatiotemporal framework. The analysis utilized panel data from 78 sub-districts, recorded monthly from January 2017 to December 2022. Secondary data sources included dengue surveillance reports from Primary Health Centres and the District Health Office, meteorological data from NASA’s POWER Data Access Viewer, sociodemographic data from BPS-Statistics Indonesia, and land-use data derived from Sentinel-2 satellite imagery through ESRI’s Land Cover Explorer.
To enable a comprehensive spatiotemporal analysis, this study compiled panel data integrating both spatial and temporal dimensions. The dependent variable was dengue incidence, defined as the total number of monthly dengue cases per sub-district. Independent variables included climatic factors (rainfall, including lag effects for 1, 2, and 3 months; temperature; relative humidity; wind speed; and atmospheric pressure), sociodemographic factors (population density), and environmental factors (built area, crops area, trees area, water area, and flooded vegetation area). Rainfall lag variables (Lag 1, Lag 2, and Lag 3) were included to capture the delayed effects of rainfall on mosquito breeding and dengue transmission. Lag 1 reflects initial larval development, Lag 2 represents adult mosquito emergence, and Lag 3 accounts for virus incubation. These lags improve the model’s ability to assess the correlation between rainfall and dengue incidence over time [25].
The dataset underwent a preprocessing stage, including data cleaning, normalization, temporal alignment, and spatial standardization, to ensure consistency across variables. To assess potential collinearity among predictor variables, a multicollinearity test was performed using the variance inflation factor (VIF). Variables with VIF values greater than 10 were considered indicative of multicollinearity and subject to further evaluation or removal from the model.
The GWPR method extends geographically weighted regression (GWR) by incorporating spatial and temporal dimensions, allowing for localized parameter estimation across time. Unlike global models, GWPR captures spatial heterogeneity, enabling the relationship between dengue incidence and predictor variables to vary across locations. The Fixed Exponential kernel was selected based on model evaluation criteria (RSS, Adjusted R^2^, AIC, and AICc), demonstrating superior performance over other kernels. GWPR was also chosen over machine learning-based spatial models (e.g., spatial random forests, deep learning) due to its interpretability and ability to explicitly model spatially varying relationships. While machine learning methods excel in predictive accuracy, they lack explainability in how risk factors influence dengue incidence across different locations. Given the study’s focus on understanding localized determinants rather than just prediction, GWPR provides a more effective approach to identify spatiotemporal patterns, offering valuable insights for targeted dengue control strategies.
Kernel functions in GWPR define the spatial weighting scheme based on the distance between observations. The most used kernel functions include Gaussian, Bisquare, and Exponential, each offering distinct weighting characteristics. The Gaussian kernel applies a continuously decreasing weight function, whereas the Bisquare kernel assigns weights that sharply drop beyond a certain distance threshold. The Exponential kernel, on the other hand, allows for a gradual decrease in weights without an absolute cutoff, making it particularly useful for capturing smooth spatial variations. Furthermore, bandwidth selection is crucial in GWPR, with two main approaches: fixed bandwidth and adaptive bandwidth. A fixed bandwidth maintains a consistent spatial extent for weighting observations, which is suitable for datasets with uniform spatial distributions. In contrast, an adaptive bandwidth adjusts the range dynamically based on data density, making it more appropriate for highly variable spatial structures. The choice of fixed or adaptive bandwidth impacts the model’s sensitivity to local variations, affecting how well spatial patterns in dengue incidence are captured [26–28].
Given the study’s objective—to identify localized determinants of dengue incidence rather than solely optimizing predictive accuracy—GWPR was deemed the most appropriate method. Statistical analyses were conducted in R Studio using the “GWmodel” package for GWPR.
Results
Descriptive statistic
This study recorded 13,283 dengue cases in the Special Region of Yogyakarta from 2017 to 2022, with an average incidence of 2.365 cases per sub-district per month, ranging from 0 to 82 cases. Weather conditions during the study period included an average rainfall of 210.12 mm, a temperature of 25.82 °C, relative humidity of 83.98%, wind speed of 3.54 m/s, and atmospheric pressure of 98.91 kPa. Population density varied significantly, averaging 3651 people/km^2^, with a range of 252 to 22,956 people/km^2^. Environmental factors also exhibited variation, with built areas averaging 1574.89 hectares, tree areas 1082.10 hectares, crop areas 819.60 hectares, and smaller water bodies at 27.17 hectares (Table 1).Table 1. Descriptive statistics resultsVariablesSumMeanMinMaxSDDengue cases13,2832.3650824.422Weather factors Rainfall1,180,014.4210.1160796.29154.327 Rainfall Lag 11,170,996.5208.5100796.29153.282 Rainfall Lag 21,168,922.1208.1410796.29152.565 Rainfall Lag 31,174,864.3209.1990796.29153.707 Average temperature145,009.3625.82021.1528.151.147 Relative humidity471,612.5183.97660.2592.124.630 Wind speed19,8643.5371.525.450.909 Atmospheric pressure555,462.198.90793.88100.731.559Sociodemographic factors Population density20,501,5423,650.559525222.9565091.546Environmental factors Built area8,844,599.61,574.89364.0254303.079997.912 Crops area4,602,894.4819.60406282.976931.104 Water area152,569.1327.1670324.13750.070 Trees area6,077,072.51082.09909069.3821665.042 Flooded vegetation area4236.330.754047.96403.529
Figure 1 illustrates the spatial distribution of dengue cases, which demonstrates significant variation across sub-districts. The highest concentrations are observed in central areas such as Kasihan, Banguntapan, and Sewon, characterized by high population densities and better accessibility. Conversely, regions like Wonosari in the east and Wates in the west highlight the influence of local factors, including climate and land use, on case numbers.Fig. 1. Spatial distribution of total dengue incidence in 2017–2022
Analysis of geographically weighted panel regression (GWPR)
The GWPR analysis was conducted to examine the spatial and temporal influences on dengue incidence in the Special Region of Yogyakarta. This approach allows for the identification of local variations in the relationships between dengue cases and climatic (rainfall, temperature, humidity, wind speed, atmospheric pressure), sociodemographic (population density), and environmental factors (land-use types). Using panel data from 78 sub-districts over 72 months (5616 observations), this study initially employed classical panel data regression to determine the most suitable model. The multicollinearity test (Table S1) confirmed that all predictor variables had VIF values below 10, indicating no significant collinearity issues. Therefore, all selected predictors were retained in the model for further analysis. Model selection tests (Table S2), including the Chow Test, Hausman Test, and Breusch–Pagan LM Test, were performed to compare the Common-Effect Model (CEM), Fixed-Effect Model (FEM), and Random-Effect Model (REM).
The results indicated that the FEM is the most appropriate model, as it effectively captures spatial and temporal variations. The Chow Test confirmed FEM’s superiority over CEM (p-value < 0.0001), while the Hausman Test further supported FEM over REM (p-value < 0.0001), emphasizing its ability to account for fixed individual effects across sub-districts. The Breusch–Pagan LM Test showed that REM is preferable to CEM, reinforcing the inadequacy of CEM for this dataset. These findings highlight the importance of FEM in analyzing dengue dynamics and provide a foundation for advanced spatial modeling through GWPR to better understand the localized impact of predictive factors on dengue transmission.
The statistical tests (Table S3) revealed violations of normality, autocorrelation, and heteroskedasticity in the fixed-effects model (FEM), indicating its limitations in capturing dengue transmission dynamics. While FEM was selected as the best classical panel data regression model (based on Chow, Hausman, and Breusch–Pagan LM Tests), its assumptions were significantly violated (p < 0.0001), suggesting that a global model is insufficient for addressing spatial heterogeneity. To overcome this, GWPR was chosen as it allows for spatially varying coefficients, providing a more accurate representation of localized dengue determinants.
Given these limitations, a spatiotemporal analytical method like GWPR is more appropriate, as it allows for localized parameter estimation, capturing spatial and temporal heterogeneity in dengue transmission patterns. Unlike traditional panel regression models, GWPR does not require the assumption of normally distributed residuals, as it accommodates spatial non-stationarity and localized variations. Moreover, GWPR inherently accounts for spatial dependencies, reducing the impact of autocorrelation by allowing model parameters to vary across different locations. The adoption of GWPR, therefore, provides a more nuanced and region-specific analysis, making it better suited for understanding the localized determinants of dengue incidence.
The selection of the Fixed Exponential Kernel in GWPR was based on model performance metrics (Table S4). This kernel achieved the lowest RSS (43,097.96), highest R^2^ (0.607), and lowest AIC (28,447.38), indicating strong model fit and predictive accuracy. The Fixed Kernel was chosen over the Adaptive Kernel to maintain bandwidth consistency across urban and rural areas, ensuring uniform spatial smoothing. The Exponential function was preferred over Bisquare and Gaussian as it assigns higher weights to nearby observations and gradually decreases influence over distance, effectively capturing localized variations in dengue incidence. Based on these results, the Fixed Exponential Kernel was identified as the most suitable approach for analyzing spatiotemporal determinants of dengue transmission in Yogyakarta.
The Fixed Exponential kernel was identified as the optimal model for GWPR analysis, demonstrating superior performance with the lowest Residual Sum of Squares (RSS = 43,097.96) and the highest R^2^ (0.607) and Adjusted R^2^ (0.516), indicating strong explanatory power. Additionally, it achieved the lowest AIC (28,447.38) and AICc (30,015.01), ensuring an optimal balance between accuracy and complexity. Based on these results (Table S4), the Fixed Exponential kernel was selected for analyzing spatiotemporal factors influencing dengue incidence.
The GWPR analysis using a Fixed Exponential kernel (Table 2) revealed significant spatial variability in the influence of predictors on dengue incidence across sub-districts. Climatic factors (rainfall, temperature, humidity, and atmospheric pressure) had dominant effects in most areas, while environmental factors (built areas, trees, and flooded vegetation) showed localized impacts. The coefficient distribution (Min, Q1, Median, Q3, Max) highlights variations in predictor influence across locations. Median values are used for interpretation, ensuring a stable representation of effects across sub-districts. Rainfall, temperature, and humidity generally exhibited positive associations with dengue cases, while land-use variables showed heterogeneous effects.Table 2. Model coefficient statistics for GWPR with exponential kernel in predicting dengue casesVariableMinimumQuartile 1MedianQuartile 3MaximumIntercept−7.71E+07−1.03E+07−3.63E+06−8.01E+047.32E+07Population density−2.84E+03−2.92E+02−2.02E+001.19E+022.91E+03Rainfall−7.55E+01−2.91E+001.16E+013.06E+011.03E+02Rainfall Lag 1−1.22E+011.19E+013.03E+015.92E+011.62E+02Rainfall Lag 2−2.79E+01−5.64E−011.30E+013.33E+011.34E+02Rainfall Lag 3−1.09E+02−2.26E+019.02E−011.45E+017.10E+01Average temperature−1.02E+04−1.62E+024.14E+031.07E+044.49E+04Relative humidity−6.24E+031.35E+021.30E+033.19E+031.11E+04Wind speed−3.20E+04−9.74E+021.89E+037.39E+033.63E+04Atmospheric pressure−1.39E+051.69E+033.46E+041.02E+055.39E+05Built area−3.29E+04−4.85E+014.76E+012.16E+021.84E+04Crops area−1.32E+06−2.25E+02−2.57E+012.54E+024.25E+06Water area−6.18E+05−1.08E+04−5.30E+025.22E+033.85E+06Trees area−2.16E+07−1.90E+027.04E+002.66E+021.44E+06Flooded vegetation area−7.54E+09−1.32E+068.08E+032.67E+065.10E+09Fixed bandwidth: 0.001AICc: 30,015.01AIC: 28,447.38BIC: 30,962.97Residual sum of squares: 43,097.96R-square: 0.607Adjusted R-square: 0.515
The GWPR model explained 60.75% of dengue case variability (Adjusted R^2^ = 51.55%) and demonstrated robustness with an AIC of 28,447.38 and RSS of 43,097.96, indicating a strong fit for analyzing spatiotemporal determinants of dengue incidence. The significant predictors and their district-level impacts during 2017–2022 are summarized in Table 3.Table 3GWPR results with fixed exponential kernelNoSub-districtsSignificant predictors1BantulPopulation Density, Average Temperature, Relative Humidity, Atmospheric Pressure, Water Area, Trees Area, Flooded Vegetation Area2SewonPopulation Density, Average Temperature, Relative Humidity, Atmospheric Pressure, Built Area, Crops Area, Water Area, Trees Area, Flooded Vegetation Area3KasihanPopulation Density, Average Temperature, Relative Humidity, Wind Speed, Built Area, Crops Area, Water Area, Trees Area, Flooded Vegetation Area4SedayuNo significant predictors5PajanganCrops Area, Flooded Vegetation Area6PandakPopulation Density, Rainfall Lag 1, Relative Humidity, Water Area, Flooded Vegetation Area7SrandakanNo significant predictors8SandenNo significant predictors9BambanglipuroPopulation Density, Rainfall, Water Area, Trees Area, Flooded Vegetation Area10KretekBuilt Area, Crops Area, Trees Area, Flooded Vegetation Area11PundongPopulation Density, Water Area12Jetis BantulRelative Humidity, Water Area, Trees Area13ImogiriRainfall Lag 1, Average Temperature, Atmospheric Pressure, Water Area, Trees Area14PleretPopulation Density, Rainfall Lag 1, Rainfall Lag 2, Built Area, Water Area, Trees Area, Flooded Vegetation Area15BanguntapanPopulation Density, Rainfall Lag 1, Rainfall Lag 2, Average Temperature, Relative Humidity, Built Area, Water Area, Trees Area, Flooded Vegetation Area16PiyunganPopulation Density, Average Temperature, Relative Humidity, Atmospheric Pressure, Crops Area, Water Area, Trees Area, Flooded Vegetation Area17DlingoNo significant predictors18MantrijeronRelative Humidity, Atmospheric Pressure, Built Area19KratonNo significant predictors20MergangsanPopulation Density, Built Area, Trees Area21UmbulharjoPopulation Density, Rainfall Lag 2, Average Temperature, Wind Speed, Built Area, Crops Area, Trees Area22KotagedeAverage Temperature, Relative Humidity, Atmospheric Pressure, Built Area, Crops Area, Water Area23GondokusumanAtmospheric Pressure, Built Area, Water Area24DanurejanNo significant predictors25PakualamanNo significant predictors26GondomananNo significant predictors27NgampilanPopulation Density, Built Area, Crops Area, Water Area, Trees Area, Flooded Vegetation Area28WirobrajanNo significant predictors29Gedong TengenNo significant predictors30JetisNo significant predictors31TegalrejoNo significant predictors32TemonAtmospheric Pressure, Crops Area, Flooded Vegetation Area33WatesRainfall Lag 1, Rainfall Lag 3, Atmospheric Pressure, Built Area, Crops Area, Water Area, Trees Area, Flooded Vegetation Area34PanjatanNo significant predictors35GalurNo significant predictors36LendahPopulation Density, Built Area37SentoloRainfall Lag 2, Trees Area38PengasihPopulation Density, Crops Area, Water Area39KokapPopulation Density, Built Area, Crops Area, Trees Area40GirimulyoNo significant predictors41NanggulanNo significant predictors42KalibawangWater Area, Flooded Vegetation Area43SamigaluhNo significant predictors44MoyudanCrops Area, Trees Area, Flooded Vegetation Area45MinggirNo significant predictors46SeyeganNo significant predictors47GodeanPopulation Density, Rainfall Lag 1, Rainfall Lag 3, Atmospheric Pressure48GampingPopulation Density, Rainfall Lag 1, Average Temperature, Relative Humidity, Wind Speed, Atmospheric Pressure, Trees Area49MlatiPopulation Density, Water Area50DepokPopulation Density, Rainfall Lag 1, Rainfall Lag 2, Average Temperature, Relative Humidity, Wind Speed, Atmospheric Pressure, Built Area, Crops Area, Water Area, Trees Area, Flooded Vegetation Area51BerbahNo significant predictors52PrambananPopulation Density, Average Temperature, Relative Humidity, Atmospheric Pressure, Crops Area, Water Area, Flooded Vegetation Area53KalasanPopulation Density54NgemplakNo significant predictors55NgaglikRainfall Lag 1, Trees Area56SlemanRelative Humidity, Water Area, Flooded Vegetation Area57TempelNo significant predictors58TuriNo significant predictors59PakemNo significant predictors60CangkringanNo significant predictors61GedangsariNo significant predictors62GirisuboNo significant predictors63KarangmojoRainfall Lag 3, Relative Humidity, Built Area, Crops Area, Water Area64NgawenNo significant predictors65NgliparCrops Area, Trees Area66PaliyanBuilt Area, Crops Area, Water Area, Trees Area, Flooded Vegetation Area67PanggangNo significant predictors68PatukNo significant predictors69PlayenPopulation Density, Rainfall Lag 2, Built Area, Crops Area, Water Area, Trees Area, Flooded Vegetation Area70PonjongWater Area71PurwosariNo significant predictors72RongkopNo significant predictors73SaptosariPopulation Density, Rainfall Lag 2, Rainfall Lag 3, Built Area, Crops Area, Water Area, Trees Area, Flooded Vegetation Area74SemanuPopulation Density, Crops Area, Water Area, Trees Area75SeminNo significant predictors76TanjungsariNo significant predictors77TepusNo significant predictors78WonosariPopulation Density, Rainfall Lag 1, Rainfall Lag 3, Average Temperature, Relative Humidity, Wind Speed, Atmospheric Pressure, Built Area, Crops Area, Water Area, Trees Area, Flooded Vegetation Area
Table 3 highlights the localized influences of various predictors on dengue cases across sub-districts, emphasizing the need for spatially tailored intervention strategies. Sub-districts like Wonosari and Banguntapan exhibit complex dynamics requiring multidimensional approaches integrating climatic, environmental, and demographic factors, while Sedayu and Sanden show no significant predictors, suggesting unique local characteristics or unmeasured influences.
The GWPR model’s explanatory power, measured by Local R-Square values, provides critical insights into regional variations in dengue transmission, with a detailed summary of these values and their distribution presented in the supplementary table (Table S5). The distribution of Local R-Square values from the GWPR model shows significant variation in its ability to explain dengue incidence across sub-districts in the Special Region of Yogyakarta. Sub-districts with high values, such as Pakem (0.963), Cangkringan (0.960), and Girimulyo (0.941), indicate strong model performance. Moderate values are observed in Banguntapan (0.731), Moyudan (0.7291), and Wirobrajan (0.722), suggesting reasonable effectiveness with room for improvement. Lower values in Kotagede (0.275), Sedayu (0.263), and Mantrijeron (0.215) indicate that the model struggles to capture variations in these areas. Kalibawang (0.137) has the lowest value, highlighting the model’s limited explanatory power in this sub-district.
The Local R-Square map (Fig. 2) visually represents the model’s capacity to explain dengue incidence variations, showing spatial heterogeneity in model effectiveness. Darker colors indicate better model fit, while lighter areas suggest the need for further analysis or refinement.Fig. 2. Distribution of local R-square across sub-districts based on GWPR analysis
The Local R-Square map (Fig. 2) from the GWPR model highlights spatial heterogeneity in explaining dengue incidence across sub-districts in the Special Region of Yogyakarta. Sub-districts such as Pakem, Cangkringan, and Girimulyo exhibit high Local R-Square values (above 0.75), indicating strong model performance, while Kalibawang has very low values (below 0.25), reflecting the model’s limited explanatory power in these areas. The five sub-districts with the highest dengue cases—Kasihan (0.743), Banguntapan (0.731), Sewon (0.716), Wonosari (0.623), and Wates (0.540)—demonstrate relatively good Local R-Square values, suggesting effective model performance in high-burden areas. Key predictors in Wonosari include Rainfall Lag 1, Rainfall Lag 3, average temperature, relative humidity, wind speed, atmospheric pressure, and various land-use factors. In Wates, significant predictors include Rainfall Lag 1, Rainfall Lag 3, atmospheric pressure, and land-use factors.
The model also highlights spatial gaps in areas like Sedayu and Kalibawang, suggesting the need for additional predictors to improve explanatory power. Improvements in these low-performing areas could be achieved by incorporating missing predictors such as sanitation conditions, vector control activities, and socioeconomic factors, which may influence dengue transmission. Additionally, refining the bandwidth selection in the GWPR model could help capture local variations more effectively. Alternative modeling approaches, such as Bayesian spatial models or machine learning techniques, may further enhance predictive accuracy. Incorporating interaction terms or non-linear effects could also improve the model’s ability to capture the complex relationships between predictors and dengue incidence. The Local R-Square map further reflects the need for continuous refinement to address the spatial and temporal complexities of dengue transmission.
Discussions
This study identified significant spatiotemporal variations in dengue incidence across the Special Region of Yogyakarta from 2017 to 2022, with 13,283 recorded cases and an average incidence of 2.37 cases per sub-district per month. The highest dengue incidence was concentrated in Kasihan, Banguntapan, and Sewon, areas characterized by high population density and accessibility, while Wonosari and Wates showed patterns influenced by climatic and land-use factors. Variations in rainfall, temperature, humidity, wind speed, and atmospheric pressure were observed across sub-districts, alongside differences in land-use characteristics, including built areas, agricultural land, tree cover, and water bodies [29, 30].
The GWPR analysis demonstrated strong spatial heterogeneity in dengue incidence, with the Fixed Exponential kernel model exhibiting high explanatory power. Sub-districts such as Pakem, Cangkringan, and Girimulyo had Local R-Square values above 0.75, indicating that dengue transmission in these areas is predominantly influenced by climatic and environmental factors [31–33], likely due to their lower population density and stable land-use patterns [13]. Conversely, areas like Kalibawang and Mantrijeron, with Local R-Square values below 0.25, suggest that additional unmeasured factors—such as sanitation, waste management, and vector control activities—may play a crucial role in dengue dynamics [34]. Urbanized sub-districts, including Banguntapan and Sewon, exhibited high dengue incidence, potentially driven by greater human-mosquito interaction, dense housing, inadequate drainage, and artificial water storage [35]. In contrast, weaker model performance in rural areas like Kalibawang may indicate the need for additional predictors related to socioeconomic disparities and healthcare access [36]. These findings emphasize the importance of integrating socio-environmental determinants into dengue risk assessments and adopting localized intervention strategies to enhance dengue prevention and control [37].
Key predictors of dengue incidence varied across sub-districts, underscoring the necessity of localized intervention strategies. In Wonosari, dengue transmission was significantly influenced by Rainfall Lag 1, Rainfall Lag 3, average temperature, relative humidity, wind speed, atmospheric pressure, and land-use factors such as built area, crops area, water area, trees area, and flooded vegetation area. Similarly, in Wates, key predictors included Rainfall Lag 1, Rainfall Lag 3, atmospheric pressure, and land-use characteristics, reinforcing the role of climate and environmental factors in shaping dengue risk [29, 32, 38, 39]. Sub-districts with complex dengue dynamics, such as Wonosari and Banguntapan, require multidimensional approaches integrating climatic, environmental, and demographic factors to address diverse transmission drivers, while regions with no significant predictors, like Sedayu and Sanden, may reflect unique local characteristics or unmeasured variables such as housing conditions, waste management, or social vulnerability [40, 41]. The role of urbanization, socioeconomic disparities, and environmental risks in shaping spatial dengue distribution has been highlighted in previous studies, reinforcing the necessity for targeted interventions [26, 37, 42, 43].
The Local R-Square mapping provides additional insights into model performance across sub-districts, highlighting areas where GWPR effectively captures dengue dynamics and regions requiring further refinement. High-performing sub-districts, such as Pakem, confirm that built areas and vegetation coverage significantly influence dengue transmission, while lower-performing areas like Sedayu and Kalibawang may require the inclusion of sanitation, healthcare accessibility, and vector control activities to improve explanatory power [38, 44]. This study reinforces the advantages of GWPR over global regression models by accounting for spatial heterogeneity and improving epidemiological modeling precision, ultimately supporting the development of spatially adaptive dengue prevention strategies [29, 34]. The findings emphasize the necessity of integrating climatic, demographic, and environmental variables into future dengue risk assessments, ensuring localized, evidence-based public health interventions for better disease control [45, 46].
To enhance dengue prevention and control, spatially adaptive interventions should be prioritized, leveraging the strengths of GWPR to identify localized risk factors and guide targeted strategies [37]. In densely populated urban areas such as Banguntapan and Sewon, vector control measures—including fogging, larval source reduction, and drainage improvements—should be intensified, especially during peak transmission periods [47, 48]. In climate-sensitive regions like Wonosari and Wates, where climatic and land-use factors influence dengue incidence, integrating land-use planning, sustainable water management, and climate-adaptive health policies is essential. Additionally, an early warning system incorporating climatic predictors could improve preparedness and response efforts [49–51]. In low-performing sub-districts like Kalibawang and Mantrijeron, sanitation, vector control measures, and socioeconomic factors may significantly influence dengue transmission. Unmeasured variables such as household waste management, drainage quality, frequency of fogging, larvicide application, accessibility to healthcare facilities, and population living conditions (e.g., housing density, access to clean water, and socioeconomic disparities) could play a crucial role in shaping local transmission dynamics. Incorporating these factors in future models may enhance predictive accuracy and inform more targeted interventions [52].
Future research should enhance GWPR applications by integrating entomological data, socioeconomic indicators, and healthcare accessibility to improve predictive accuracy, particularly in areas with unexplained transmission patterns [37, 53]. Long-term studies on seasonal variations and extreme weather events will refine temporal risk assessments [53]. Combining GWPR with machine learning and high-resolution spatial data can further advance dengue modeling, supporting precision-targeted interventions [54].
Limitations
This study is limited by the absence of key predictors such as socioeconomic status, mobility patterns, and entomological data, which may influence dengue transmission, particularly in low-performing sub-districts like Kalibawang. The use of aggregated sub-district data may mask micro-scale variations, reducing spatial precision, especially in densely populated areas like Banguntapan and Sewon. Additionally, while climate and environmental factors were analyzed, seasonal and extreme weather influences were not fully explored, potentially affecting long-term predictions. Since findings are geographically specific to Yogyakarta, they may not be directly applicable to other regions with different environmental and socioeconomic conditions. Future studies should incorporate finer-scale data, entomological surveillance, and machine learning approaches to improve predictive accuracy and enhance targeted dengue control interventions.
Conclusions
This study highlights the significant spatial heterogeneity in the influence of climatic, environmental, and demographic factors on dengue transmission in the Special Region of Yogyakarta. Sub-districts with high Local R-Square values, such as Wonosari, Wates, and Kasihan, demonstrate the utility of GWPR in capturing localized patterns of dengue incidence, underscoring the importance of spatially tailored intervention strategies. Conversely, low-performing sub-districts, such as Kalibawang and Sedayu, emphasize the need for additional data and predictors to refine the model and enhance explanatory power. The findings reinforce the role of spatially explicit approaches like GWPR in understanding and managing dengue dynamics, particularly in high-risk regions. Future research should integrate additional predictors and employ higher-resolution data to further enhance the effectiveness of spatial models in guiding dengue prevention and control efforts.
Supplementary Information
Additional file 1
The reference list from the paper itself. Each links out to its DOI / PubMed record.
- 1World Health Organization. Dengue and severe dengue. WHO Fact Sheet. 2022;117:1–4. https://www.who.int/news-room/fact-sheets/detail/dengue-and-severe-dengue. Accessed 9 Aug 2022.
- 2Ministry of Health of the Republic of Indonesia. Situasi Dengue (DBD) di Indonesia pada minggu ke 9 Tahun 2022. Directorate of Vector-Borne and Zoonotic Disease Prevention and Control. 2022. https://ptvz.kemkes.go.id/berita/situasi-dengue-dbd-di-indonesia-pada-minggu-ke-9-tahun-2022. Accessed 10 Mar 2022.